Standard Analysis for Single-cell scATAC-seq & scRNA-seq Multi-omics: Cell Annotation
Document Overview
For single-cell multi-omics data (where RNA and ATAC are measured in the same cell), cell annotation requires the combined consideration of two information sources: gene expression (RNA) and chromatin accessibility (ATAC). Integrating both types of evidence helps improve the accuracy and robustness of cell annotation.
一. Core Concept: Integrating Dual Evidence
RNA Evidence (Transcriptional Output): Identify cell types based on marker gene expression levels, which reflect the cell’s current "functional state".
ATAC Evidence (Regulatory Potential): Identify cell types based on chromatin accessibility in marker gene regions, reflecting the "regulatory state" of the cell.
TIP
- In practical cell annotation, some cell types (e.g., quiescent neutrophils) may have very low RNA expression, making RNA-only annotation prone to misidentification; however, their chromatin structure remains intact, so ATAC information provides valuable supplementary evidence.
- Sometimes, subpopulations of cells may have similar transcriptomic profiles but different regulatory states. By examining both RNA and ATAC data, it is possible to distinguish cell subtypes that would be difficult to separate based on a single omics modality.
二. Dual-Evidence Annotation Strategy
1) Annotation Workflow
Step 1: Examine Clustering Results
Visualize clustering results on the WNN UMAP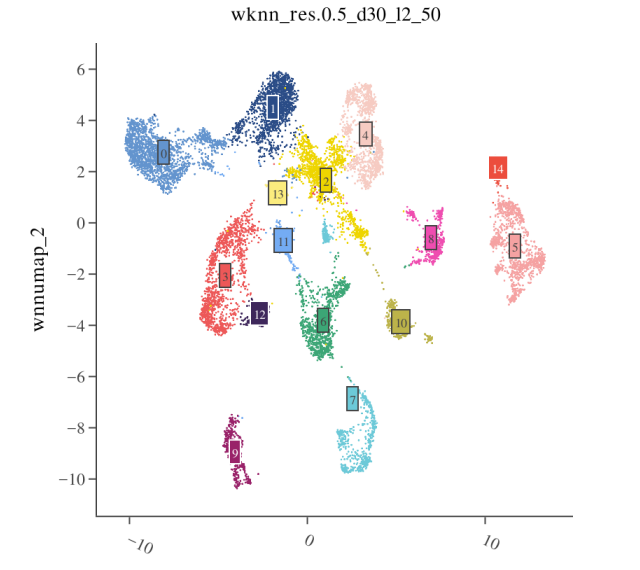
Step 2: Examine RNA Marker Genes
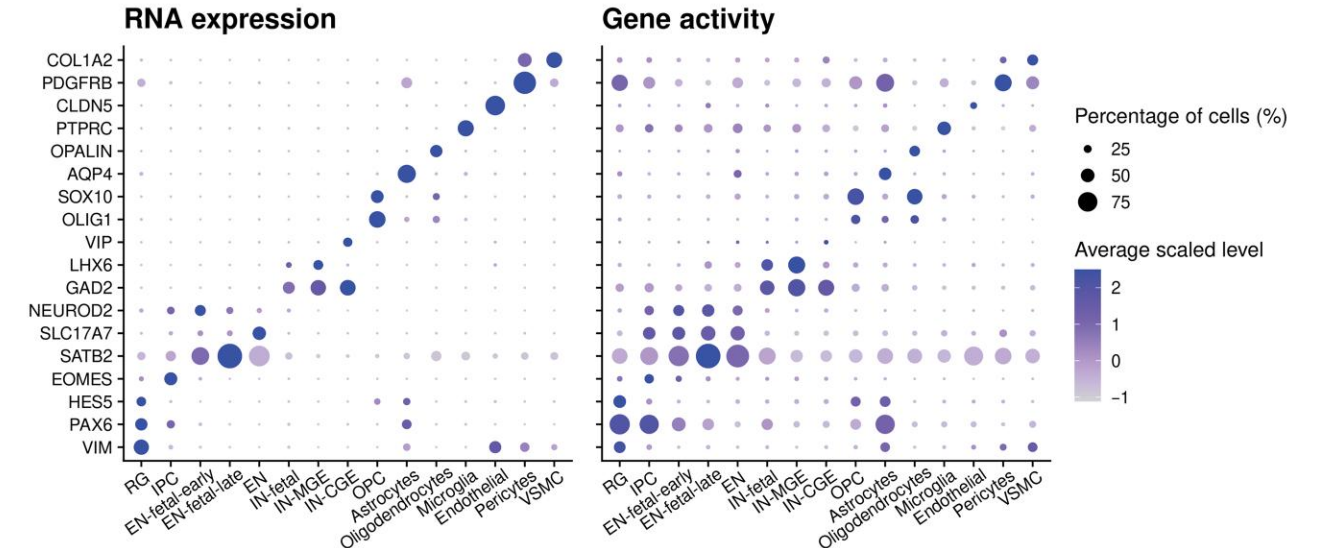
Before annotation, researchers usually consult the literature to determine the classic marker gene list for cell types in the same tissue. Use functions such as FeaturePlot() or DotPlot() to visualize the expression of these marker genes across different cell clusters.
# Assume 'data' is your Seurat object, and 'markers' is the list of marker genes you are interested in
markers <- c("CD3D", "MS4A1", "NKG7", "LYZ", "GNLY", "PPBP") # Example marker genes, can be replaced according to your specific study

# Visualize the expression distribution of each marker gene across clusters
DotPlot(
  object = data,
  features = markers,
  dot.scale = 8,
  group.by = "seurat_clusters"  # This parameter should be set to the result of WNN joint dimensionality reduction clustering
)- Step 3: Check ATAC Gene Activity
Calculate gene accessibility scores using the GeneActivity() function, and use visualization functions such as FeaturePlot() or DotPlot() to examine the accessibility of marker genes across different cell populations.
# Calculate gene activity
gene.activities <- GeneActivity(data)
data[["GeneActivity"]] <- CreateAssayObject(counts = gene.activities)

# Switch to the GeneActivity assay
DefaultAssay(data) <- "GeneActivity"

# DotPlot Visualization
DotPlot(
  object = data,
  features = markers,
  dot.scale = 8,
  group.by = "wnn_clusters" # This parameter should be filled in with the results of WNN joint dimensionality reduction clustering
)
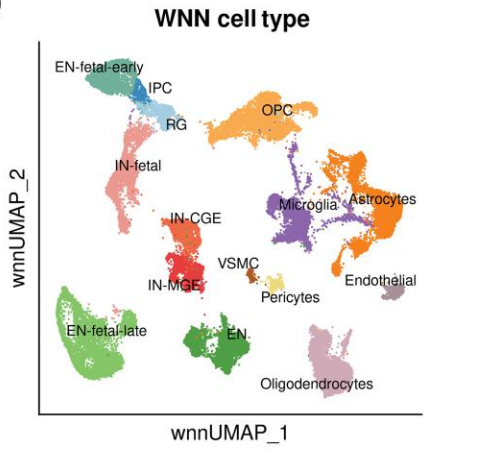
Step 4: Integrative Interpretation and Annotation
If the evidence from RNA and ATAC is consistent, you can confidently assign the cluster to a specific cell type.
If the two are inconsistent, further investigation is required:
- Data quality issues (unreliable information in one modality).
- Biological reality (e.g., cells are in a transitional state).
- Inappropriate clustering resolution (clustering resolution may need adjustment and re-clustering).
三. Frequently Asked Questions
Q1: Why are some marker genes highly expressed at the RNA level, but show low activity in ATAC?
A: This is a common and normal phenomenon. Possible reasons include:
- Post-transcriptional regulation: The RNA expression of certain genes may be affected by post-transcriptional mechanisms (such as RNA stability), and thus is not entirely dependent on chromatin accessibility.
- Time lag: Changes in chromatin accessibility often precede changes in gene expression. If cells are in a transitional state, it is possible to observe ATAC accessibility first increasing while RNA expression has not yet risen (or vice versa).
- Technical factors: ATAC-seq signals can be affected by factors such as peak calling and fragment length distribution, which may lead to some inaccuracies in gene activity calculation.
- Biological complexity: The regulation of certain genes may involve distal enhancers, while gene activity calculation generally only considers gene bodies and promoter regions, potentially missing important regulatory elements.
Recommendation: Focus primarily on marker genes that display high signal in both RNA and ATAC, as these have the strongest dual evidence and are the most reliable for annotation. For genes that are highly expressed in only one modality, additional evidence (such as a known marker gene list or reference datasets) should be considered for comprehensive judgment.
Q2: Is the calculation of gene activity (GeneActivity) accurate? What is its relationship with RNA expression?
A:
Accuracy of Gene Activity:
- Gene activity is calculated based on peak fragment counts and can be influenced by factors such as sequencing depth and peak calling quality, leading to potential errors.
- Gene activity mainly reflects the chromatin accessibility of regulatory regions, rather than direct transcriptional activity.
Relationship between Gene Activity and RNA Expression:
- Positively correlated but not identical: In general, genes with high gene activity also tend to have higher RNA expression, but the two are not completely equivalent.
- Regulatory time lag: Chromatin opening usually precedes transcription, so in some cases you may observe high ATAC activity but low RNA expression (the gene is about to be activated).
- Other regulatory mechanisms: RNA expression is also influenced by post-transcriptional regulation, RNA stability, and other factors, and is not solely dependent on chromatin state.
Recommendation: Gene activity should be used as supplementary evidence in addition to RNA expression, not as a replacement. When both modalities are consistent, annotation is more reliable; when they are inconsistent, other information should be integrated for a comprehensive judgment.
Q3: What should I do if there are clusters labeled as "Unknown" or clusters that cannot be identified in the annotation results?
A:
Check for technical issues:
- Review the QC metrics for that cluster to determine if they represent low-quality cells or doublets.
- Check the location of the cluster in UMAP space: does it overlap with or sit close to known cell types?
Expand the marker gene list:
- Identify the top marker genes for the cluster and check if any are characteristic of tissue-specific or rare cell types.
- Use databases (such as CellMarker, PanglaoDB) to look for possible cell type matches.
Temporarily label as "Unassigned":
- If the cluster truly cannot be identified, you can temporarily label it as "Unknown" or "Unassigned." Focus on these cells in subsequent analyses to see if new insights emerge.
Q4: How can I validate the accuracy of cell type annotation?
A:
Consistency of dual evidence: Check whether the marker genes for each annotated cell type are highly expressed in both RNA and ATAC modalities.
UMAP spatial distribution: Clusters belonging to the same cell type should be grouped together or form continuous regions in the UMAP space.
Marker gene specificity: Use DotPlot or VlnPlot to assess whether marker genes are specifically and highly expressed in the target cell type.