Cell Type Enrichment Analysis: Heatmap Plotting Based on Chi-Square Test and R.oe Values
Time: 3 min
Words: 435 words
Updated: 2026-02-27
Reads: 0 times
R
# Load necessary R packages
library(tidyverse) # Data processing and visualization toolkit
library(pheatmap) # Plotting package

# Define colors. Based on literature research, the following 4 colors are common and meet basic analysis needs.
MYCOLOR<-c("#FEE8C8", "#FDBB84", "#FC8D59", "#EF6548")
R
# Read metadata information
metaData <- read.table("../data/AY1724664940471/meta.tsv",header = T,sep="\t",check.names = F)
# Filter cell types to analyze
celltypes <- c("CD8_C3_GZMK","CD8_C5_CCL5","CD8_C6_STMN1","CD8_C7_TIGIT","CD4_C6_FOXP3","NK_C3_KLRC1","CD8_C1_NKG7","CD4_C3_CD40LG","NK_C1_NCR3","CD4_C1_CCR7","CD4_C2_TCF7","CD4_C5_STMN1","CD8_C4_ZNF683","CD4_C4_IFIT3","CD8_C2_HSPA1A")
metaData <- metaData %>% filter(subtype %in% celltypes)
# Filter groups to analyze, supports 2 or more groups
groups <- c("Tumor","Adjacent")
metaData <- metaData %>% filter(Tissue %in% groups)
# Chi-square test, calculate R.oe values
res.chisq <- chisq.test(table(metaData[["subtype"]], metaData[["Tissue"]]))
R.oe <- (res.chisq$observed) / (res.chisq$expected)
R
R.oe # Display R.oe valuesoutput
Adjacent Tumor
CD4_C1_CCR7 1.4147519 0.7236876
CD4_C2_TCF7 1.0647255 0.9568792
CD4_C3_CD40LG 1.1001861 0.9332549
CD4_C4_IFIT3 0.6986632 1.2007540
CD4_C5_STMN1 0.1876789 1.5411775
CD4_C6_FOXP3 0.6009658 1.2658411
CD8_C1_NKG7 1.6114391 0.5926524
CD8_C2_HSPA1A 1.5200622 0.6535287
CD8_C3_GZMK 1.1486219 0.9009864
CD8_C4_ZNF683 1.1129198 0.9247716
CD8_C5_CCL5 0.2918844 1.4717546
CD8_C6_STMN1 0.2521752 1.4982093
CD8_C7_TIGIT 0.4731300 1.3510067
NK_C1_NCR3 1.7911895 0.4729007
NK_C3_KLRC1 1.0136922 0.9908781
R
p <- pheatmap(R.oe,
  cluster_rows = FALSE,     # Whether to cluster by rows
  color = MYCOLOR,       # Set colors
  breaks = c(0, 0.5, 1, 1.5, max(R.oe)),   # Set color breaks, adjust based on max R.oe
  cluster_cols = FALSE,      # Whether to cluster by columns
  angle_col = 45,            # Set column name angle
  fontsize = 18, border_color = "white",      # Set font size, border color
  display_numbers = matrix(ifelse(R.oe > 1.5, "++", ifelse(R.oe > 1, "+","+/-")), nrow(R.oe)),    # Set heatmap number display symbols
  number_color = "black"
)
ggsave("Roe.pdf",p,width = 6,height = 8)                # Save image
ggsave("Roe.png",p,width = 6,height = 8,,bg = "white")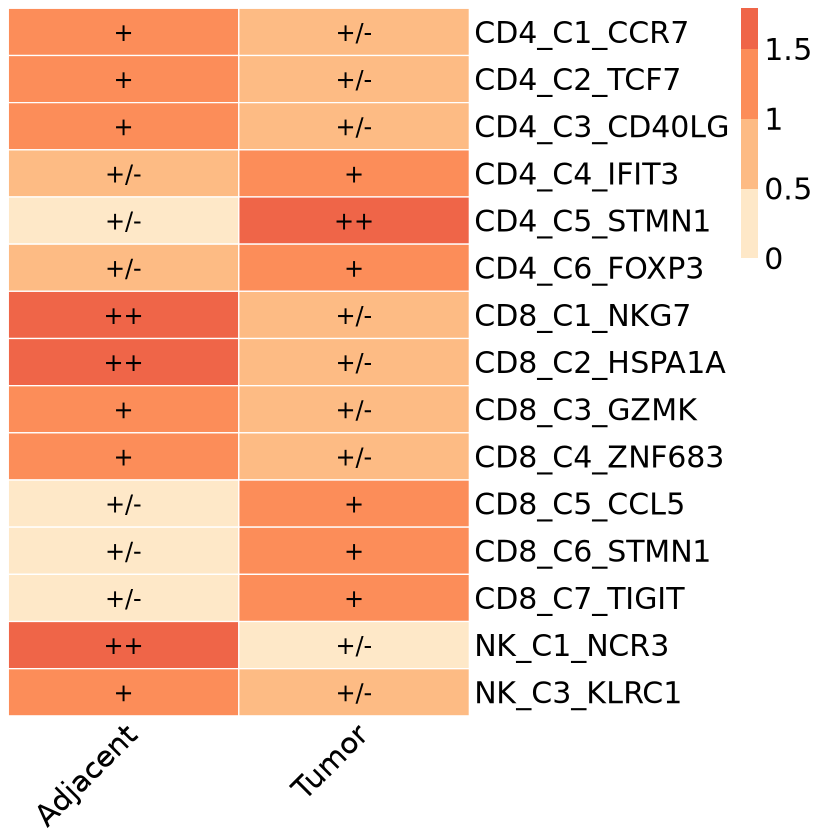
R
max(R.oe) # Display max R.oe value1.79118948167799