scFAST-seq Mutation Analysis: Dynamic Display of Mutations on Pseudotime Trajectory
Time: 9 min
Words: 1.6k words
Updated: 2026-02-28
Reads: 0 times
Select monocle2(R) environment in top right corner
Ensure monocle2 advanced analysis is completed, reading monocle2 analysis results directly here
R
library(monocle)output
Loading required package: Matrix
Loading required package: Biobase
Loading required package: BiocGenerics
Attaching package: ‘BiocGenerics’
The following objects are masked from ‘package:stats’:
IQR, mad, sd, var, xtabs
The following objects are masked from ‘package:base’:
anyDuplicated, aperm, append, as.data.frame, basename, cbind,
colnames, dirname, do.call, duplicated, eval, evalq, Filter, Find,
get, grep, grepl, intersect, is.unsorted, lapply, Map, mapply,
match, mget, order, paste, pmax, pmax.int, pmin, pmin.int,
Position, rank, rbind, Reduce, rownames, sapply, setdiff, sort,
table, tapply, union, unique, unsplit, which.max, which.min
Welcome to Bioconductor
Vignettes contain introductory material; view with
'browseVignettes()'. To cite Bioconductor, see
'citation("Biobase")', and for packages 'citation("pkgname")'.
Loading required package: ggplot2
Loading required package: VGAM
Loading required package: stats4
Loading required package: splines
Loading required package: DDRTree
Loading required package: irlba
Read monocle2 Analysis Results
Modify rds path below
Path is "data/Workflow ID/advanced_analysis/output_AdvancedAnalysisTaskID/monocle2/monocle_final.rds"
Relative directory is ../data/, absolute directory is /home/mambauser/data/
R
cds = readRDS("data/AY1732591902625/advanced_analysis/output_54833/monocle2/monocle_final.rds")R
# View meta information
head(pData(cds))| orig.ident | nCount_RNA | nFeature_RNA | mito | resolution.0.2 | resolution.0.5 | resolution.0.8 | resolution.1.1 | resolution.1.4 | Sample | raw_Sample | barcodes | CellAnnotation | singleR_blood | Neu_anno | singleR_human_all | Size_Factor | Pseudotime | State | barcode | |
|---|---|---|---|---|---|---|---|---|---|---|---|---|---|---|---|---|---|---|---|---|
| <chr> | <dbl> | <int> | <chr> | <chr> | <chr> | <chr> | <chr> | <chr> | <chr> | <chr> | <chr> | <chr> | <chr> | <chr> | <chr> | <dbl> | <dbl> | <fct> | <chr> | |
| AAGTTCGTACTGGTTCT | PBMC | 500 | 399 | 5.6 | 0 | 1 | 0 | 0 | 10 | PBMC | PBMC | AAGTTCGTACTGGTTCT | T_cells | NK Cell | Unknown | NK_cell | 0.4340618 | 16.367642 | 6 | AAGTTCGTACTGGTTCT |
| ATCAGGTGCTTTCAGAC | PBMC | 526 | 364 | 0 | 0 | 0 | 2 | 2 | 12 | PBMC | PBMC | ATCAGGTGCTTTCAGAC | T_cells | NK Cell | Unknown | T_cells | 0.4143317 | 9.843610 | 7 | ATCAGGTGCTTTCAGAC |
| GACCCTTTACGTGTTCC | PBMC | 528 | 180 | 3.2197 | 0 | 0 | 2 | 2 | 12 | PBMC | PBMC | GACCCTTTACGTGTTCC | T_cells | NK Cell | Unknown | T_cells | 0.1979931 | 13.107587 | 4 | GACCCTTTACGTGTTCC |
| CTGTATTCGACAGCATT | PBMC | 552 | 426 | 0.7246 | 0 | 0 | 2 | 2 | 12 | PBMC | PBMC | CTGTATTCGACAGCATT | T_cells | NK Cell | Unknown | T_cells | 0.4693683 | 11.759849 | 4 | CTGTATTCGACAGCATT |
| GTGTAACCGATGCGGTC | PBMC | 564 | 429 | 3.0142 | 1 | 4 | 5 | 10 | 11 | PBMC | PBMC | GTGTAACCGATGCGGTC | T_cells | T Cell | Unknown | T_cells | 0.4721374 | 0.646801 | 1 | GTGTAACCGATGCGGTC |
| AGGACTTCGAATCTCTT | PBMC | 565 | 414 | 3.1858 | 1 | 4 | 5 | 10 | 11 | PBMC | PBMC | AGGACTTCGAATCTCTT | T_cells | T Cell | Unknown | T_cells | 0.4631377 | 2.981440 | 1 | AGGACTTCGAATCTCTT |
R
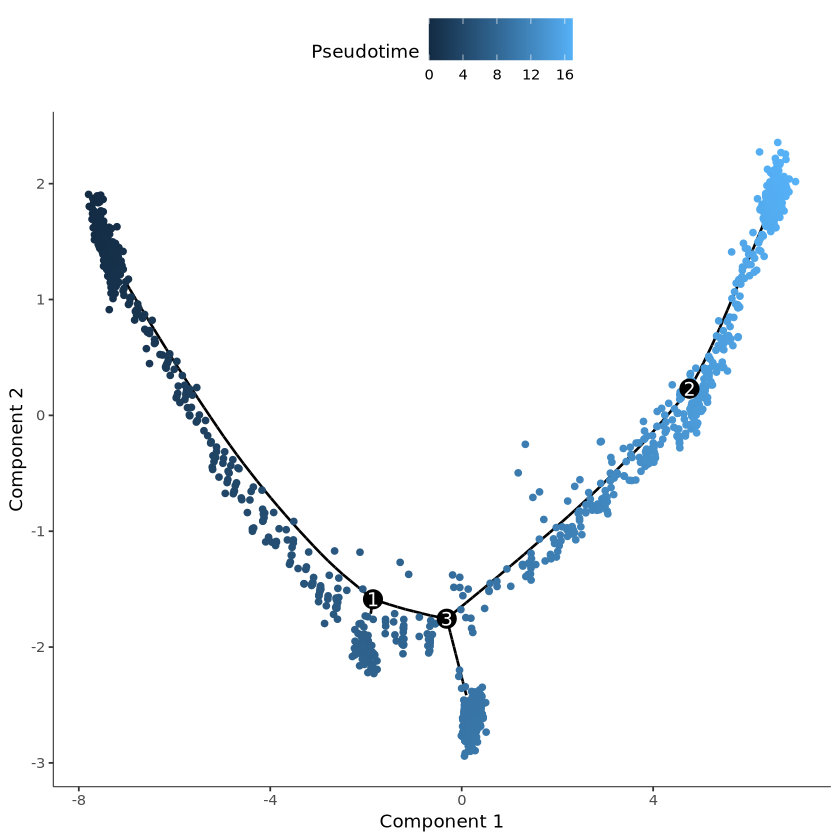
# View cell pseudotime
plot_cell_trajectory(cds, color_by = "Pseudotime")
output
Warning message:
“\`select_()\` was deprecated in dplyr 0.7.0.
ℹ Please use \`select()\` instead.
ℹ The deprecated feature was likely used in the monocle package.
Please report the issue to the authors.”
“\`select_()\` was deprecated in dplyr 0.7.0.
ℹ Please use \`select()\` instead.
ℹ The deprecated feature was likely used in the monocle package.
Please report the issue to the authors.”
R
# View cell annotation results, this data is for example only
plot_cell_trajectory(cds, color_by = "singleR_blood")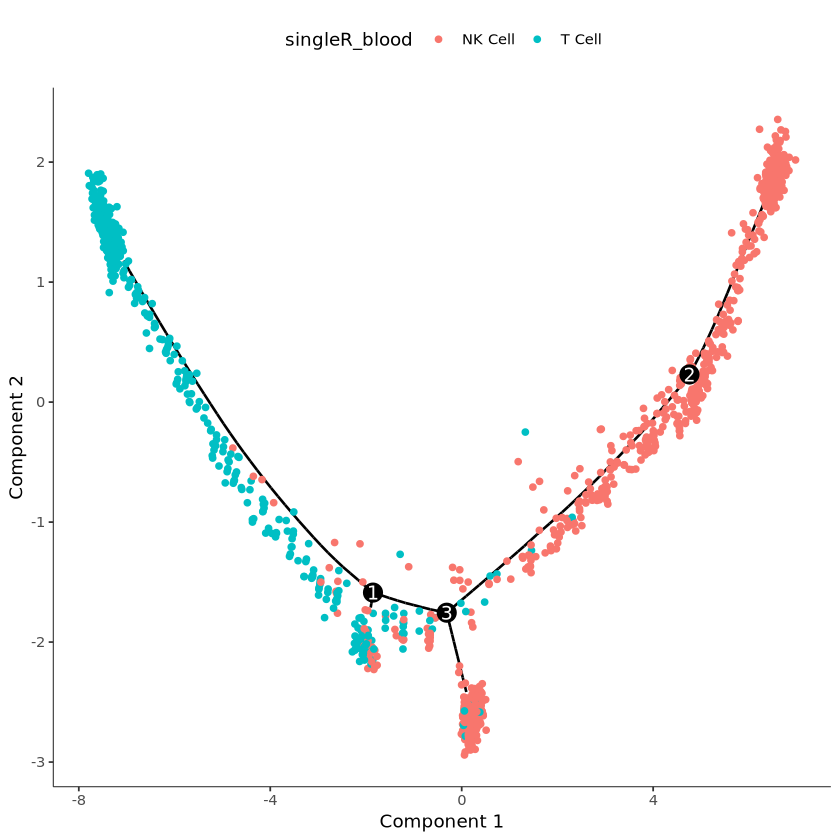
Read Mutation Data
Modify mutation matrix filename below
Two mutation matrices corresponding to this sample (all/alt, contact account manager to release, limited to full-length sequence data)
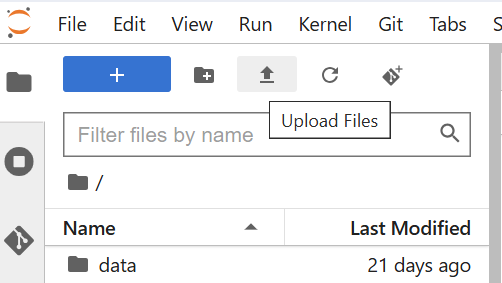
Matrix files can be uploaded by clicking upload in the top left corner
R
snv_cover_mat = read.delim("PBMC.snp_indel.all_UMI.matrix", header = T, row.names = 1)
snv_cover_mat[1:3, 1:3]

snv_mut_mat = read.delim("PBMC.snp_indel.alt_UMI.matrix", header = T, row.names = 1)
snv_mut_mat[1:3, 1:3]| AAGTTCGTACTGGTTCT | CTGCAGGTACGGAGTAG | TAACGACCGACTGCGCA | |
|---|---|---|---|
| <int> | <int> | <int> | |
| SDF4:chr1-1223263:T>G | 0 | 0 | 0 |
| SLC35E2B:chr1-1668373:C>T | 0 | 0 | 0 |
| CDK11A:chr1-1709071:C>T | 0 | 0 | 0 |
| AAGTTCGTACTGGTTCT | CTGCAGGTACGGAGTAG | TAACGACCGACTGCGCA | |
|---|---|---|---|
| <int> | <int> | <int> | |
| SDF4:chr1-1223263:T>G | 0 | 0 | 0 |
| SLC35E2B:chr1-1668373:C>T | 0 | 0 | 0 |
| CDK11A:chr1-1709071:C>T | 0 | 0 | 0 |
Can select mutation from mutation matrix row names
R
all_mut = rownames(snv_mut_mat)
all_mut[1:3]- 'SDF4:chr1-1223263:T>G'
- 'SLC35E2B:chr1-1668373:C>T'
- 'CDK11A:chr1-1709071:C>T'
Specify Mutation of Interest
e.g. "NPM1:chr5-171405326:G>A", add mutation occurrence count as new label to cds
R
interest_mut = "NPM1:chr5-171405326:G>A"
mut_num = as.numeric(snv_mut_mat[interest_mut,])
names(mut_num) = colnames(snv_mut_mat)
mut_num = mut_num[colnames(cds)]

pData(cds)$mut_num = mut_num
Display on curve, mut_num represents UMI count of this mutation
R
plot_cell_trajectory(cds, color_by = "mut_num") +
scale_color_gradient(low = "grey", high = "red")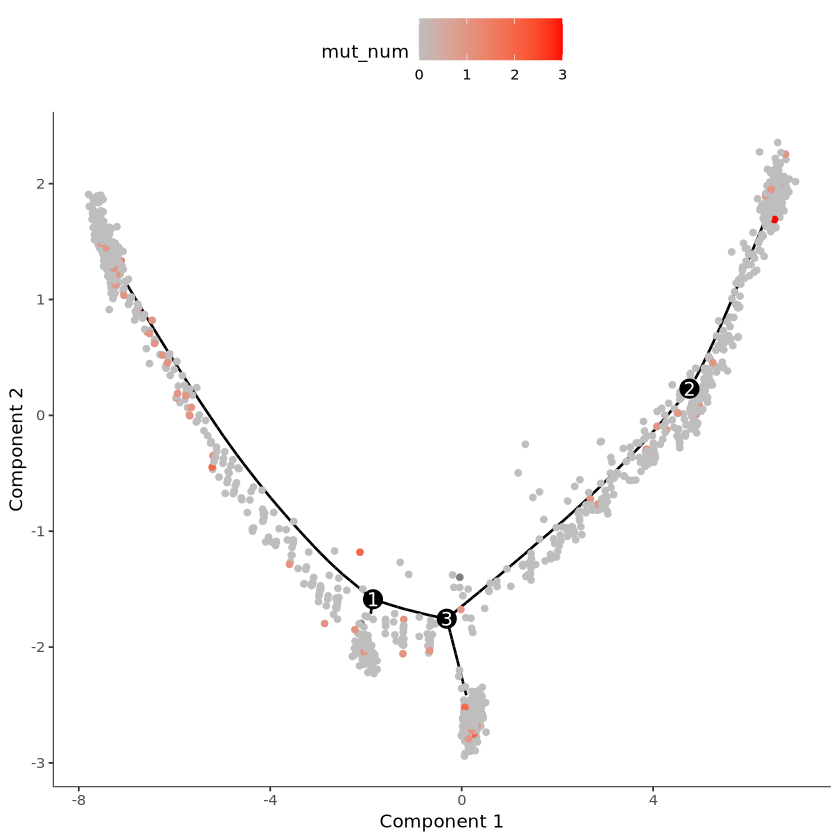
Save Image
R
p=plot_cell_trajectory(cds, color_by = "mut_num") +
scale_color_gradient(low = "grey", high = "red")
ggsave(p, file = "NPM1_G_to_A.png", width = 6, height = 6) # Saved in current directory, can be downloaded from the left