ATAC + RNA multi-omics gene activity calculation and applications
Document Overview
GeneActivity analysis infers potential transcriptional activity by calculating chromatin accessibility in gene bodies and their upstream regulatory regions, filling the information gap in single-cell ATAC data where "only open regions exist, but no gene expression levels are available". This technical document covers core concepts, calculation methods, visualization interpretation, cloud platform operations, and frequently asked questions to help you quickly understand the complete process of gene activity analysis and related results.
Core Concepts
What is GeneActivity
- Gene Activity: The activity value obtained by counting Fragments in the promoter region (typically 2 kb upstream of TSS) and gene body region of each gene, after normalization. This value reflects "whether the gene has transcriptional potential", not the actual mRNA expression level.
- Fragment: DNA Fragments obtained by Tn5 transposase cutting in open chromatin regions, serving as carriers of ATAC signals.
- Regulatory region coverage: By default, uses "gene body + upstream 2 kb" to define the statistical range, including both core promoters and recording accessibility during transcription elongation.
Gene Activity vs. Gene Expression
| Metric | Data Source | Information Reflected | Common Uses |
|---|---|---|---|
| Gene Activity | scATAC-seq | Chromatin Openness → Potential transcriptional capacity | Cell type annotation, differential accessibility genes, cross-omics comparison |
| Gene Expression | scRNA-seq | Actual mRNA abundance | Traditional differential expression, functional enrichment, trajectory analysis |
TIP
GeneActivity and Gene Expression are usually positively correlated, but inconsistencies can occur due to epigenetic silencing, post-transcriptional regulation, or technical noise. Comparing both can provide deeper insights into regulatory mechanisms.
Representation of GeneActivity Values
GeneActivity outputs a sparse matrix where rows correspond to genes and columns correspond to single cells, with matrix elements being Fragment counts in gene regions, for example:
6 x 3 sparse Matrix of class "dgCMatrix"

                      AAACCCAATGCGTGGCA_1   AAACCCAATGTGCTACT_1   AAACCCACGACATCCGG_1
Hnf4g                                .                      .                       .
Zfhx4                                .                      5                       2
Pex2                                 .                      .                       2
UBC                                  .                      .                       .
1700008P02Rik                        .                      .                       .
Pkia                                 .                      .                       .
GeneActivity Calculation and Differential Analysis
Calculation Method
Taking Signac as an example, GeneActivity analysis is divided into three stages: defining gene regions, counting fragments, and normalized output. Typical code is as follows:
library(Signac)
library(Seurat)
library(EnsDb.Hsapiens.v86)

# Build chromatin assay and add annotation
annotation <- GetGRangesFromEnsDb(EnsDb.Hsapiens.v86)
seqlevelsStyle(annotation) <- "UCSC"
genome(annotation) <- "hg38"
Annotation(atac_obj) <- annotation

# Calculate gene activity matrix (assuming atac_obj has completed QC and normalization)
gene.activities <- GeneActivity(
  object = atac_obj,
  extend.upstream = 2000,   # Upstream 2kb
  extend.downstream = 0
)

# Create GeneActivity assay and enter normalization workflow
atac_obj[["GeneActivity"]] <- CreateAssayObject(counts = gene.activities)
DefaultAssay(atac_obj) <- "GeneActivity"
atac_obj <- NormalizeData(atac_obj)
atac_obj <- ScaleData(atac_obj)
TIP
- The
extend.upstreamparameter can be adjusted according to species or research subjects (1–3 kb is most common). - Before calculating GeneActivity, ensure that fragment files are aligned with cell barcodes and basic QC is completed.
Differential GeneActivity Calculation
After the GeneActivity assay is constructed, FindMarkers() or FindAllMarkers() can be directly reused to complete differential analysis, the same as differential gene analysis methods for RNA data:
DefaultAssay(atac_obj) <- "GeneActivity"
gene_activity_markers <- FindAllMarkers(
  object = atac_obj,
  group.by = "seurat_cluster",
  min.pct = 0.1,
  logfc.threshold = 0.25,
  only.pos = TRUE,
  test.use = "wilcox"
)- Applicable scenarios: Compare all cell populations at once (
FindAllMarkers), or specify two groups (FindMarkers) to complete disease/treatment vs. control comparisons. - Recommended filtering:
p_val_adj < 0.05,avg_log2FC > 0.25,pct_in > pct_out.
Result Field Descriptions
The GeneActivity differential table is similar to differential gene tables, containing:
feature: Gene name;cluster/group: Corresponding cell type or grouping label;avgExpr/logFC: Average activity and log2FC;pct_in/pct_out: Detection rates in target group and background group;statistic,auc,p_val,p_val_adj: Statistical significance indicators.
GeneActivity Results Display
Differential Table
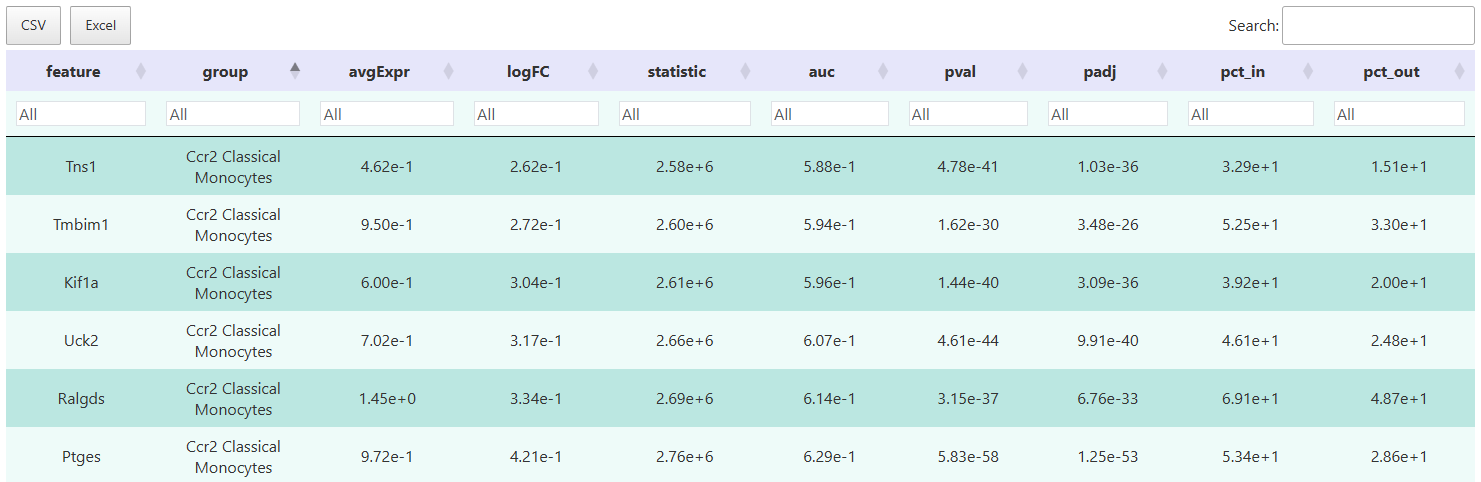
The interactive table is powerful, allowing flexible filtering of target genes based on multiple indicators such as logFC, p-values, and detection rates, supporting one-click export of results for subsequent annotation, functional enrichment analysis, or personalized visualization.
The cloud platform defaults to generating various visualizations based on logFC Top Genes, connecting ATAC and RNA modalities to help quickly locate core regulatory events.
FeaturePlot
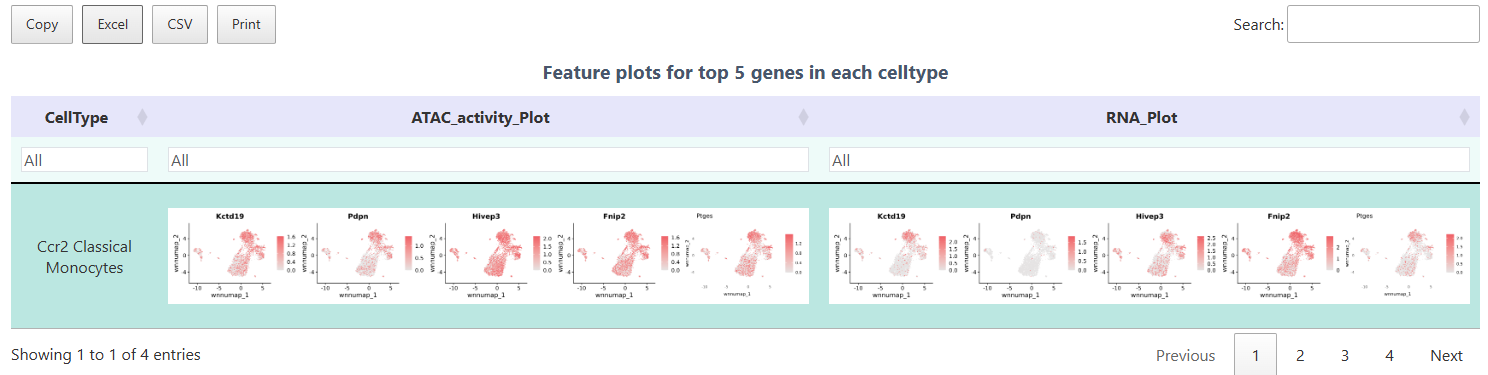
Using the FeaturePlot function to simultaneously display ATAC gene activity and RNA expression, facilitating side-by-side comparison of chromatin openness and transcription levels. Each point in the figure represents a cell, and color intensity reflects the abundance of the target gene at both ATAC (activity) and RNA (expression) levels. Through this figure, one can intuitively verify whether core Top differential genes are both open and expressed in specific cell populations, achieving rapid cross-validation of multi-omics results.
Dual Heatmap
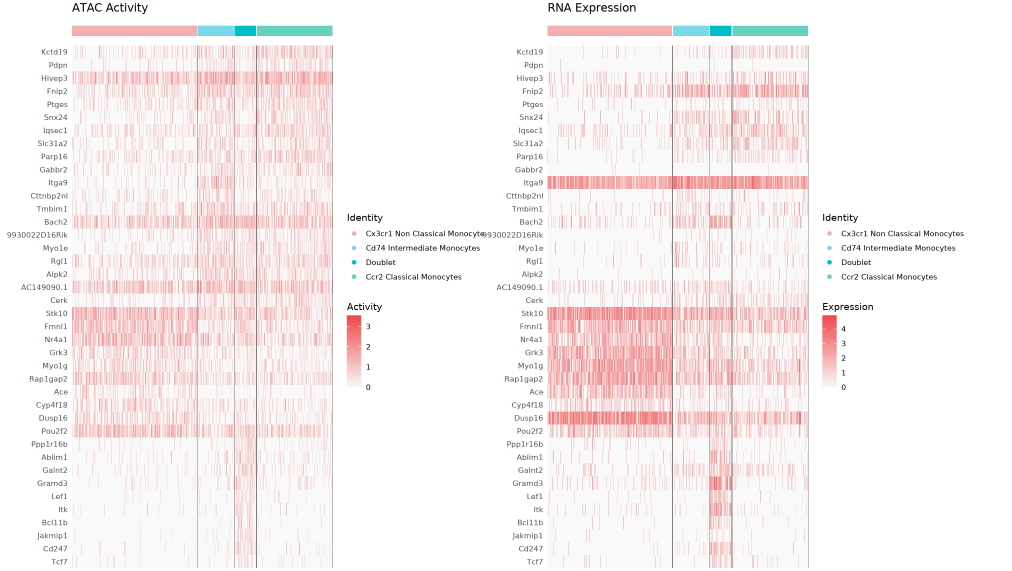
The left side displays the GeneActivity (ATAC activity) heatmap, and the right side shows the RNA expression heatmap. Each row represents a core Top differential gene, each column corresponds to a single cell, and the top uses different colors to represent cell clustering. By comparing both, one can quickly assess the consistency and potential differences between chromatin openness levels and actual transcription expression, helping to identify special regulatory phenomena such as open but not expressed, or expressed but not open.
Violin Plot
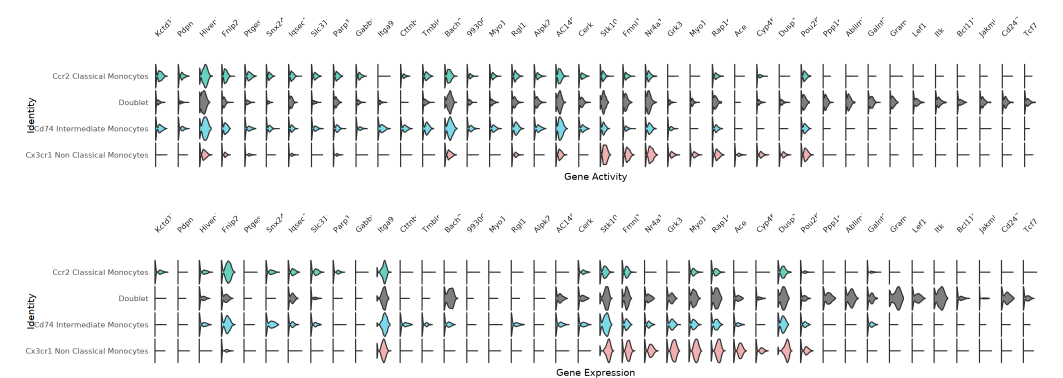
Each gene corresponds to a set of violin plots for ATAC (gene activity) and RNA (gene expression), detailing the distribution characteristics of each cell population under different modalities. This plot helps quickly locate genes with high activity but low expression, or high expression but low activity, revealing potential epigenetic regulatory mechanisms and post-transcriptional regulation phenomena.
Bubble Plot
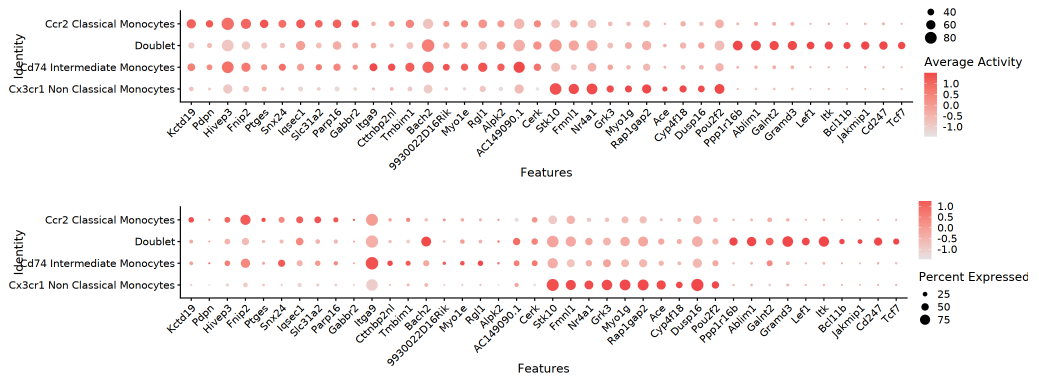
The dual-layer bubble plot intuitively reflects detection rate (pct_in) through bubble size, with color intensity representing average gene activity or expression. This plot can efficiently locate significantly differential genes in the matrix of cell populations and genes, highlighting core regulatory features at a glance.
TIP: All visualizations in this section (FeaturePlot dimensionality reduction plot, dual heatmap, violin plot, bubble plot) are comparative displays of "Top genes by gene activity differential fold change" at the RNA level (expression) and ATAC level (gene activity). Through dual-modal comparison, core regulatory genes and their cross-level expression-openness relationships can be more intuitively identified.
Multi-omics Correlation Analysis
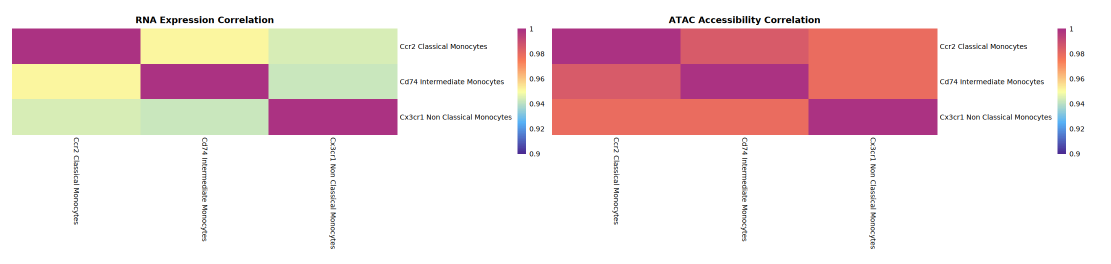
The main purpose of this section is to compare the heterogeneity and correlation of different cell populations (types) at both RNA expression and ATAC gene accessibility levels. The specific workflow is: first calculate the average RNA expression and ATAC gene activity mean for each cell population separately, generating mean matrices with cell populations as units; then based on these mean matrices, use Spearman rank correlation coefficient to perform pairwise correlation analysis for all cell populations, obtaining RNA expression correlation matrix and ATAC activity correlation matrix respectively.
- RNA correlation matrix: Evaluates the heterogeneity and similarity of transcriptional expression patterns among cell populations;
- ATAC activity correlation matrix: Reflects the consistency or diversity of each cell population in chromatin accessibility (open state).
The left side of the correlation heatmap shows RNA gene expression correlations among cell populations (or types), and the right side shows ATAC gene activity correlations. Both horizontal and vertical axes represent cell populations, and the color of each square represents the correlation coefficient (expression or activity correlation) between two cell populations: redder colors indicate higher correlation and stronger similarity; bluer colors indicate lower correlation and greater heterogeneity. Through heatmap comparison, one can intuitively assess which cell populations are highly correlated at both RNA and ATAC levels, and which are only correlated at one level, thereby revealing consistency or decoupling phenomena between epigenetic regulation and transcriptional expression.
Interpretation Recommendations:
- By comparing correlation heatmaps, observe the overall distribution of correlations between ATAC activity and RNA expression. If correlations at the ATAC level are generally higher than RNA, it indicates that expression heterogeneity is greater than gene activity heterogeneity; conversely, if RNA correlation is higher, then gene activity heterogeneity is relatively greater.
- Usually in the same single-cell multi-omics dataset, although ATAC peak openness often suggests stronger heterogeneity, the heterogeneity of ATAC-level activity represented by GeneActivity is usually smaller than RNA expression heterogeneity. Specific analysis needs to combine heatmaps and actual data situations to deeply analyze the biological significance of different levels on cell population heterogeneity.
Frequently Asked Questions
Q1: Why are GeneActivity values not completely consistent with RNA expression?
A: Chromatin openness only represents the conditions for transcription and may still be affected by inhibitory histone modifications, lack of key transcription factors, or post-transcriptional regulation. Conversely, high RNA but low GeneActivity is mostly caused by ATAC sparsity or remote enhancer regulation.
Q2: Why is "gene body + upstream 2 kb" used by default? Can it be adjusted?
A: This range balances promoters and transcription elongation stages, having both biological significance and alleviating ATAC data sparsity issues. The extend.upstream parameter can be adjusted as needed (e.g., 1 kb / 2.5 kb), but consistency across the entire data analysis must be maintained.