ATAC + RNA multi-omics motif enrichment and TF regulation inference
Document Overview
Motif Analysis is an important component for parsing transcription factor regulatory networks in single-cell ATAC-seq data. Common analysis strategies include: mining enriched Motifs in Differential Accessibility Peak sets, and performing Motif Activity differential analysis between different cell populations. This document will systematically explain the basic concepts of Motifs, Motif Enrichment Analysis methods for Differential Accessibility Peak sets, and Motif Activity differential analysis.
Core Concepts: What is a Motif
Definition of Motif
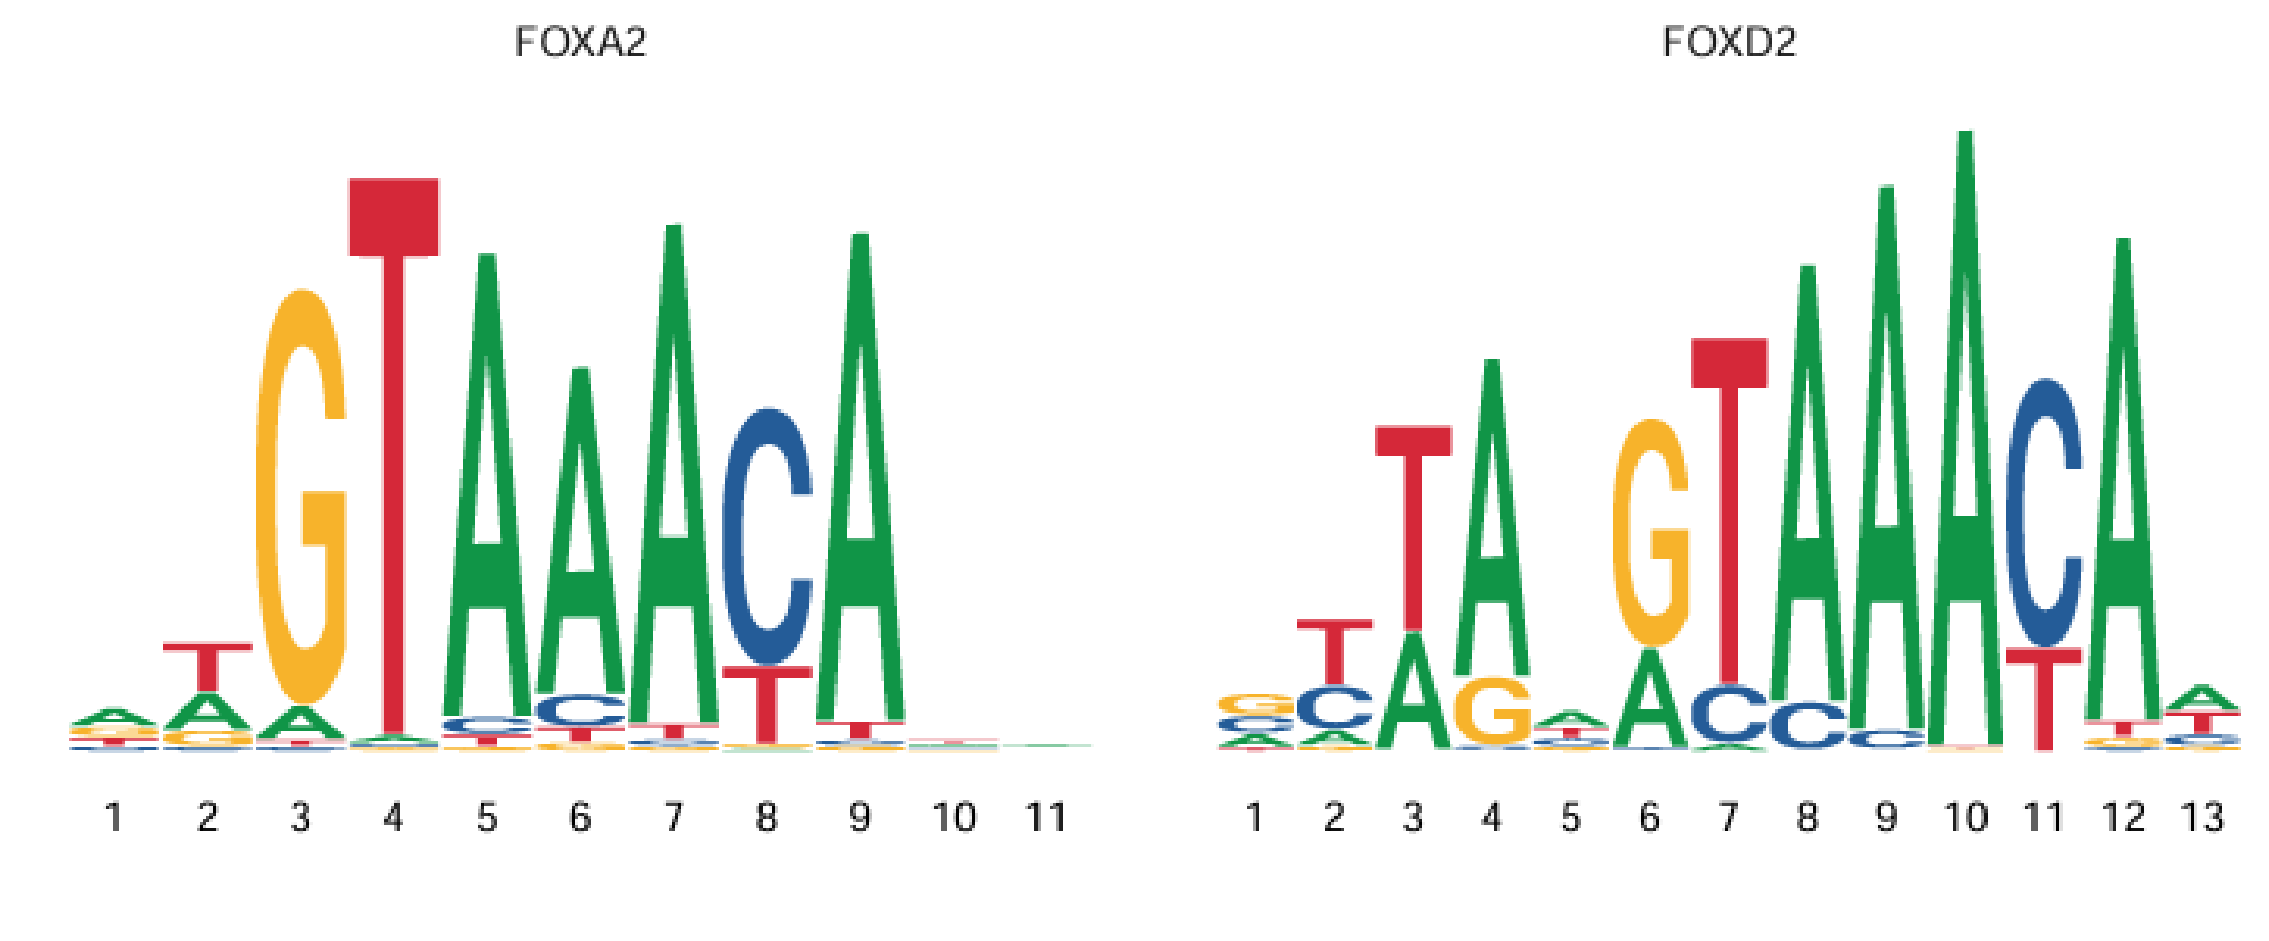
Transcription factors need to bind to DNA open regions (Peaks) to exert regulatory effects. Each transcription factor usually has preferred binding sequences (e.g., SP1 prefers GC-rich sequences). These sequence patterns are Motifs. Therefore, Motif (sequence motif) can be understood as the DNA sequence pattern of transcription factor binding sites, usually composed of 6-20 base pairs. As shown below:
Motif Databases
So far, multiple authoritative databases have integrated and improved Motif information for different species, providing structured and comprehensive data resources for subsequent analysis. Commonly used Motif databases include: JASPAR database, HOMER, MEME Suite, TRANSFAC, among which the JASPAR database is the most commonly used transcription factor binding site database, containing Motifs for multiple species.
TIP
Early determination of Motifs mainly relied on experimental methods (such as ChIP-seq, SELEX, etc.) or bioinformatics prediction, resulting in scattered and limited transcription factor binding sequences. With deepening research and accumulation of large amounts of experimental data, Motif information has been continuously enriched and standardized. Motif information is now relatively complete, and Motif information for corresponding species can be directly accessed through various databases.
Motif Enrichment Analysis
What is Motif Enrichment
Motif Enrichment refers to counting the frequency of each specific Motif in specific genomic regions (such as Differential Peaks) and comparing it with the frequency in Background Peaks (such as all Peaks or matched controls). If a Motif appears significantly more frequently in Differential Peaks than in the background, it is considered that the Motif is "enriched" in these regions.
Simply put, it counts how many times a Motif appears in certain regions (such as Differential Peaks), then compares with background regions. If it appears more in Differential Peaks, the Motif is considered enriched.
Applications include:
- Comparing Peak openness between different cell types or states, screening Peaks specifically open in a certain type or state, then analyzing their enriched Motifs to infer corresponding key regulatory factors.
- Performing Motif Enrichment Analysis on Differential Peaks (e.g., disease group vs. control group) to mine TFs related to regulatory abnormalities, assisting biological mechanism interpretation and functional attribution.
TIP
To more intuitively understand the application of Motif Enrichment Analysis on Differential Peaks, you can refer to actual cases and consult the Motif Enrichment Analysis section for Differential Peaks in single-cell multi-omics data. For details, see "Single-cell ATAC_RNA Multi-omics Differential Peak Analysis".
Implementation of Motif Enrichment Analysis
Taking Signac as an example, Signac uses the AddMotifs() function to add motif information to Seurat objects and uses FindMotifs() for motif enrichment analysis. Below are key code examples (using human, hg38 as an example):
library(Signac)
library(JASPAR2022)
library(TFBSTools)

# Load motif database (using human species as an example)
pfm <- getMatrixSet(
  x = JASPAR2020,
  opts = list(collection = "CORE", tax_group = "vertebrates", all_versions = FALSE)
)

# Add motif information to ATAC object (e.g., atac)
DefaultAssay(obj) <- "ATAC"
obj <- AddMotifs(
  object = obj,                  # Your Seurat/Signac object
  genome = BSgenome.Hsapiens.UCSC.hg38, # Note: load appropriate genome package
  pfm = pfm
)

# Perform motif enrichment analysis on peaks of interest, using all peaks in obj as background peaks
motif.results <- FindMotifs(
  object = obj,
  features = diff_peak    # For example, list of differential peaks from differential analysis
)

head(motif.results)| motif | observed | background | pct.obs | pct.bkg | fold.enrich | pvalue | motif.name | p.adjust |
|---|---|---|---|---|---|---|---|---|
| MA0497.1 | 556 | 8315 | 49.16 | 20.79 | 2.365 | 0 | MEF2C | 0 |
| MA0052.4 | 533 | 7948 | 47.13 | 19.87 | 2.372 | 0 | MEF2A | 0 |
| MA0773.1 | 398 | 4930 | 35.19 | 12.33 | 2.855 | 0 | MEF2D | 0 |
| MA0660.1 | 345 | 4002 | 30.50 | 10.01 | 3.049 | 0 | MEF2B | 0 |
| MA1151.1 | 286 | 3206 | 25.29 | 8.02 | 3.155 | 0 | RORC | 0 |
| MA0592.3 | 350 | 4669 | 30.95 | 11.67 | 2.651 | 0 | MEF2A | 0 |
motif: The Motif ID in the database, usually representing a specific transcription factor's binding sequence.observed: The number of target Peaks (such as Differential Peaks) containing this Motif.background: The number of Background Peaks (control group or all Peaks) containing this Motif.pct.obs: The percentage of target Peaks with this Motif (= observed/total target Peaks × 100%).pct.bkg: The percentage of Background Peaks with this Motif (= background/total Background Peaks × 100%).fold.enrich: The enrichment fold of the Motif in target Peaks, = pct.obs / pct.bkg. Larger values indicate greater Motif enrichment in Differential Peaks.pvalue: The raw P-value for statistical significance of Motif Enrichment Analysis. Smaller values mean enrichment is less likely to be random. motif.name: The transcription factor name corresponding to the Motif, facilitating intuitive identification of regulatory factors.p.adjust: The P-value after multiple hypothesis testing correction (such as FDR correction). p.adjust < 0.05 is often considered significant enrichment.
Through the above indicators, we can determine which Motifs (and their corresponding transcription factors) are significantly and strongly enriched in Differential Peaks, thereby revealing key TFs that may be involved in regulation.
TIP
Background Peaks:
- Refers to a set of Peaks used as controls in Motif Enrichment Analysis, usually representing all Peaks or Peaks with no significant differences. Their role is to provide a baseline for the frequency of a certain Motif in Peaks of interest (such as Differential Peaks).
- By comparing the enrichment level of a Motif in Differential Peaks versus Background Peaks, we can determine whether the Motif is significantly enriched under specific biological states.
- The FindMotifs() function can provide a feature vector as a background set through the background parameter, or provide a number to specify the number of randomly selected features as a background set.
Motif Activity Analysis
What is Motif Activity
- Motif Activity is an indicator measuring the potential binding and regulatory capacity of a transcription factor's Motif in specific cells.
- Unlike Motif Enrichment Analysis, Motif Activity does not simply count the number of Motif occurrences, but considers which Peaks contain the Motif in that cell, as well as the openness of these Peaks.
Calculation of Motif Activity
Taking Signac as an example, the main workflow and R code for Motif Activity analysis are as follows:
library(Signac)
library(Seurat)
library(JASPAR2022)
library(TFBSTools)
library(BSgenome.Hsapiens.UCSC.hg38) # Or adjust according to your species

# Get motif dataset
pfm <- getMatrixSet(
  x = JASPAR2022,
  opts = list(collection = "CORE", tax_group = "vertebrates")
)

# Add motif information to ATAC object (assuming object name is obj, Assay name is ATAC)
obj <- AddMotifs(
  object = obj,
  genome = BSgenome.Hsapiens.UCSC.hg38,
  pfm = pfm
)

# Run chromVAR to calculate motif activity
obj <- RunChromVAR(
  object = obj,
  genome = BSgenome.Hsapiens.UCSC.hg38
)
Viewing Motif Activity Results
- After completion, a new Assay named "chromvar" will be added to the object. Motif activity can be visualized using Seurat's FeaturePlot.
- For example, the activity of a specific motif can be visualized on UMAP:
FeaturePlot(obj, features = "MA0497.1", assay = "chromvar")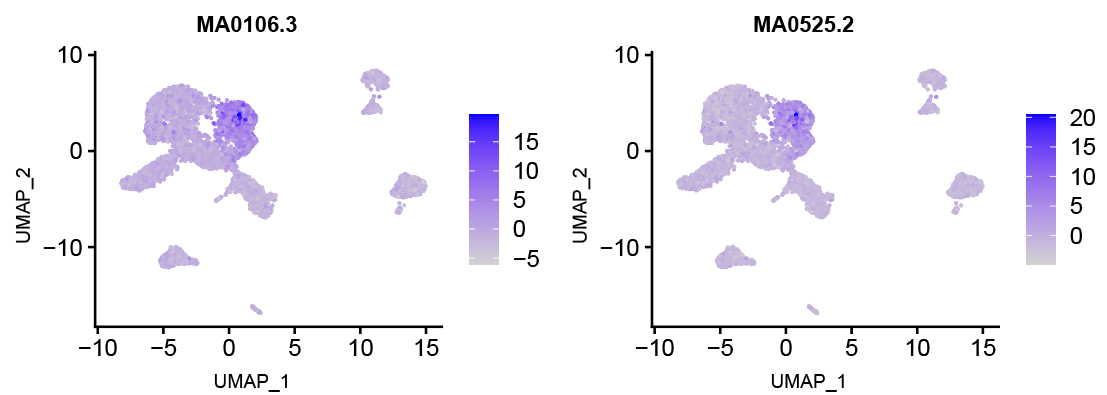
- Motif Activity Score Interpretation
- Positive deviation score: The motif is active in this cell, TF may be functionally active.
- Negative deviation score: The motif is inactive or suppressed in this cell.
- Deviation score close to zero: Activity shows no significant difference from background.
WARNING
Notes
- It is recommended to use the appropriate genome version for the species when calculating motif activity.
- Analysis takes longer when motif numbers or cell numbers are large, parallel processing can be combined for acceleration.
Differential Analysis of Motif Activity
In the previous section, we introduced how to calculate the activity score (chromVAR deviation score) for each motif at the single-cell level. After obtaining these motif activity score matrices, we often want to compare which motifs have significant activity differences between different cell types or states, thereby further inferring key transcription factors.
Direct Differential Motif Activity Analysis
Compared to motif enrichment analysis based only on differential peaks, directly comparing motif activity differences between cell categories usually shows high consistency and can reflect more intuitive regulatory activity levels.
Taking the Signac/Seurat analysis framework as an example, the FindMarkers() and FindAllMarkers() functions can be used to directly perform differential analysis between two groups/categories of cells on z-scores obtained from chromVAR (i.e., values in the motif activity matrix). At this time, the following parameters are commonly used to obtain "the difference in average z-scores between different categories":
differential.activity <- FindMarkers(
  object = obj,
  ident.1 = 'Pvalb',# Compare motif activity differences between 'Pvalb' and 'Sst' cell groups
  ident.2 = 'Sst',
  only.pos = TRUE,
  mean.fxn = rowMeans,
  fc.name = "avg_diff"
)
TIP
FindAllMarkers()is suitable for automatically comparing each cell population with all other populations at once, very suitable for comprehensive differential analysis of multi-component clustering (such as multiple cell types or states).FindMarkers()is suitable for direct comparison between two groups (such as disease group vs. control group), enabling flexible one-to-one differential peak screening, more convenient for precise comparison between specific groups.
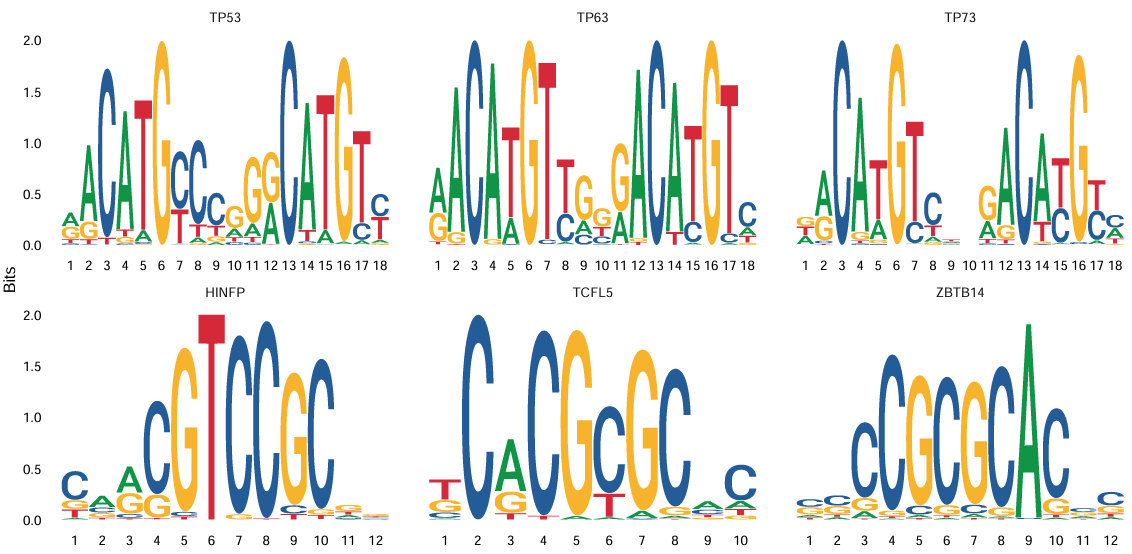
After obtaining differential motifs, MotifPlot can be used to visualize significant motifs:
MotifPlot(
  object = obj,
  motifs = head(rownames(differential.activity)),
  assay = 'peaks'
)
Motif Activity Interpretation
In multi-omics data, both can be checked simultaneously: Motif activity (ATAC data) and TF expression (RNA data)
Consistent Motif Activity and TF Expression
Ideally, if a transcription factor is active in a certain cell type, its motif activity should be high, and its RNA expression should also be high.
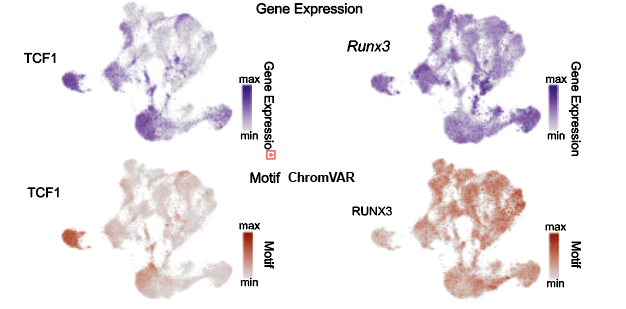
Inconsistent Motif Activity and TF Expression
- High motif activity but low TF expression, possible reasons:
- Transcription factor regulates in a non-expression-dependent manner (e.g., through co-activators)
- Transcription factor exists at protein level but RNA level is low
- Other transcription factors share the same motif
- High TF expression but low motif activity, possible reasons:
- Transcription factor may bind to other regions (non-peak regions)
- Transcription factor may function in a DNA-binding-independent manner
TIP
Identification of Key Transcription Factors:
- In multi-omics data, transcription factors with both high motif activity and high TF expression should be prioritized.
- These TFs are usually core regulatory factors supported by "combined evidence", having both strong binding potential (motif activity) and clear expression (RNA), and may directly regulate related target genes (peak-gene associations).
Biological Applications of Motif Analysis
Cell Type-Specific Regulatory Factors
Identifying Cell Type Marker TFs:
- By comparing motif activity between different cell types, transcription factors specific to each cell type can be identified.
- These TFs can serve as regulatory markers for cell types, similar to marker genes at the gene expression level.
- For example, SPI1/PU.1 is a marker transcription factor for microglia; PAX5 is a marker transcription factor for B cells.
Disease-Related Regulatory Abnormalities
Motif Activity Abnormalities in Disease Samples:
- By comparing motif activity between disease samples and control samples, which transcription factors have abnormal regulation can be identified.
- These abnormalities may suggest regulatory mechanisms of the disease or potential therapeutic targets.
- For example, in Alzheimer's disease, motif activity of certain transcription factors (such as ZEB1, MAFB) may be abnormal.
Advantages of Multi-omics Data
RNA-ATAC Integration Validation:
In multi-omics data, both can be checked simultaneously:
- Motif activity (from ATAC): Reflects the potential binding capacity of transcription factors.
- TF expression (from RNA): Reflects the actual expression level of transcription factors.
If a transcription factor has both high motif activity and high expression, it indicates that the TF is active and involved in regulation in that cell.
TIP
Triple-Evidence Regulatory Analysis:
- Peak-Gene-TF Trio Analysis:
- Identify differentially open peaks (differential peak analysis).
- Associate peaks with nearby genes (gene annotation).
- Identify motifs enriched in peaks (motif analysis).
- Validate correlations between TF expression and peak openness, gene expression (multi-omics integration).
- Through triple-evidence integration, key transcription factors and regulatory mechanisms can be more reliably identified.
- Peak-Gene-TF Trio Analysis:
Frequently Asked Questions
Q1: What is the difference between Motif Activity and Motif Enrichment?
A: They are related but different:
Motif Enrichment:
- Focus: Which motifs are significantly enriched in specific peak sets (such as differential peaks).
- Method: Count the frequency of motifs in target peak sets and compare with background.
- Result: Obtain a motif enrichment list, indicating which TFs may regulate these peaks.
- Application: Usually used for functional interpretation after differential peak analysis.
Motif Activity:
- Focus: The activity level of each motif in each cell.
- Method: Consider the openness of peaks containing the motif in that cell and calculate deviation scores.
- Result: Obtain a cell × motif activity matrix.
- Application: Can be used for cell clustering, identifying cell type-specific TFs, analyzing dynamic changes in TF activity.