ATAC + RNA multi-omics Peak2Gene peak-gene linking analysis
Document Overview
Peak2Gene (Peak-Gene linking) analysis is a method specifically designed for single-cell multi-omics (ATAC + RNA) data. Its core goal is to identify significant regulatory relationships between gene expression and nearby chromatin accessibility peaks. This method infers which peaks may be involved in regulating which genes by statistically analyzing correlations between gene expression levels and ATAC signal intensities of nearby peaks in each cell, and using generalized linear models to correct for technical biases such as GC content, peak length, and distance. Peak2Gene analysis not only helps reveal cis-regulatory networks (such as enhancer-gene connections) but can also be combined with motif enrichment/activity results to systematically mine direct target genes and regulatory roles of key transcription factors, making it one of the fundamental tools for multi-omics regulatory mechanism research.
Significance of Peak2Gene Analysis
Peak2Gene analysis aims to reveal the true regulatory connections between chromatin accessibility (Peak) and gene expression (Gene) by integrating single-cell ATAC-seq and RNA-seq data, making it one of the core technologies for parsing multi-omics regulatory networks.
Introduction to Gene Regulatory Networks
Gene Regulatory Networks (GRN) consist of transcription factors (TF), regulatory elements (such as promoters, enhancers, peaks), and target genes. TFs bind to open chromatin regions by recognizing specific DNA motifs, thereby affecting downstream gene transcription. The advantage of single-cell multi-omics approaches is that they can simultaneously observe TF and target gene expression (scRNA-seq) and chromatin accessibility of TF binding sites (scATAC-seq, combined with motif identification for inference) at single-cell resolution.
By combining single-cell ATAC and RNA data, the following can be achieved:
- Determination of TF expression profiles
- Assessment of openness of TF binding sites (peaks)
- Inference of motif enrichment and functional activity
- Monitoring dynamic changes in target gene expression
This three-dimensional integration of "TF expression × motif-peak binding × target gene expression" helps reconstruct regulatory causal chains at single-cell scale, precisely capture key regulatory and target sites, and provide footholds for GRN mapping and mechanism exploration.
How Does Peak2Gene Analysis Help Resolve GRN Gene Regulatory Networks
- Through Motif analysis, we can understand the regulatory relationships between TFs and Peaks. Motif analysis identifies regions in open chromatin peaks that may be bound by TFs by comparing with known transcription factor recognition sequences, serving as an important foundation for precisely describing TF→peak regulatory relationships. These motif-enriched peaks are considered potential targets of TF regulation and form the "upstream" foundation of regulatory networks. For specific content on Motif analysis, please read Detailed Motif Analysis and Practical Workflow
- Peak2Gene analysis, on the other hand, precisely captures regulatory pairings between each peak and its potential target genes by examining correlations between peak accessibility signals and nearby gene expression at the single-cell level, overcoming limitations of annotation based solely on linear distance. This strategy powerfully characterizes real evidence of open peaks actually participating in gene regulation, explaining the "downstream" links of regulatory networks.
- Combining motif analysis (TF→peak) with Peak2Gene analysis (peak→gene) can systematically depict the direct regulatory axis among TFs, regulatory element peaks, and their target genes, providing multiple lines of evidence support for multi-omics regulatory mechanism research.
Standard Analysis Workflow
- Differential peak screening: Locate open regions with biological significance;
- Peak2Gene annotation: Integrate expression and distance to establish peak–gene associations;
- Motif analysis: Identify and evaluate motif enrichment and activity to predict key TFs;
- Multi-omics joint validation: Analyze regulatory consistency among motif activity, TF/target gene expression, and peak accessibility.
Implementation of Peak2Gene Analysis
In the Signac package, peak-gene correlation analysis is mainly implemented through the core function LinkPeaks(): For each gene, by calculating correlations between the gene's expression level and accessibility signals of nearby peaks, and correcting for various technical biases such as GC content, overall accessibility, and peak length, the set of peaks that may regulate the gene is identified.
For each target gene:
- Filter peaks within a certain distance range from the gene (e.g., ±500kb);
- Calculate correlations between accessibility of these peaks and gene expression;
- Use generalized linear models to correct biases such as GC%/peak size/overall accessibility, obtaining more reliable peak-gene associations.
This approach can precisely quantify the regulatory supporting evidence of each peak for target genes, making it a key step in reconstructing multi-omics regulatory networks. When implementing actual projects, it is recommended to first evaluate gene sets of interest, and can also be extended to genome-wide automatic annotation.
# First use RegionStats() to annotate features such as GC content for each Peak region, for subsequent bias correction
DefaultAssay(obj) <- "ATAC"
obj <- RegionStats(obj, genome = BSgenome.Hsapiens.UCSC.hg38)

# LinkPeaks(): Establish correlations between Peaks and genes based on generalized linear models, perform multiple bias corrections, and obtain significant Peak-Gene associations
obj <- LinkPeaks(
  object = obj,
  peak.assay = "ATAC",
  expression.assay = "SCT",
  genes.use = c("LYZ", "MS4A1") # Only calculate specified genes; omit this parameter for genome-wide analysis
)
Peak2Gene Results Display
Peak-Gene Correlation Heatmap
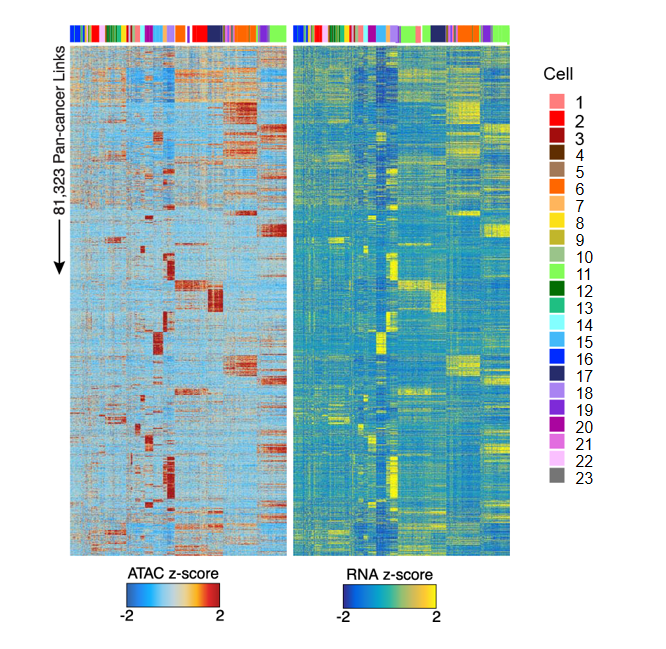
The heatmap displays correlation patterns between chromatin open regions (Peaks) and gene expression. The heatmap is divided into two parts:
- ATAC heatmap (left): Displays ATAC-seq signal intensity (chromatin accessibility), with blue indicating low accessibility and red indicating high accessibility.
- RNA heatmap (right): Displays expression levels of corresponding genes, with blue indicating low expression and yellow indicating high expression.
- Each row represents a Peak-Gene pair, and each column represents a single cell.
- The top color bar identifies different cell types or populations, facilitating observation of Peak-Gene association patterns in specific cell populations.
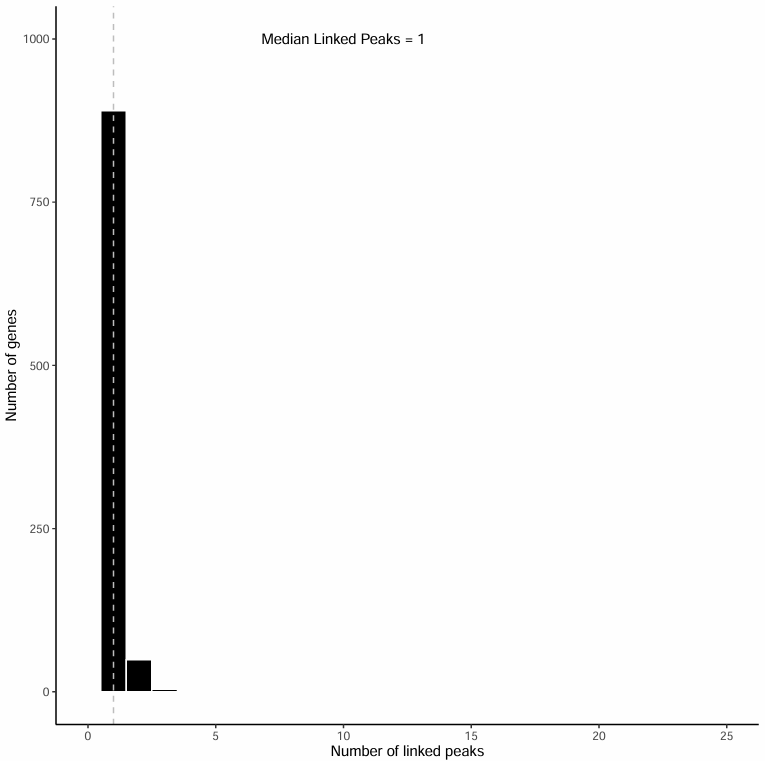
Distribution Histogram of Associated Peak Numbers
This histogram displays the distribution of the number of Peaks (1~25) associated with each gene:
- Horizontal axis: Number of Peaks associated with genes (1~25)
- Vertical axis: Number of genes with corresponding associated Peak numbers
- Dashed line indicates median position, with text annotation showing the specific median
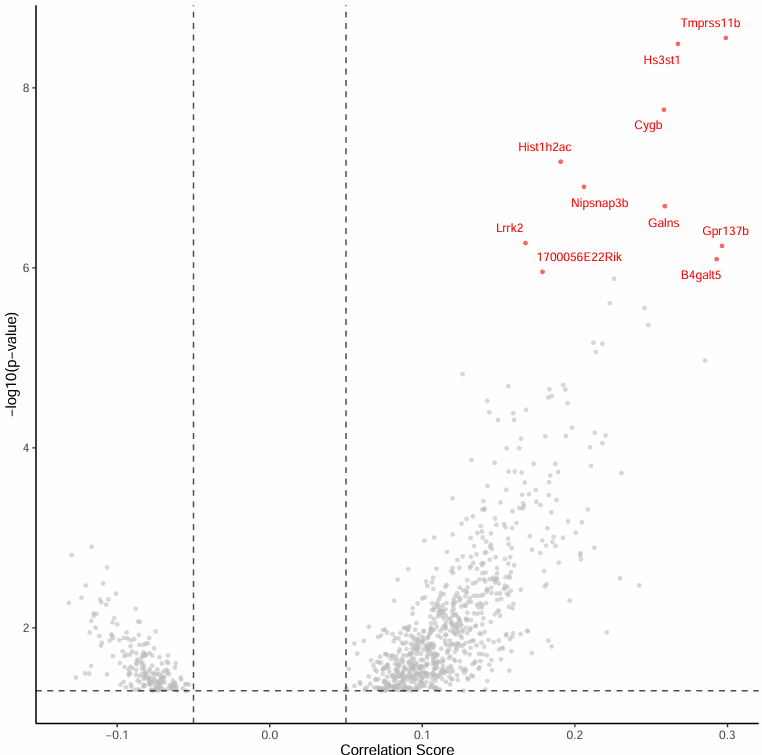
Top Significant Peak-Gene Association Volcano Plot
The volcano plot focuses on the Top 10 most significant Peak-Gene associations:
- Horizontal axis: Correlation score
- Vertical axis: -log10(p) value
- Top 10 significant genes are annotated for intuitive presentation
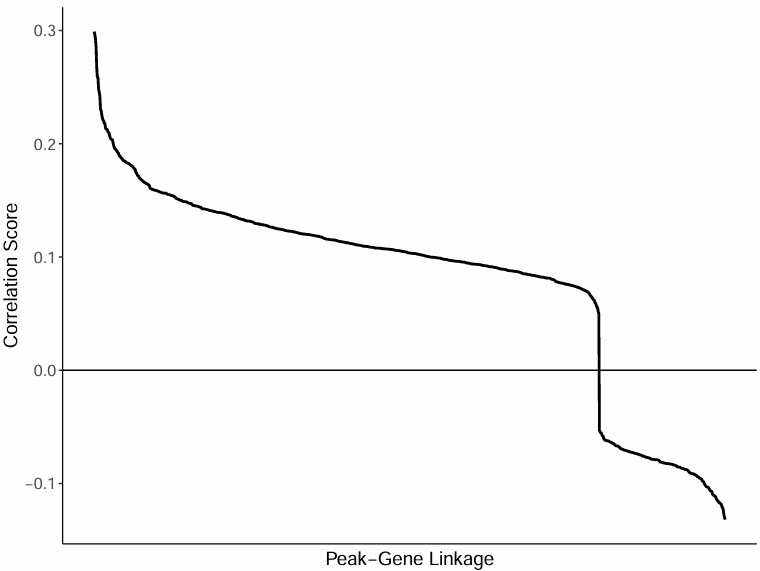
Correlation Distribution Curve for All Peak-Gene Pairs
The curve plot overall displays the correlation coefficient distribution of all Peak-Gene pairs, showing the distribution and trends of Peak-Gene pairs with strong correlations:
- Horizontal axis: Peak-Gene pairs (sorted from high to low correlation)
- Vertical axis: Corresponding correlation coefficients
Frequently Asked Questions
Q1: What is the relationship between Peak2Gene analysis and Motif Enrichment?
A: They focus on different aspects but their results can complement and validate each other.
- Peak2Gene: Mainly answers "which Peaks actually regulate which genes", determining Peak-Gene regulatory relationships through correlation, outputting Peak-Gene pairings and correlation scores.
- Motif Enrichment: Focuses on "which transcription factor binding sites (Motifs) are enriched in a certain set of Peaks", reflecting which TFs may regulate these Peaks, outputting Motif abundance and statistical significance.
Q2: Why are there fewer associations obtained from Peak2Gene?
A: Reasons can be investigated from the following aspects:
- Small sample or cell numbers, leading to insufficient statistical power
- Selected gene sets are too small or target regions are limited
- Set significance thresholds are too high, filtering out many associations
- RegionStats step was not executed correctly, missing bias correction information
- Motif Enrichment and Peak2Gene analysis used different cell subsets or filtering conditions