Single-cell scATAC-seq & scRNA-seq Dual-omics Advanced Analysis: ATAC_Monocle3 Pseudotime Analysis
Introduction
TIP
ATAC_Monocle3 uses the Monocle3 tool to infer differentiation trajectories based on scATAC-seq single-omics data. Pseudotime analysis is used to reconstruct the trajectory of cell development or differentiation, revealing dynamic changes in chromatin accessibility.
In single-cell multi-omics research, scATAC-seq data not only provides information on chromatin open states but can also reveal dynamic changes during cell development or differentiation through pseudotime analysis. Monocle3 calculates the distance of each cell to the starting point by selecting root cells, obtaining pseudotime to order the cell differentiation process. In scATAC-seq analysis, pseudotime can intuitively reflect changes in chromatin accessibility and the dynamic process of gene regulatory networks.
Core Functions of ATAC_Monocle3
Trajectory Reconstruction Through dimensionality reduction and graph learning, Monocle3 can identify continuous paths of cells in the epigenetic space, connecting discrete cell states into directed developmental trajectories.
Pseudotime Inference Based on specified root cells, Monocle3 calculates the shortest path distance of each cell along the trajectory to the origin, assigning each cell a pseudotime value that reflects its relative position in the differentiation process.
Dynamic Change Identification By comparing chromatin accessibility patterns at different pseudotime points, it is possible to identify regulatory elements that dynamically open or close during differentiation, revealing the temporal activation patterns of key transcription factor binding sites.
This document aims to provide a detailed technical guide for ATAC_Monocle3 for single-cell multi-omics researchers, covering its basic principles, operation methods on the SeekSoul™ Online Cloud Platform, result interpretation, and FAQs, helping you quickly master and apply this tool.
Theoretical Basis of ATAC_Monocle3
Core Principle
The core idea of ATAC_Monocle3 analysis is: Using the continuity of chromatin accessibility patterns in scATAC-seq data, identify continuous paths of cells in the epigenetic space through dimensionality reduction and graph learning, construct directed developmental trajectories, and calculate pseudotime values based on specified root cells.
Cell Differentiation and Epigenetic Dynamics
Cell differentiation is a continuous process involving progressive changes in epigenetic states. At single-cell resolution, we can observe:
- Cells at different differentiation stages exist simultaneously in the sample.
- Chromatin accessibility patterns change systematically with the differentiation process.
- The open/closed status of key regulatory elements (peaks) is closely related to cell fate decisions.
scRNA-seq vs. scATAC-seq: How to Choose Data Type for Pseudotime Analysis
Single-cell dual-omics obtains both scRNA-seq and scATAC-seq data simultaneously, and both can be used for pseudotime analysis, but they reflect different biological aspects:
- scRNA-seq: Mainly reflects dynamic changes at the gene expression level, more suitable for characterizing shifts in cell function and phenotype—focusing on the "result" perspective.
- scATAC-seq: Reveals the temporal dynamics of chromatin accessibility. Its changes often precede transcription, suggesting key regulatory events earlier than expression, suitable for mining regulatory mechanisms and fate decision-related nodes—focusing on the "cause" perspective.
TIP
Selection Suggestion:
- Focus on gene expression/cell function changes → Recommend scRNA-seq.
- Focus on epigenetic regulation or early developmental events → Recommend scATAC-seq.
- Simultaneous analysis and integration of pseudotime from both data types help to more comprehensively reveal cell developmental timing and regulatory mechanisms.
Key Algorithms and Workflow
Monocle3's pseudotime analysis for scATAC-seq data mainly relies on the extension of the Cicero package. Addressing the extreme sparsity of single-cell chromatin accessibility data, Monocle3 uses LSI (Latent Semantic Indexing) for preprocessing, which is a core step in scATAC-seq analysis.
The analysis workflow includes the following key steps:
- Data Conversion: Convert Seurat objects to Monocle3's CDS (Cell Data Set) objects.
- Cell Clustering: Perform cell clustering using UMAP dimensionality reduction results.
- Trajectory Learning: Identify continuous paths of cells in the epigenetic space through graph learning algorithms.
- Pseudotime Calculation: Calculate the shortest path distance of each cell along the trajectory to the origin based on specified root cells.
- Result Visualization: Generate pseudotime trajectory plots and dynamic change analysis results.
Key Parameters Description
- reduction_method: Specify the dimensionality reduction method. It is recommended to use the UMAP dimensionality reduction results corresponding to ATAC data, and ensure its name is "UMAP" (currently Monocle3's
cluster_cellsonly supports UMAP format). - use_partition: Whether to consider cell partitions. Enabling (TRUE) can be used to resolve cases with multiple independent developmental trajectories, helping to sort out complex differentiation paths; if focusing only on a single path, it can be set to FALSE.
- root_cells: Set the starting cells for trajectory analysis, requiring one or more root cell IDs. Usually, cell types at the developmental origin (such as stem cells, progenitor cells) are selected. Reasonable setting of root cells helps ensure the biological significance of the pseudotime direction.
Cloud Platform Operation Guide
On the cloud platform, the ATAC_Monocle3 analysis workflow is designed to be intuitive and easy to use. You do not need to write code; you can complete the analysis through the parameter configuration interface.
Preparation Before Analysis
TIP
The success of ATAC_Monocle3 analysis largely depends on the quality of input data and the choice of root cells. Before starting the analysis, please ensure:
- Data Preprocessing Completed: Your single-cell ATAC data has undergone standard QC, dimensionality reduction, clustering, and cell type annotation.
- UMAP Dimensionality Reduction Results: Ensure the data contains UMAP dimensionality reduction results, and the name is "UMAP".
- Clear Biological Origin: Although Monocle3 can automatically infer the trajectory origin, knowing this will help in subsequent result interpretation if your study has a clear biological origin (such as stem cells, progenitor cells, etc.).
- Select Appropriate Cell Subsets: Pseudotime analysis should be performed in cell subsets with potential differentiation or transition relationships.
Parameter Details
The table below details the main parameters and their descriptions for the ATAC_Monocle3 analysis module on the cloud platform.
| Parameter Name | Description |
|---|---|
| Task Name | Name of this analysis task, must start with an English letter, can contain English letters, numbers, underscores, and Chinese characters. |
| Group Factor | Column name for cell clustering. |
| Cell Type | Cell types to be analyzed. |
| Root | Select the cell type as root. |
| Filter Factor | Column name for sample information. |
| Filter Object | Sample names to be analyzed. |
| Allow Multiple Disjoint Trajectories | Used to determine whether to use partitions calculated during cluster_cells, thereby learning disjoint graphs in each partition. When use_partition=FALSE, a single graph is learned across all partitions. Default is TRUE. |
| Downsample | Whether to downsample. |
| Downsample Num | Number for downsampling. |
Important Notes
TIP
- Root Cells Selection: Selecting root cells is a critical step in pseudotime analysis. It is recommended to choose the starting cell type based on biological prior knowledge (such as hematopoietic stem cells, progenitor cells, etc.), or select the cell population located at the start of the trajectory branch in the UMAP plot.
- Multi-trajectory Processing: For data containing multiple independent trajectories (such as multi-lineage differentiation), the
use_partition = TRUEparameter can be used, and Monocle3 will automatically identify different cell partitions. - Data Quality Requirements: Ensure the quality of input data meets requirements; low-quality ATAC data will lead to inaccurate trajectory inference.
- UMAP Dimensionality Reduction Results: Ensure the data contains UMAP dimensionality reduction results, and the name is "UMAP", otherwise Monocle3's
cluster_cellsfunction will report an error.
Operation Workflow
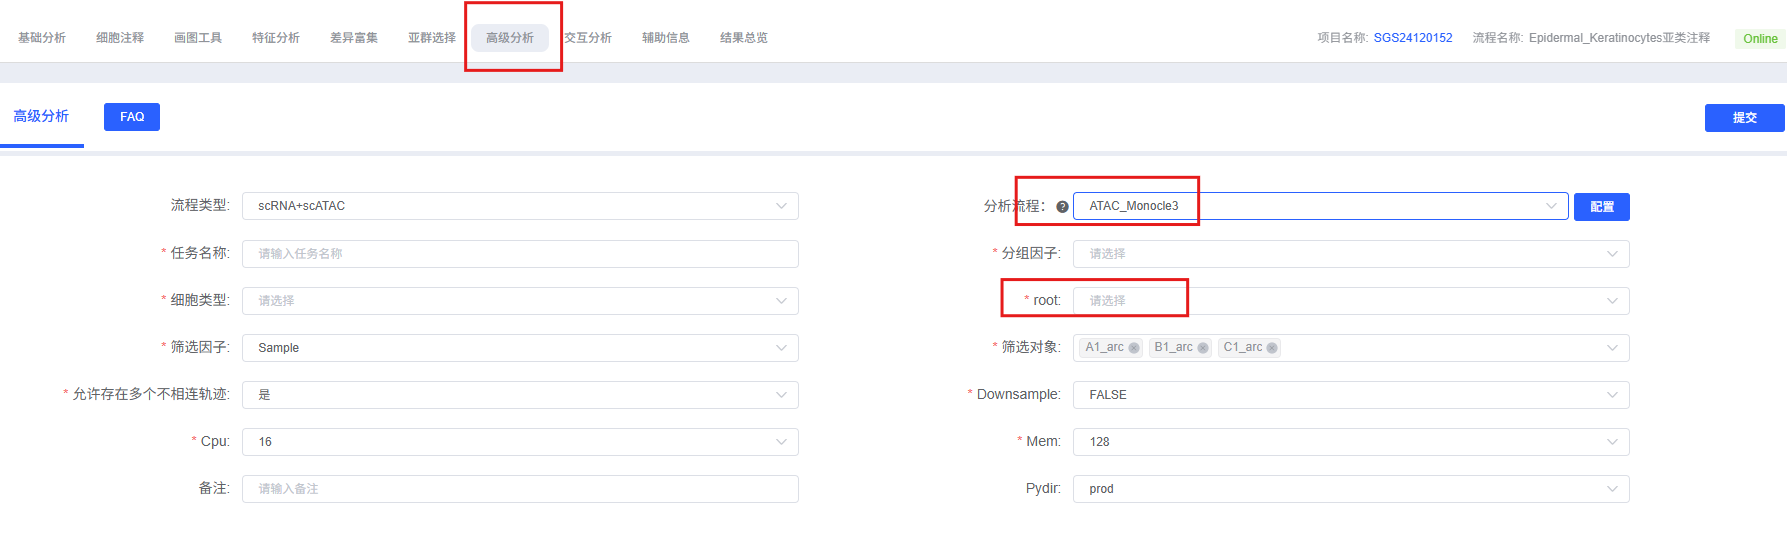
- Enter Analysis Module: Navigate to the "Advanced Analysis" module on the cloud platform and select "ATAC_Monocle3".
- Create New Task: Name your analysis task and select the sample or project to be analyzed.
- Configure Parameters: Select the cell types, grouping information, dimensionality reduction method, root cells, and other parameters according to the guide above.
- Submit Task: After confirming the parameters are correct, click the "Submit" button and wait for the analysis to complete.
- View Results: After the analysis is finished, view the generated analysis report and result files in the task list, including pseudotime trajectory plots, dynamic change analysis, etc.
Results Interpretation
The analysis report of ATAC_Monocle3 contains rich charts and data files. The following is a detailed interpretation of the core results.
Pseudotime Trajectory Plot
The pseudotime trajectory plot shows the distribution of cells in the UMAP reduced dimension space, colored according to pseudotime values:
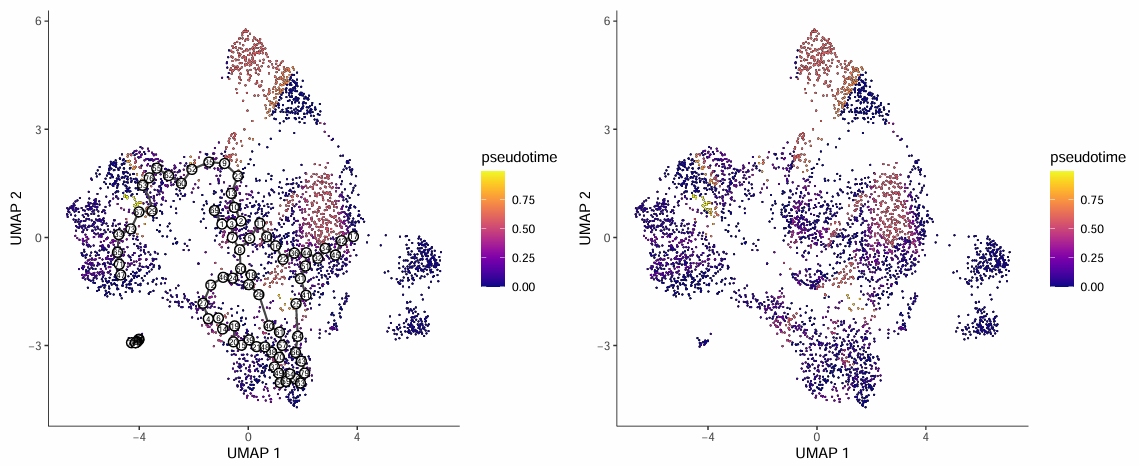
Chart Interpretation
- Each dot in the figure represents a cell, and the black line represents the trajectory branch path obtained by pseudotime inference.
- The darker the color of the cell dots, the closer they are to the developmental origin; the brighter the color, the more the cells are at the developmental terminus.
- The white-background circle numbers in the figure indicate the root (start) nodes of the trajectory.
- Outlier cells not in the same partition as the root cells are not calculated for pseudotime and are shown in gray.
Analysis Points
- Trajectory Direction: By observing the distribution of pseudotime values, the direction of cell differentiation can be determined, from the start (dark color) to the end (bright color).
- Branch Identification: Branch points in the trajectory map represent key nodes for cell fate decisions and are key areas of research.
- Outlier Cells: Outlier cells shown in gray may represent different developmental trajectories or technical noise, which need to be judged in combination with biological knowledge.
Cell Type Trajectory Plot
This plot shows the distribution pattern of pseudotime values in UMAP space:
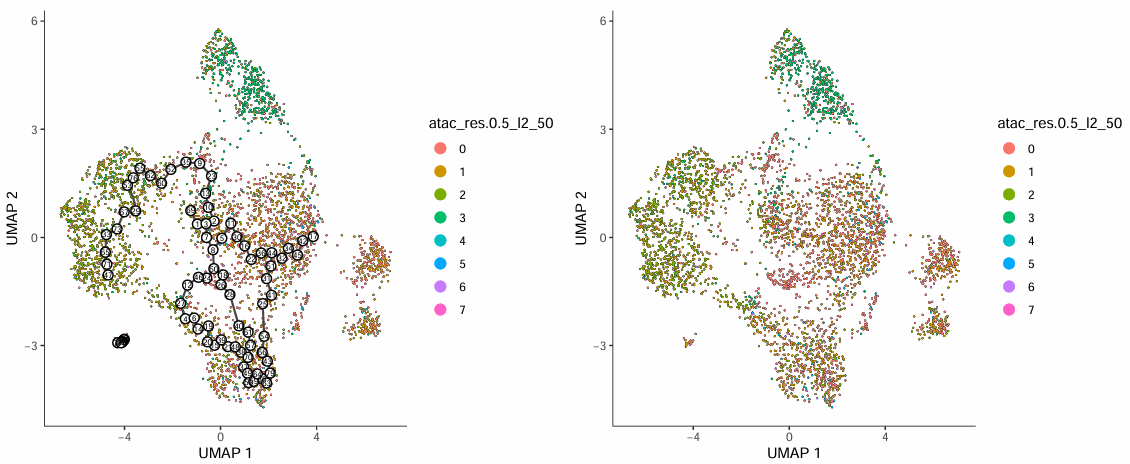
Chart Interpretation
- Each dot in the figure represents a cell, different colors identify different cell populations, and the black line represents the trajectory branch path obtained from the analysis.
- The numbers in the black-background circles indicate the branch nodes of the trajectory, representing the bifurcation positions of the differentiation direction (analogous to tree branches); the gray-background circles represent terminal differentiation states, corresponding to the final result of cell fate (similar to leaves).
- The numbers inside the circles are randomly assigned and do not represent the order of development; the differentiation direction can be determined in combination with pseudotime values.
Analysis Points
- Cell Type Distribution: By observing the distribution of different cell types on the trajectory, the biological significance of the trajectory can be verified.
- Branch Point Analysis: Branch nodes are key positions for cell fate decisions, and changes in chromatin accessibility in these areas should be focused on.
- Transition State Identification: Cells located at the junction of different cell types may be intermediate state cells in the process of state transition.
Trend of Accessibility Changes over Pseudotime
Top Five Sites with Most Significant Increase in Accessibility over Time
For interested peaks, the curve of accessibility changes along pseudotime can be plotted:
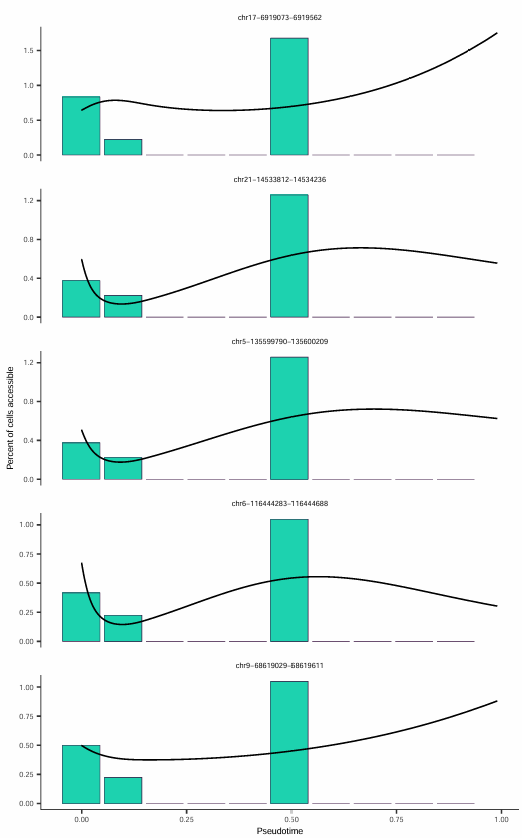
This figure shows the five chromatin regions with the most significant increase in accessibility on the pseudotime axis. Each subplot represents a chromatin accessibility site. The x-axis represents the pseudotime process, and the y-axis represents the accessibility level of the site. The black curve is a smoothed fit line, intuitively showing the overall trend of accessibility changes with pseudotime.
Top Five Sites with Most Significant Decrease in Accessibility over Time
Through differential accessibility analysis, peaks that change significantly during the pseudotime process can be identified:
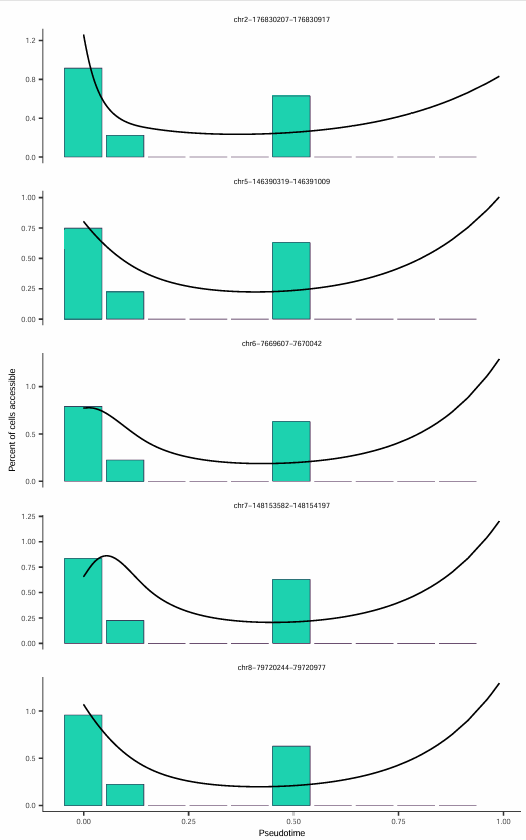
This figure shows the five chromatin regions with the most significant decrease in accessibility on the pseudotime axis. Each subplot represents a chromatin accessibility site. The x-axis represents the pseudotime process, and the y-axis represents the accessibility level of the site. The black curve is a fitted smooth line, showing the overall trend of changes with pseudotime.
Analysis Points
- Dynamic Regulatory Element Identification: These peaks that change significantly during the pseudotime process may be key regulatory elements worth further analysis.
- Temporal Activation Pattern: By observing the temporal pattern of accessibility changes, the activation order of key transcription factor binding sites can be revealed.
- Functional Annotation: Combined with gene annotation, target genes affected by these dynamic regulatory elements can be identified.
Result File List
| File Name | Content Description |
|---|---|
pseudotime.pdf/png | Pseudotime trajectory plot. |
celltype.pdf/png | Cell type trajectory plot. |
top_increasing.pdf/png | Top five sites with the most significant increase in accessibility over time. |
top_decreasing.pdf/png | Top five sites with the most significant decrease in accessibility over time. |
Notes
1. Importance of Root Cells Selection: Selecting root cells is a critical step in pseudotime analysis, directly affecting the direction and interpretation of pseudotime. It is recommended to choose the starting cell type based on biological prior knowledge, or select the cell population located at the start of the trajectory branch in the UMAP plot.
2. Multi-trajectory Processing: For data containing multiple independent trajectories (such as multi-lineage differentiation), the use_partition = TRUE parameter can be used, and Monocle3 will automatically identify different cell partitions. Data can also be divided into different subsets according to cell type annotation for separate pseudotime analysis.
3. Data Quality Requirements: Ensure the quality of input data meets requirements; low-quality ATAC data will lead to inaccurate trajectory inference. It is recommended to perform sufficient QC and normalization before analysis.
4. UMAP Dimensionality Reduction Results: Ensure the data contains UMAP dimensionality reduction results, and the name is "UMAP", otherwise Monocle3's cluster_cells function will report an error.
5. Caution in Result Interpretation: Pseudotime analysis results need to be interpreted in combination with biological knowledge. Pseudotime values reflect the relative position of cells in the differentiation process, not real physical time.
6. Integration with Other Analyses: Pseudotime analysis results can be combined with differential accessibility analysis, Motif analysis, multi-omics integration, and other analyses to more comprehensively reveal the regulatory mechanisms of cell development.
FAQ
Q1: How to choose suitable root cells?
A: Selecting root cells is a critical step in pseudotime analysis. Suggestions:
- Biological Prior Knowledge: Choose the starting cell type based on known biological knowledge (such as hematopoietic stem cells, progenitor cells, etc.).
- Trajectory Origin Identification: In the UMAP plot, select the cell population located at the start of the trajectory branch.
- Interactive Selection: If the
root_cellsparameter is not specified, Monocle3 will launch an interactive interface allowing users to manually select starting cells. - Multi-trajectory Analysis: For data containing multiple independent trajectories, root cells need to be specified for each trajectory separately.
Q2: How to handle multiple independent developmental trajectories?
A: For data containing multiple independent trajectories (such as multi-lineage differentiation), the following strategies can be adopted:
- Partition Analysis: Use the
use_partition = TRUEparameter, Monocle3 will automatically identify different cell partitions. - Separate Analysis: Divide the data into different subsets according to cell type annotation and perform pseudotime analysis separately.
- Integrate Results: After analysis, pseudotime values of different trajectories can be added to the Seurat object separately for comparison.
Q3: How to integrate pseudotime analysis results with other analyses?
A: Pseudotime analysis results can be integrated with various analyses:
- Differential Accessibility Analysis: Identify peaks changing along pseudotime, revealing dynamic regulatory elements.
- Motif Analysis: Perform motif enrichment on differential peaks to identify key transcription factors.
- Multi-omics Integration: Integrate with scRNA-seq data to reveal the temporal association between chromatin accessibility and gene expression.
- Functional Annotation: Combine with gene annotation to identify target genes affected by dynamic regulatory elements.
Q4: What is the relationship between pseudotime values and real time?
A: Pseudotime values reflect the relative position of cells in the differentiation process, not real physical time:
- Relative Position: The larger the pseudotime value, the closer the cell is to the end of differentiation.
- Relative Order: Pseudotime values can be used to order the cell differentiation process but cannot be directly converted into real time units.
- Biological Significance: Pseudotime values help identify key nodes and dynamic changes in cell differentiation.
Q5: How to judge the quality of trajectory analysis?
A: Key indicators for judging the quality of trajectory analysis:
- Trajectory Continuity: The trajectory should form a continuous path rather than scattered points.
- Biological Plausibility: The direction and branches of the trajectory should conform to known biological knowledge.
- Cell Type Distribution: The distribution of different cell types on the trajectory should conform to the expected differentiation order.
- Pseudotime Distribution: Pseudotime values should form a reasonable gradient distribution on the trajectory.
Q6: What is the difference between pseudotime analysis of scRNA-seq and scATAC-seq?
A: There are differences between the two at the biological level:
- scRNA-seq: Mainly reflects dynamic changes at the gene expression level, more suitable for characterizing shifts in cell function and phenotype—focusing on the "result" perspective.
- scATAC-seq: Reveals the temporal dynamics of chromatin accessibility. Its changes often precede transcription, suggesting key regulatory events earlier than expression, suitable for mining regulatory mechanisms and fate decision-related nodes—focusing on the "cause" perspective.
- Suggestion: Simultaneous analysis and integration of pseudotime from both data types help to more comprehensively reveal cell developmental timing and regulatory mechanisms.
References
[1] CAO J, SPIELMANN M, QIU X, et al. The single-cell transcriptional landscape of mammalian organogenesis[J]. Nature, 2019, 566(7745): 496-502.
[2] PLINER H A, PACKER J S, MCFALINE-FIGUEROA J L, et al. Cicero predicts cis-regulatory DNA interactions from single-cell chromatin accessibility data[J]. Molecular Cell, 2018, 71(5): 858-871.
[3] TRAPNELL C, CACCHIARELLI D, GRIMSBY J, et al. The dynamics and regulators of cell fate decisions are revealed by pseudo-temporal ordering of single cells[J]. Nature Biotechnology, 2014, 32(4): 381-386.