COMMOT Analysis
Introduction
IMPORTANT
COMMOT (COMMunication analysis by Optimal Transport) is a spatial cell communication inference tool based on optimal transport theory, specifically designed for analyzing cell-cell communication in spatial transcriptomics data. By employing Collective Optimal Transport algorithms, COMMOT accurately infers communication patterns between spatially adjacent cells while considering ligand-receptor competition relationships and spatial distance constraints.
In spatial transcriptomics research, cell communication depends not only on the expression of ligands and receptors but also on spatial positional relationships and molecular diffusion processes, which significantly impact intercellular interactions. COMMOT integrates gene expression data, ligand-receptor databases, and spatial coordinate information, using optimal transport theory to model the "transport" process of ligand molecules from sender cells to receiver cells, thereby identifying biologically meaningful spatial cell communication networks.
Core Functions of COMMOT
- Collective Optimal Transport Algorithm: Simultaneously considers competition relationships among multiple ligand-receptor pairs
- Spatial Distance Constraints: Models molecular diffusion based on actual spatial distances between cells
- Signal Direction Inference: Identifies signal propagation direction from sender to receiver cells
- Downstream Gene Prediction: Infers target genes regulated by specific signaling pathways
- Rich Visualization: Provides multiple visualization methods including spatial graphs, flow diagrams, and chord diagrams
- Multi-Database Support: Supports mainstream ligand-receptor databases such as CellChat and CellPhoneDB
This document aims to provide spatial transcriptomics researchers with a comprehensive technical guide for COMMOT, covering its basic principles, operation methods on the SeekSoul™ Online platform, result interpretation, practical cases, and frequently asked questions, helping you quickly master and apply this tool.
COMMOT Theoretical Foundation
The core idea of COMMOT is: modeling intercellular communication as an optimal transport problem, where ligand molecules are transported from sender cells to receiver cells, with transport cost depending on spatial distance, and transport volume depending on the expression levels of ligands and receptors as well as their competition relationships. This process can be summarized in the following main steps:
- Data Preprocessing: Extract expression matrix and spatial coordinate information
- Ligand-Receptor Pair Filtering: Filter ligand-receptor pairs expressed in the data from the database
- Spatial Distance Matrix Calculation: Calculate Euclidean distances between all cell pairs
- Collective Optimal Transport: Solve the ligand-receptor communication network using the collective optimal transport algorithm
- Signal Direction Inference: Identify signal propagation direction based on transport flow
- Downstream Analysis: Use machine learning models to predict signal-regulated target genes

SeekSoul™ Online Operation Guide
On SeekSoul™ Online, the COMMOT analysis workflow is designed to be intuitive and user-friendly. You don't need to write code; you can complete the analysis simply through the parameter configuration interface.
Parameter Settings Instructions
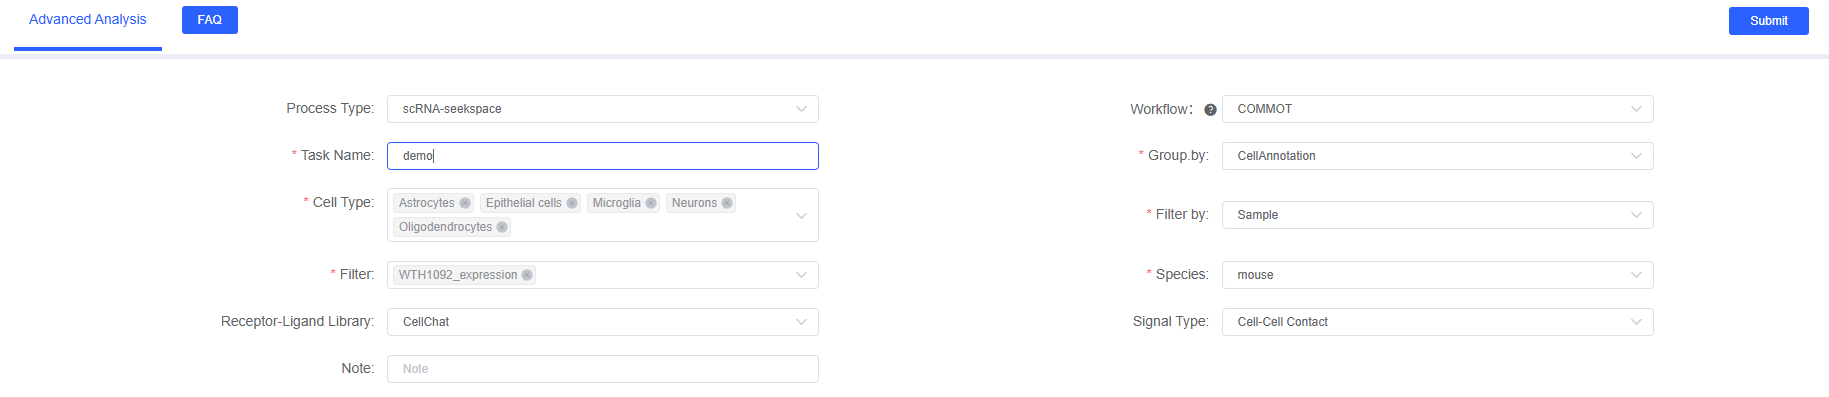
In the "Advanced Analysis" module of SeekSoul™ Online, select "COMMOT" and configure the following parameters:
Basic Parameters
Task Name
- Description: The name of this analysis task
- Format Requirements: Must start with an English letter, can include English letters, numbers, underscores, and Chinese characters
- Example:
COMMOT_tumor_analysis
Group.by
- Description: Column name of cell types in meta data
- Examples:
CellAnnotation,celltype - Purpose: Used to define cell types and analyze communication between different cell types
Cell Types
- Description: Select cell types to analyze based on the group factor column
- Format: Multiple selections allowed, separated by commas
- Examples:
pPCM,dPCMorT_cells,B_cells,Macrophage
Sample Filtering Parameters
Filter by
- Description: Column name of samples in meta data
- Examples:
Sample,GD.N_A
Filter
- Description: Select sample names to analyze based on the filter factor column
- Examples:
A15,sample1 - Note: COMMOT analyzes one sample at a time; to compare multiple samples, submit tasks separately
Ligand-Receptor Database Parameters
Species
- Options:
humanormouse - Description: Select the species corresponding to the sample
Receptor-Ligand Library
- Options:
CellChat: Ligand-receptor pairs from the CellChat database (~2000 pairs)CellPhoneDB_v4.0: Ligand-receptor pairs from the CellPhoneDB v4.0 database (~3000 pairs)
Signal Type
- Options:
Secreted Signaling: Secreted signals (diffusible secreted proteins)Cell-Cell Contact: Cell-cell contact signals (direct contact required)ECM-Receptor: Extracellular matrix-receptor signals (CellChat only)None: Use all types of ligand-receptor pairs
Note
- Description: Custom remark information (optional)
Report Result Interpretation
After COMMOT analysis is complete, an HTML report containing multiple visualization results and data files will be generated. The following details the meaning and interpretation key points of each result section.
Ligand-Receptor Communication Network
Overall Communication Intensity Matrix
Image Example: total-total_cluster.png
This is a heatmap showing the overall communication intensity between different cell type pairs.
Interpretation Key Points:
- Rows: Signal sender cell types
- Columns: Signal receiver cell types
- Color Depth: Communication intensity (darker colors indicate stronger intensity)
- Diagonal: Autocrine signals between cells of the same type
- Non-diagonal: Paracrine signals between cells of different types
Signal Sender-Receiver Signature Maps
Spatial Distribution of Sender and Receiver Cells
Image Example: sender_receiver_signature.png
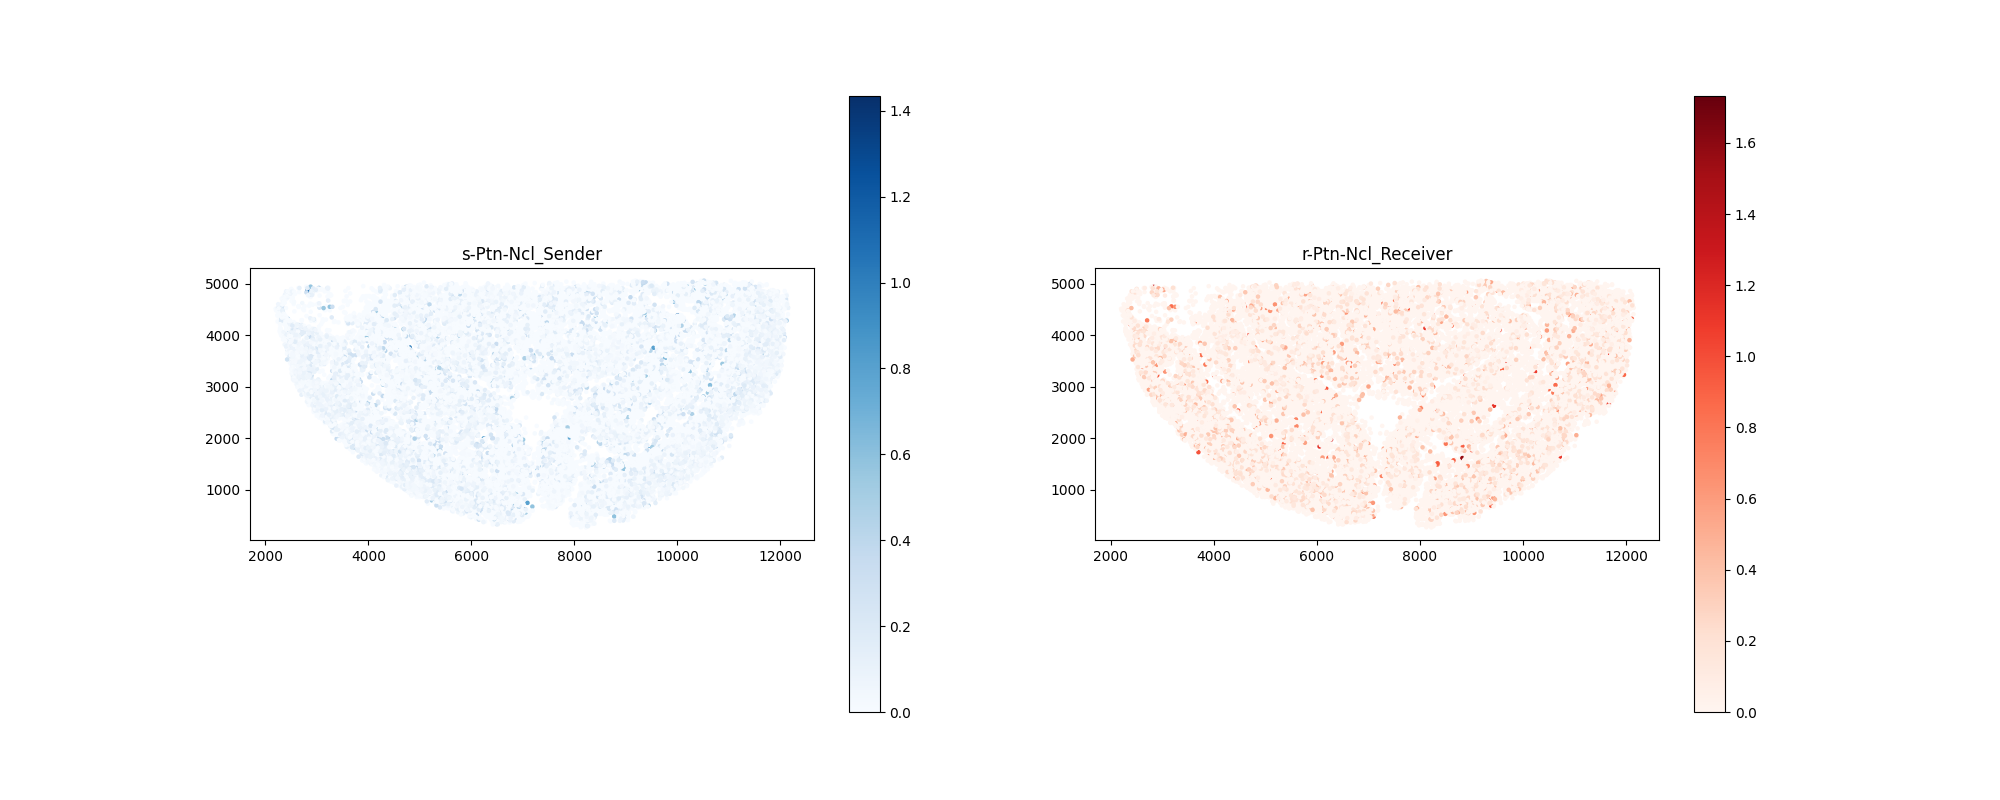
Interpretation Key Points:
- Left Panel: Spatial distribution and signal sending intensity of sender cells (blue indicates high intensity)
- Right Panel: Spatial distribution and signal receiving intensity of receiver cells (red indicates high intensity)
Biological Significance:
- Visualize where signals originate and where they are received
- Identify signal gradients and spatial patterns
- Discover spatial patterns of signal propagation
Signal Flow Diagrams
Overall Signal Flow
Image Example: total_signature_stream.png
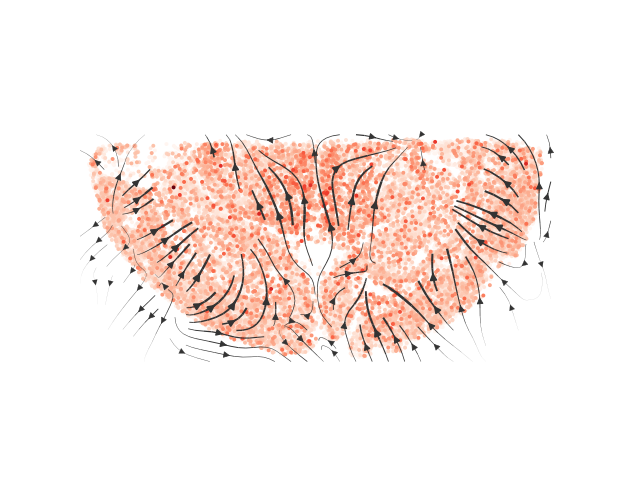
Interpretation Key Points:
- Points: Spatial positions of cells
- Arrows: Signal propagation direction
- Arrow Length/Thickness: Signal intensity
Key Observation Points:
- Signal Sources: Areas with dense arrow origins
- Signal Sinks: Areas with dense arrow targets
- Signal Pathways: Continuous arrow routes
Cell Type Communication Networks
Chord Diagram
Image Example: total_chord_plot.png
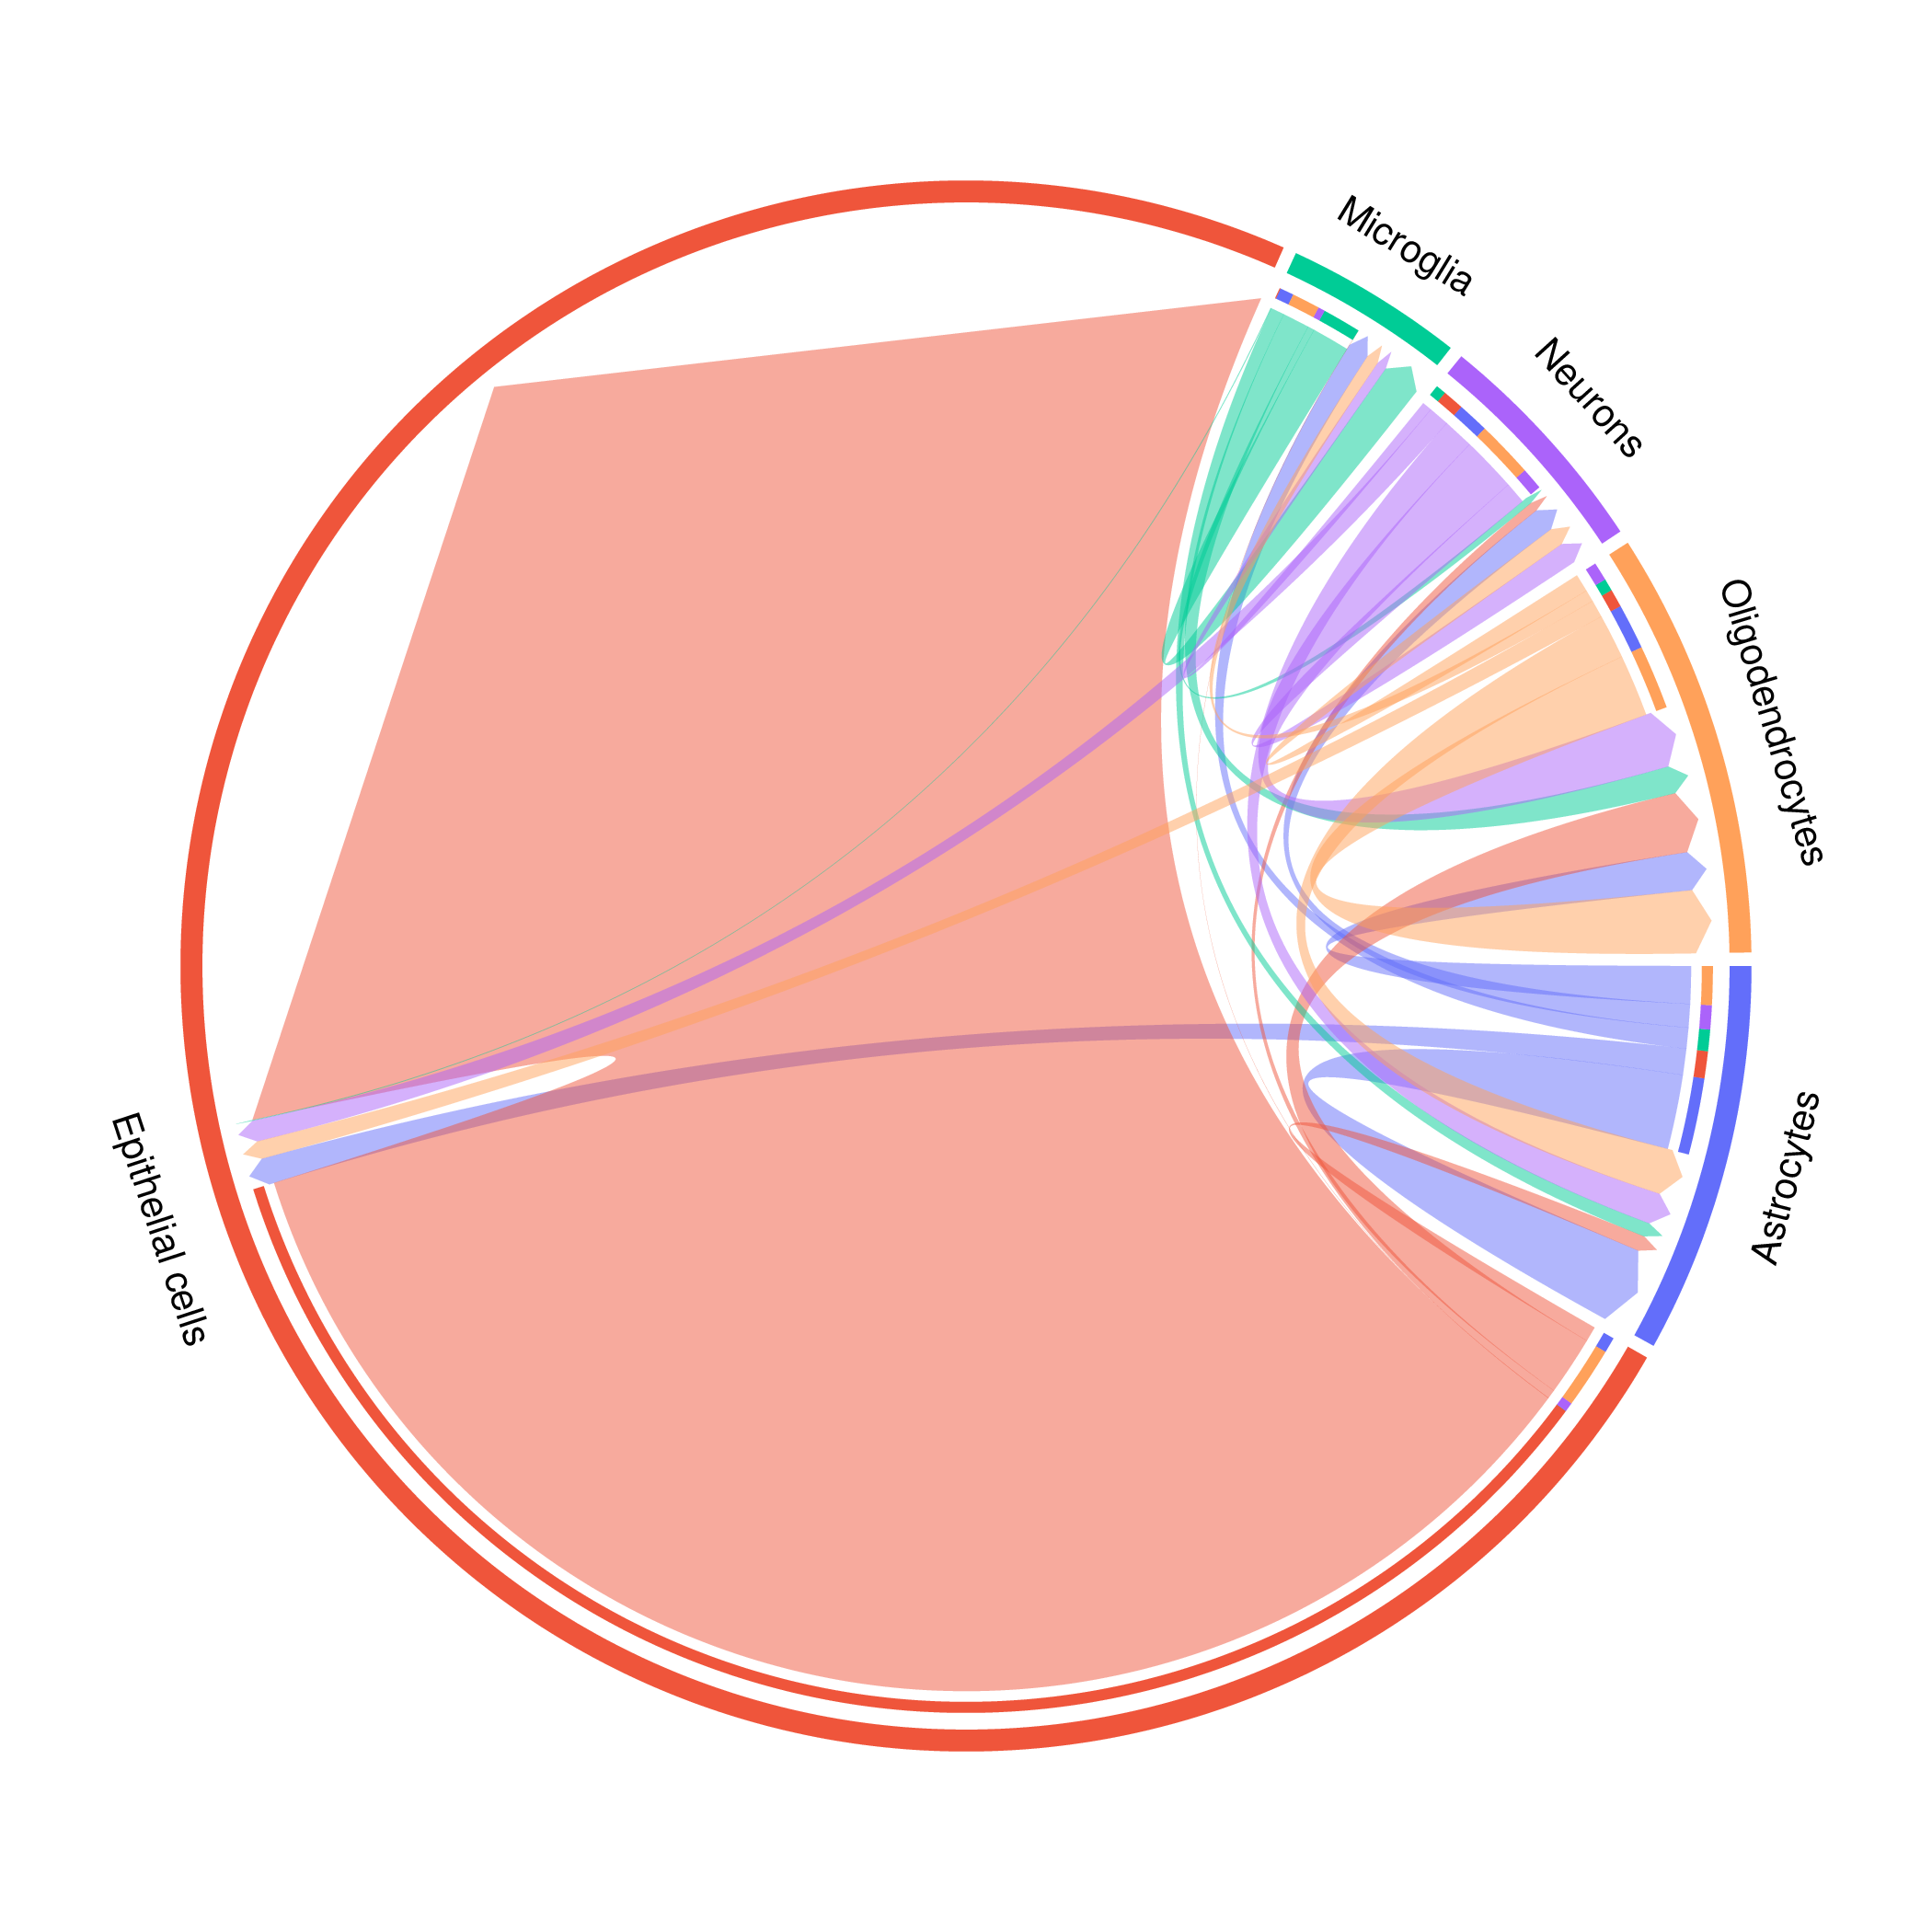
Interpretation Key Points:
- Circle Sectors: Different cell types
- Sector Size: Total communication intensity of the cell type
- Connecting Lines: Communication between cell type pairs
- Line Width: Communication intensity
Analysis Strategy:
- Identify Hub Cells: Cell types with large sectors and many connections
- Focus on Strong Communication: Cell type pairs represented by wide connecting lines
- Discover Communication Patterns: Such as unidirectional communication, bidirectional communication, many-to-one, etc.
Quantitative Data Files
The h5ad file output by COMMOT includes:
commot-sum: Total communication intensity matrixcommot-sum-sender: Intensity of each cell as a sendercommot-sum-receiver: Intensity of each cell as a receiver- Communication matrices for specific ligand-receptor pairs
Best Practices for Result Interpretation
TIP
Result Interpretation Recommendations:
- From Overall to Local: First examine overall communication patterns, then look at specific ligand-receptor pairs
- Combine with Biological Knowledge: Connect discovered communication patterns with known biological functions
- Spatial Validation: Pay attention to whether spatially adjacent cells indeed show strong communication
- Multi-angle Analysis: Comprehensively judge by combining different visualization methods
Application Cases
Cell Communication Analysis in Neonatal Human Epidermal Development
- Literature: Cang Z., Zhao Y., Almet A.A., et al. Screening cell–cell communication in spatial transcriptomics via collective optimal transport. Nature Methods 20, 218–228 (2023). DOI: 10.1038/s41592-022-01728-4
- Research Background: The maintenance of human epidermal homeostasis requires a precise balance between the proliferation of basal stem cells and their differentiation toward the upper layers, which is regulated by intercellular communication. This study used COMMOT to analyze spatial transcriptomics data of neonatal human epidermis to decipher the cell communication network during epidermal homeostasis maintenance.
- Data Type: scRNA-seq + spatial transcriptomics data (scRNA-seq data integrated with digitally spatial information from immunofluorescence staining images using the SpaOTsc algorithm)
- Sample: Neonatal human epidermis
- Reference: PMC9911355
COMMOT Analysis Results
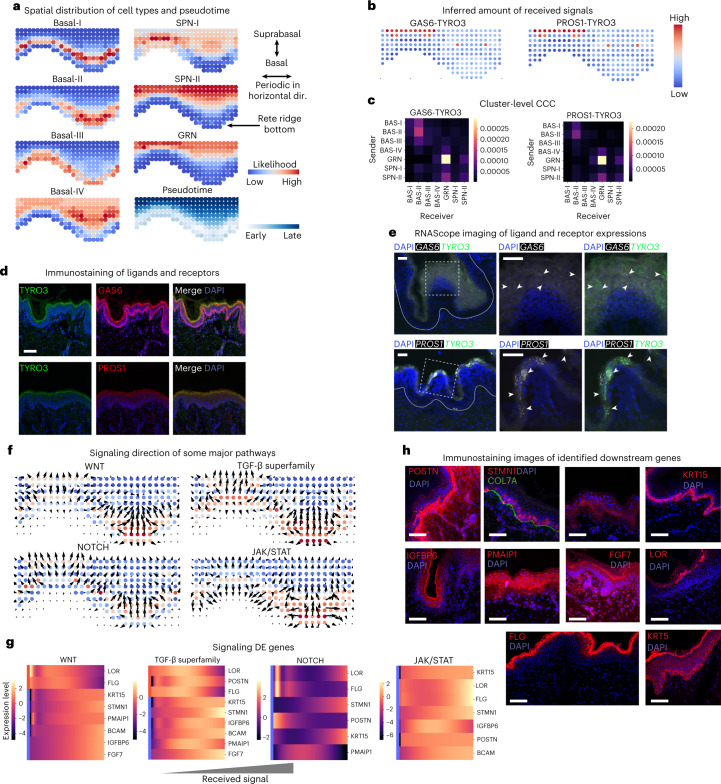
Figure 2: COMMOT analysis of cell communication in human epidermal development. a. Spatially predicted distribution of cell types and pseudotime projection in space, showing the developmental path from the basal layer to the upper epidermis (GRN: granular layer cells; SPN: spinous layer cells). b. Inferred received signal amounts for two ligand-receptor pairs (GAS6-TYRO3 and PROS1-TYRO3) at the cellular level. c. Inferred signal amounts at the cell cluster level. d. Immunofluorescence staining validation of GAS6, TYRO3, and PROS1 proteins. e. Fluorescence in situ hybridization (FISH) validation of RNA expression patterns for GAS6-TYRO3 (upper row) and PROS1-TYRO3 (lower row), with white arrows indicating colocalization signals in the granular layer. f. Signal propagation directions of four major signaling pathways (WNT, TGF-β, NOTCH, JAK/STAT). g. Heatmap of differentially expressed genes related to the four signaling pathways. h. Immunofluorescence staining validation of the correlation between WNT signaling and predicted gene expression. Scale bars: 100 μm for d, e, h.
Core Findings
Validation of GAS6/PROS1-TYRO3 Ligand-Receptor Pair: COMMOT predicted and validated through immunofluorescence and RNA in situ hybridization that GAS6/PROS1-TYRO3 interactions are strongest in granular layer cells, participating in the regulation of cell survival and terminal differentiation.
Spatial Propagation Directions of Four Major Signaling Pathways: COMMOT revealed that all four pathways (WNT, TGF-β, NOTCH, JAK/STAT) primarily propagate upward, i.e., transmitting signals from upper differentiated cells to basal stem cells, forming a feedback regulatory mechanism to maintain epidermal homeostasis.
Downstream Genes of Signaling Pathways: Based on signal intensities inferred by COMMOT, differentially expressed genes associated with each pathway were identified. WNT signaling promotes upregulation of basal markers (KRT15, KRT5) and inhibits differentiation markers (LOR, FLG), validating the function of WNT in promoting stem cell proliferation and inhibiting terminal differentiation.
Validation of WNT Signaling Downstream Genes: Immunofluorescence verified that WNT-responsive genes (BCAM, POSTN, STMN1) predicted by COMMOT are highly expressed in the basal layer, further confirming COMMOT's ability to predict downstream effects of signaling pathways.
Notes and Best Practices
WARNING
Avoid Overinterpretation: COMMOT results are computational inferences based on ligand-receptor expression and spatial distance, not equivalent to actual intercellular interactions. Any key findings require subsequent experimental validation.
CAUTION
Data Quality is Crucial:
- Ensure spatial coordinate information is accurate
- Cell type annotations must be reliable
- Gene expression data must undergo appropriate quality control and normalization
Preparation Before Analysis
Data Quality Control:
- Remove low-quality spots/cells
- Perform appropriate normalization (log-normalization recommended)
- Ensure spatial coordinates correspond to the expression matrix
Cell Type Annotation:
- Use reliable methods for cell type annotation
- Avoid excessive subdivision leading to too few cells of certain types
- It is recommended to have at least 20-30 cells/spots for each cell type
Parameter Selection:
- Choose an appropriate ligand-receptor database based on the research question
- Select an appropriate signal type based on spatial resolution
- For Visium data, Secreted Signaling is recommended
Result Validation Recommendations
Literature Validation: Review existing literature to confirm whether discovered communications have biological basis
Experimental Validation:
- Immunofluorescence: Validate spatial expression of key ligands and receptors
- Functional experiments: Use inhibitors or knockout to validate signal function
Cross-Sample Validation: Repeat analysis in multiple samples to confirm the stability of findings
Frequently Asked Questions
Question 1: COMMOT analysis fails with error "No valid ligand-receptor pairs found"
- Reason: Too few ligand-receptor pairs expressed in the data
- Solution:
- Check if the species selection is correct
- Try changing the ligand-receptor database
- Check if gene expression data normalization is appropriate
Question 2: Communication intensity between all cell types is weak
- Reason: May be data quality issues or cells being far apart
- Solution:
- Check data quality control steps
- Try using "None" signal type to include all ligand-receptor pairs
- Verify spatial coordinates are correct
Question 3: Chord diagram shows certain cell types with no communication
- Reason: The cell type may not express any ligands or receptors, or it may be too far from other cells
- Solution:
- Check ligand-receptor expression in this cell type
- Consider whether the biological characteristics of this cell type indeed do not participate in communication
Question 4: How to select cell types for analysis
- Suggestion:
- If there are fewer cell types (<10), it is recommended to analyze all types
- If there are many cell types, select types of interest based on research objectives
- Avoid selecting rare cell types with too few cells
References
- GitHub: https://github.com/zcang/COMMOT
- Literature: Cang et al., Nature Methods 2023
Summary
COMMOT is a powerful spatial cell communication analysis tool that accurately infers intercellular communication networks through collective optimal transport algorithms, considering spatial distance and ligand-receptor competition. SeekSoul™ Online has integrated the COMMOT analysis workflow, enabling researchers to complete analysis without complex programming.