Single-cell scATAC-seq & scRNA-seq Dual-omics Standard Analysis: Peak2Gene Analysis
Introduction
TIP
Peak2Gene (Peak-Gene linking) analysis is a method designed specifically for single-cell multi-omics (ATAC+RNA) data. Its core goal is to identify significant regulatory relationships between gene expression and nearby chromatin accessibility peaks.
In single-cell multi-omics research, scATAC-seq and scRNA-seq data provide information at different levels. Peak2Gene analysis infers which peak may be involved in regulating which genes by statistically analyzing the correlation between gene expression levels and ATAC signal intensity of nearby peaks in each cell, and using generalized linear models to correct for technical biases such as GC content, peak length, and distance. Peak2Gene analysis not only helps reveal cis-regulatory networks (such as enhancer-gene connections) but also integrates with motif enrichment/activity results to systematically mine direct target genes and regulatory roles of key transcription factors, serving as one of the fundamental tools for multi-omics regulatory mechanism research.
Core Functions of Peak2Gene
Peak-Gene Association Identification By calculating the correlation between gene expression levels and accessibility signals of adjacent peaks, identify the set of peaks that may regulate the gene, overcoming the limitations of annotation based solely on linear distance.
Technical Bias Correction Use generalized linear models to correct for multiple technical biases such as GC content, overall accessibility, and peak length to obtain more reliable peak-gene associations.
Cis-Regulatory Network Construction Help reveal cis-regulatory networks (such as enhancer-gene connections), providing a foundation for multi-omics regulatory mechanism research.
Integration with Motif Analysis Combine motif enrichment/activity results to systematically mine direct target genes and regulatory roles of key transcription factors, constructing a complete TF → peak → gene regulatory axis.
This document aims to provide a detailed technical guide for Peak2Gene for single-cell multi-omics researchers, covering its basic principles, operation methods on the SeekSoul™ Online Cloud Platform, result interpretation, and FAQs, helping you quickly master and apply this tool.
Theoretical Basis of Peak2Gene
Core Principle
The core idea of Peak2Gene analysis is: By statistically analyzing the correlation between gene expression levels and ATAC signal intensity of nearby peaks in each cell, and using generalized linear models to correct for multiple technical biases, infer which peak may be involved in regulating which genes.
Introduction to Gene Regulatory Networks
Gene Regulatory Network (GRN) consists of Transcription Factors (TF), regulatory elements (such as promoters, enhancers, peaks), and target genes. TFs bind to open chromatin regions by recognizing specific DNA motifs, thereby influencing the transcription of downstream genes. The advantage of single-cell multi-omics methods is that they can simultaneously observe TF and target gene expression (scRNA-seq) and chromatin accessibility of TF binding sites (scATAC-seq, combined with motif identification for inference) at single-cell resolution.
By combining single-cell ATAC and RNA data, it is possible to achieve:
- Determination of TF expression profiles.
- Assessment of openness of TF binding sites (peaks).
- Inference of motif enrichment and functional activity.
- Monitoring of dynamic changes in target gene expression.
This "TF expression × motif-peak binding × target gene expression" three-dimensional integration helps reconstruct the regulatory causal chain at the single-cell scale, accurately capture key regulations and targets, and provide a foothold for GRN mapping and deep mechanism research.
How Peak2Gene Analysis Helps Parse GRN Gene Regulatory Networks
Motif Analysis: By aligning with known transcription factor recognition sequences, identify regions that may be bound by TFs from open chromatin peaks, which is an important basis for accurately describing TF → peak regulatory relationships. These motif-enriched peaks are regarded as potential targets for TF regulation, serving as the "upstream" foundation of the regulatory network.
Peak2Gene Analysis: By examining the correlation between peak accessibility signals and nearby gene expression at the single-cell level, accurately capture regulatory pairings between each peak and its potential target genes, overcoming the limitations of annotation based solely on linear distance. This strategy effectively characterizes real evidence of open peaks actually participating in gene regulation, elucidating the "downstream" link of the regulatory network.
Integrated Analysis: Combining motif analysis (TF → peak) and Peak2Gene analysis (peak → gene) can systematically depict the direct regulatory axis among TFs, regulatory element peaks, and their target genes, providing multiple evidence support for multi-omics regulatory mechanism research.
TIP
Standard Analysis Workflow
- Differential Peak Screening: Locate open regions with biological significance.
- Peak2Gene Annotation: Integrate expression and distance to establish peak–gene associations.
- Motif Analysis: Identify and assess motif enrichment and activity, predict key TFs.
- Multi-omics Joint Verification: Analyze regulatory consistency among motif activity, TF/target gene expression, and peak accessibility.
Key Algorithms and Workflow
For each target gene, Peak2Gene analysis includes the following key steps:
- Screen Neighboring Peaks: Screen peaks within the range (e.g., ±500 kb) of the gene.
- Calculate Correlation: Calculate the correlation between the accessibility of these peaks and gene expression.
- Bias Correction: Use generalized linear models to correct for biases such as GC%, peak size, and overall accessibility to obtain more reliable peak-gene associations.
This method can accurately quantify the regulatory support evidence of each peak for target genes, which is a key link in reconstructing multi-omics regulatory networks. In actual project implementation, it is recommended to evaluate interested gene sets first, and it can also be extended to whole-genome automatic annotation.
Cloud Platform Operation Guide
On the cloud platform, the Peak2Gene analysis workflow is designed to be intuitive and easy to use. You do not need to write code; you can complete the analysis through the parameter configuration interface.
Preparation Before Analysis
TIP
The success of Peak2Gene analysis largely depends on the quality of input data and the matching of multi-omics data. Before starting the analysis, please ensure:
- Data Preprocessing Completed: Your single-cell ATAC and RNA data have undergone standard QC, dimensionality reduction, clustering, and cell type annotation.
- Data Matching: Ensure ATAC and RNA data come from the same cells or matched cell populations for correlation analysis.
- Complete Annotation Information: Ensure data contains necessary annotation information such as cell types and sample groups for result display and interpretation.
- RegionStats Step: Ensure the RegionStats step has been executed to annotate GC content and other features of each peak region for subsequent bias correction.
Parameter Details
The table below details the main parameters and their descriptions for the Peak2Gene analysis module on the cloud platform.
| Parameter Name | Description |
|---|---|
| Task Name | Name of this analysis task, must start with an English letter, can contain English letters, numbers, underscores, and Chinese characters. |
| Group Factor | Column name for cell clustering. |
| Cell Type | Cell types to be analyzed. |
| Filter Factor | Sample name or group name to be analyzed. |
| Filter Object | Sample name or group name to be analyzed. |
| k-means Cluster Count | Number of clusters for K-means clustering, used for link grouping, default is 10. |
| Max Link Count | Maximum number of links to draw, default is 5000. |
| Filter Link | Option TRUE or FALSE, if TRUE, the following four parameters are displayed. |
| Correlation Threshold | Correlation threshold for filtering links, default is 0.1. |
| P-value Threshold | P-value threshold for statistical significance filtering, default is 0.01. |
| ATAC Variance Threshold | Variance threshold for ATAC data, used to filter low-variability peaks, default is 0.25. |
| RNA Variance Threshold | Variance threshold for RNA data, used to filter low-variability genes, default is 0.25. |
Important Notes
TIP
- Data Quality Requirements: Ensure the quality of ATAC and RNA data meets requirements; low-quality data will lead to inaccurate peak-gene associations.
- Data Matching: When performing correlation analysis, ensure ATAC and RNA data come from the same cells or matched cell populations.
- Distance Threshold Selection: Default 500 kb distance threshold is suitable for most cases, can be adjusted according to research needs.
- Significance Threshold: Recommended to use the default p-value threshold (0.05); overly strict thresholds may filter out too many associations.
- Integration with Motif Analysis: Peak2Gene analysis results can be integrated with Motif analysis results to construct a complete TF → peak → gene regulatory axis.
Operation Workflow
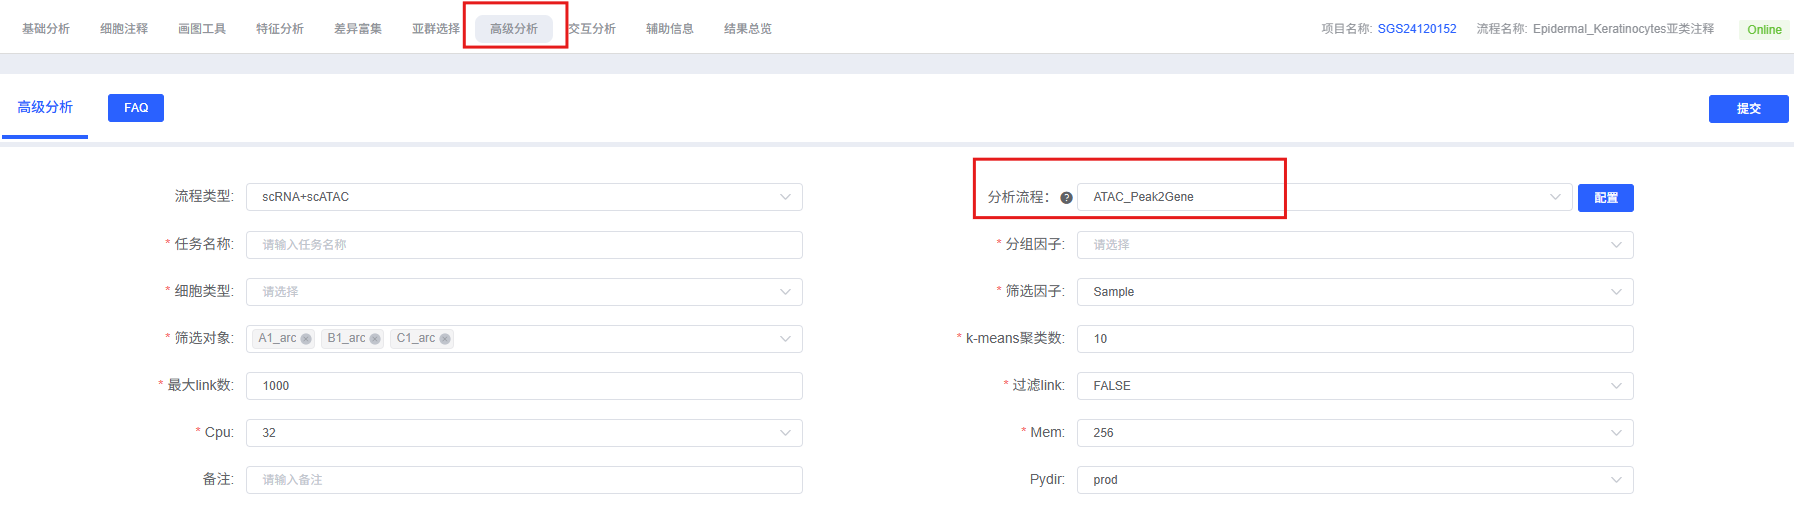
- Enter Analysis Module: Navigate to the "Advanced Analysis" module on the cloud platform and select "Peak2Gene".
- Create New Task: Name your analysis task and select the sample or project to be analyzed.
- Configure Parameters: Select the cell types, grouping information, target genes, and other parameters according to the guide above.
- Submit Task: After confirming the parameters are correct, click the "Submit" button and wait for the analysis to complete.
- View Results: After the analysis is finished, view the generated analysis report and result files in the task list, including peak-gene association heatmaps, correlation analysis results, etc.
Results Interpretation
The analysis report of Peak2Gene contains rich charts and data files. The following is a detailed interpretation of the core results.
Peak-Gene Correlation Heatmap
The heatmap displays the correlation patterns between chromatin open regions (peaks) and gene expression:
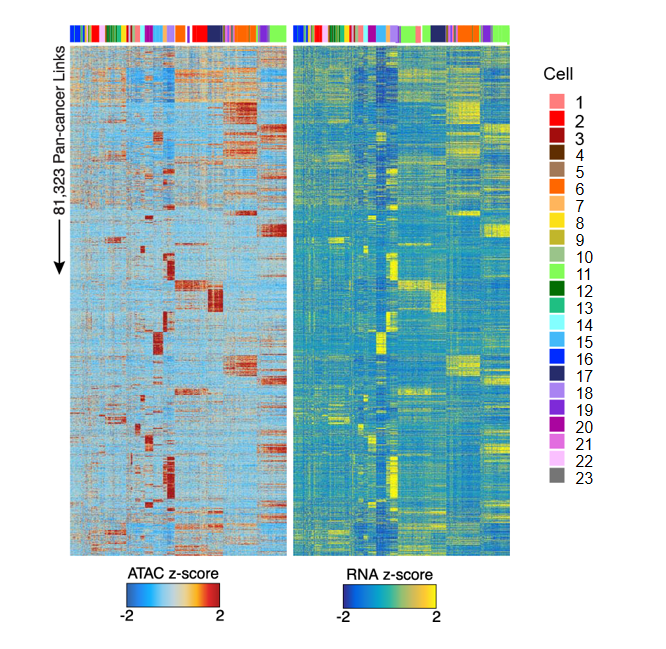
Chart Interpretation
The heatmap is divided into two parts:
- ATAC Heatmap (Left): Shows ATAC-seq signal intensity (chromatin accessibility), blue indicates low accessibility, red indicates high accessibility.
- RNA Heatmap (Right): Shows expression levels of corresponding genes, blue indicates low expression, yellow indicates high expression.
- Each row represents a peak-gene pair, and each column represents a single cell.
- The top color bar identifies different cell types or groups, facilitating observation of peak-gene association patterns in specific cell populations.
Analysis Points
- Association Pattern Identification: By observing the consistency of ATAC and RNA signals in the heatmap, peak-gene association patterns can be identified.
- Cell Type Specificity: Different cell types may show different peak-gene association patterns, reflecting cell type-specific regulatory mechanisms.
- Regulatory Direction Judgment: By comparing the correlation between peak accessibility and gene expression, the direction and strength of regulation can be judged.
Associated Peak Count Distribution Histogram
This histogram shows the distribution of the number of peaks associated with each gene (1~25):
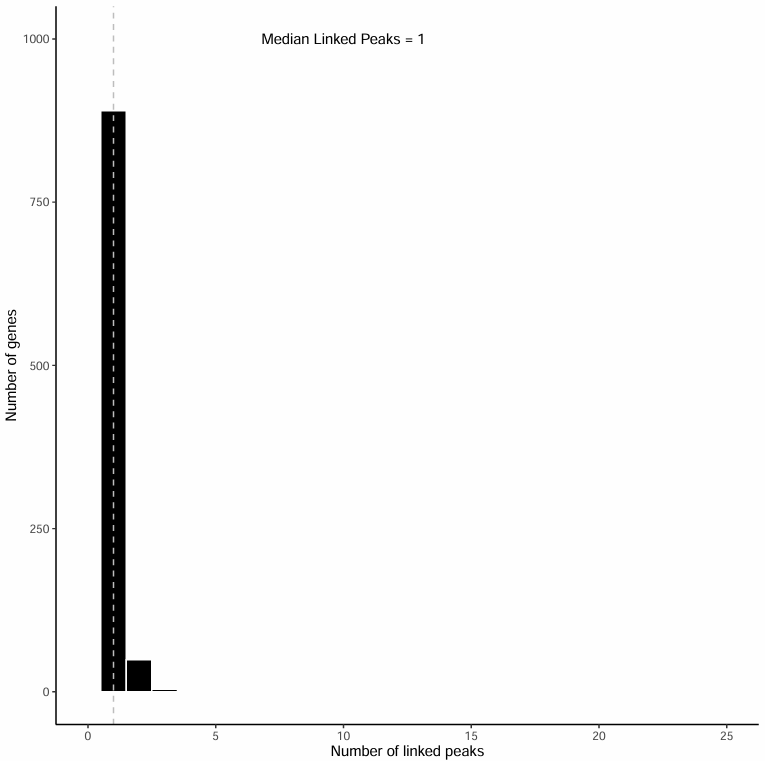
Chart Interpretation
- Horizontal axis: Number of peaks associated with the gene (1~25).
- Vertical axis: Number of genes with corresponding associated peak counts.
- Dashed line indicates the median position, with specific median noted in text.
Analysis Points
- Association Count Distribution: By observing the histogram, the distribution of the number of peaks associated with most genes can be understood.
- Median Assessment: The median reflects the typical level of gene-associated peak counts, helping to assess the quality of the analysis.
- Outlier Identification: Genes with unusually high or low numbers of associated peaks deserve further attention.
Top Significant Peak-Gene Association Volcano Plot
The volcano plot focuses on the Top 10 most significant peak-gene associations:
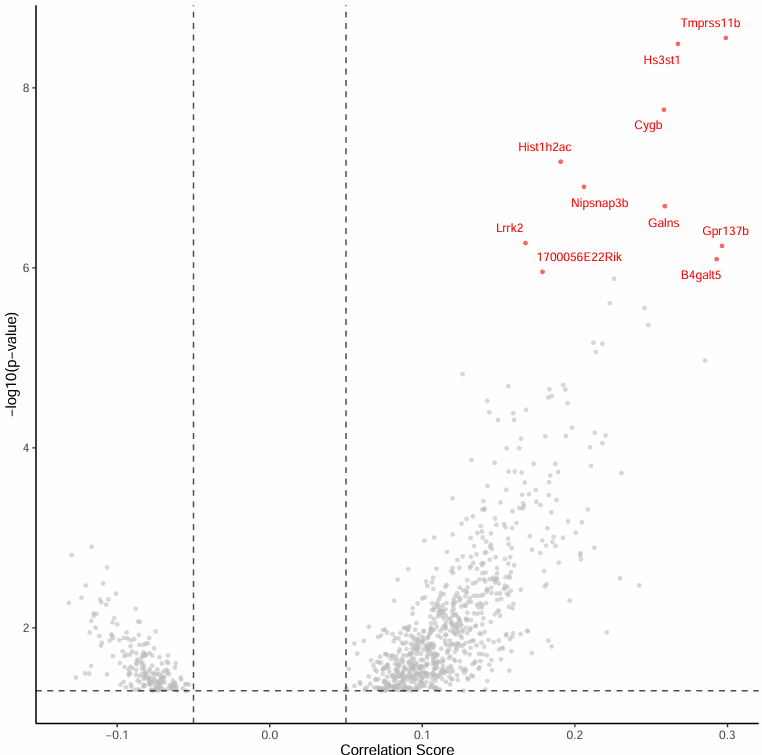
Chart Interpretation
- Horizontal axis: Correlation score.
- Vertical axis: -log10(p) value.
- Top 10 significant genes are labeled for intuitive presentation.
Analysis Points
- Significant Association Identification: Top 10 most significant peak-gene associations are the focus of research and deserve further analysis.
- Correlation Strength: By observing the correlation score, the strength of peak-gene associations can be assessed.
- Statistical Significance: By observing the -log10(p) value, the statistical significance of the association can be assessed.
Correlation Distribution Curve of All Peak-Gene Pairs
The curve plot displays the correlation coefficient distribution of all peak-gene pairs:
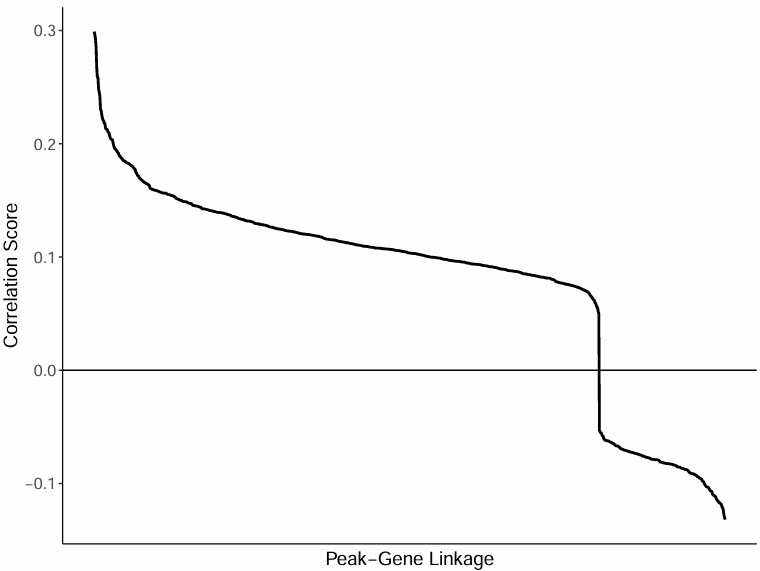
Chart Interpretation
- Horizontal axis: Peak-gene pairs (sorted from high to low correlation).
- Vertical axis: Corresponding correlation coefficient.
Analysis Points
- Overall Distribution Pattern: By observing the curve plot, the correlation distribution pattern of all peak-gene pairs can be understood.
- Strong Association Identification: Peak-gene pairs with strong correlation are located on the left side of the curve and are the focus of research.
- Threshold Selection: A suitable correlation threshold can be selected based on the curve plot for screening significant associations.
Result File List
| File Name | Content Description |
|---|---|
peak_gene_links.csv | Core Data: Contains all significant Peak-to-Gene associations with their correlation scores and p-values. |
Peak2GeneHeatmap.pdf/png | Peak-to-Gene association heatmap. |
Peak2GeneHistogram.pdf/png | Peak-to-Gene histogram. |
Peak2GeneVolcano.pdf/png | Peak-to-Gene violin plot. |
Peak2GeneRank.pdf/png | Peak-to-Gene rank curve plot. |
Notes
1. Importance of Data Quality: The quality of Peak2Gene analysis results largely depends on the quality of input data. Ensure ATAC and RNA data have undergone sufficient QC and normalization.
2. Data Matching: When performing correlation analysis, ensure ATAC and RNA data come from the same cells or matched cell populations. Mismatched data will lead to incorrect associations.
3. Selection of Distance Threshold: Default 500 kb distance threshold is suitable for most cases, but can be adjusted according to research needs. Smaller thresholds may miss remote regulatory elements, while larger thresholds may introduce noise.
4. Significance Threshold: Recommended to use the default p-value threshold (0.05); overly strict thresholds may filter out too many associations, while overly loose thresholds may introduce false positives.
5. Integration with Motif Analysis: Peak2Gene analysis results can be integrated with Motif analysis results to construct a complete TF → peak → gene regulatory axis. It is recommended to perform both analyses simultaneously in the workflow.
6. Caution in Result Interpretation: Peak2Gene analysis identifies correlations, not causal relationships. Results need to be interpreted and verified in combination with biological knowledge and other evidence.
FAQ
Q1: What is the connection between Peak2Gene analysis and Motif enrichment?
A: The two focus on different angles but results can complement each other:
- Peak2Gene: Mainly answers "which peaks actually regulate which genes", determining peak-gene regulatory relationships through correlation, outputting peak-gene pairs and correlation scores.
- Motif Enrichment: Focuses on "which transcription factor binding sites (motifs) are enriched in a group of peaks", reflecting which TFs may regulate these peaks, outputting motif abundance and statistical significance.
- Integrated Analysis: Combining motif analysis (TF → peak) and Peak2Gene analysis (peak → gene) can systematically depict the direct regulatory axis among TFs, regulatory element peaks, and their target genes.
Q2: Why are there fewer associations obtained by Peak2Gene?
A: Causes can be investigated from the following aspects:
- Small sample or cell count: Leading to insufficient statistical power, recommend increasing sample or cell count.
- Selected gene set is too small: Or target region is limited, recommend expanding analysis range or performing whole-genome analysis.
- Significance threshold set too high: Filtering out too many associations, recommend appropriately relaxing the threshold.
- RegionStats step not correctly executed: Missing bias correction information, recommend ensuring RegionStats step is correctly executed.
- Data matching issue: Motif enrichment and Peak2Gene analysis used different cell subsets or filtering conditions, recommend using the same cell subsets.
Q3: How to choose suitable distance threshold?
A: Selection of distance threshold needs to balance sensitivity and specificity:
- Default 500 kb: Suitable for most cases, able to capture most cis-regulatory elements.
- Smaller threshold (e.g., 100 kb): Stricter, may miss remote regulatory elements, but can reduce noise.
- Larger threshold (e.g., 1 Mb): Looser, may capture more remote regulatory elements, but may introduce noise.
- Suggestion: Can run with default threshold first, then adjust based on result quality.
Q4: What downstream analyses can Peak2Gene analysis be used for?
A: Peak2Gene analysis results can be used for various downstream analyses:
- Differential Peak Analysis: Combine with differential peak analysis results to identify biologically significant peak-gene associations.
- Motif Analysis Integration: Integrate with Motif analysis results to construct a complete TF → peak → gene regulatory axis.
- Functional Enrichment Analysis: Perform functional enrichment analysis on associated genes to reveal regulatory biological functions.
- Multi-omics Integration: Integrate with scRNA-seq data to reveal the temporal association between chromatin accessibility and gene expression.
- Regulatory Network Construction: Construct gene regulatory networks based on peak-gene associations.
Q5: How to judge the quality of Peak2Gene analysis?
A: Key indicators for judging Peak2Gene analysis quality:
- Association Count: Reasonable number of associations reflects the statistical power of the analysis.
- Correlation Distribution: Correlation distribution should present a reasonable pattern, with strong associations accounting for a certain proportion.
- Biological Plausibility: Associated peak-gene pairs should conform to known biological knowledge.
- Cell Type Specificity: Different cell types should show different peak-gene association patterns.
Q6: What is the difference between Peak2Gene analysis and traditional distance annotation?
A: Peak2Gene analysis has the following advantages compared to traditional distance annotation:
- Correlation Evidence: Based on single-cell level correlation analysis, providing more reliable regulatory evidence.
- Technical Bias Correction: Uses generalized linear models to correct for multiple technical biases, improving accuracy.
- Cell Type Specificity: Able to identify cell type-specific peak-gene associations.
- Dynamic Changes: Able to reveal dynamic changes in peak-gene associations under different cell states.
References
- Stuart, T., Srivastava, A., Madad, S., Lareau, C. A., & Satija, R. (2021). Single-cell chromatin state analysis with Signac. Nature methods, 18(11), 1333-1341.
- Granja, J. M., Klemm, S., McGeough, L. J., et al. (2019). Single-cell multiomic analysis identifies regulatory programs in mixed-phenotype acute leukemia. Nature biotechnology, 37(12), 1458-1465.
- Pliner, H. A., Packer, J. S., McFaline-Figueroa, J. L., et al. (2018). Cicero predicts cis-regulatory DNA interactions from single-cell chromatin accessibility data. Molecular cell, 71(5), 858-871.