Single-cell scATAC-seq & scRNA-seq Dual-omics Advanced Analysis: AtaCNV Analysis
Introduction
TIP
AtaCNV is a tool designed for Copy Number Variation (CNV) detection from single-cell ATAC-seq (scATAC-seq) data. By processing single-cell chromatin accessibility sequencing data, AtaCNV can reveal genetic heterogeneity within complex tissues such as tumor cells at high resolution.
In single-cell multi-omics research, scATAC-seq data not only provides information on chromatin open states but can also infer Copy Number Variations (CNV) by analyzing the number of reads mapped to genomic regions. AtaCNV is developed specifically for single-cell ATAC-seq data, capable of revealing genetic heterogeneity within complex tissues like tumor cells at high resolution. It is suitable for the scATAC-seq channel in multi-omics single-cell data, enabling automatic inference and visualization of cell copy number states in complex samples such as tumors.
Core Functions of AtaCNV
Malignant Cell Identification Distinguish between malignant and non-malignant cells. AtaCNV calculates the CNV burden score for each cell group using copy number ratio data and classifies groups with high CNV burden as malignant cells based on this.
High-Resolution CNV Detection Provides high-resolution CNV detection in units of million base pairs (1 Mbp) genomic fragments, capable of accurately quantifying the copy number state of each cell across the entire genome.
Multiple Normalization Modes Offers four normalization modes, allowing selection of the appropriate mode based on data characteristics, including matched normal samples, known normal cells, all cells, or automatic identification mode.
Data Smoothing and Bias Removal Smoothes the count matrix by fitting a first-order dynamic linear model for each cell, while performing cell-based local regression to eliminate potential biases caused by GC content.
Joint Segmentation and Copy Number Inference Applies the multi-sample BIC-seq algorithm to jointly segment all single cells, estimating the copy number ratio of fragments obtained by each cell, and inferring discrete copy number states through Bayesian methods.
This document aims to provide a detailed technical guide for AtaCNV for single-cell multi-omics researchers, covering its basic principles, operation methods on the SeekSoul™ Online Cloud Platform, result interpretation, and FAQs, helping you quickly master and apply this tool.
Theoretical Basis of AtaCNV
Core Principle
The core idea of AtaCNV analysis is: Using the number of reads mapped to genomic regions in scATAC-seq data as a proxy indicator for DNA copy number in that region, infer the copy number variation of each cell through steps such as data smoothing, normalization, joint segmentation, and copy number inference.
What is CNV
Copy Number Variation (CNV) refers to structural variations in the quantity of larger DNA fragments in the genome, mainly manifesting as amplification (gain) or deletion (loss) of chromosomal regions. Normally, human cells are diploid (usually 2 copies per autosome); when amplification occurs, the copy number exceeds 2, and when deletion occurs, the copy number is below 2.
CNV is an important driver of the occurrence and progression of various diseases such as tumors. Traditional CNV analysis is mainly based on Whole Genome Sequencing (WGS) or Whole Exome Sequencing (WES), which can only provide population-average information. Single-cell CNV analysis infers the copy number state of each cell at single-cell resolution, capable of revealing genomic differences and heterogeneity among different cells within tissues.
Two Directions of Single-cell Multi-omics CNV Analysis
There are two main directions for using single-cell multi-omics data for CNV analysis:
- Direction 1: Based on scRNA-seq data - Infer CNV using gene expression information, main tool is infercnv.
- Direction 2: Based on scATAC-seq data - Infer CNV using read counts, main tools include epiAneuFinder, AtaCNV, CopyscAT.
TIP
Introduction to Mainstream Single-cell ATAC-seq CNV Analysis Tools
Currently, tools commonly used for CNV detection in scATAC-seq data include: epiAneuFinder, CopyscAT, and AtaCNV. This guide focuses on the detailed usage of AtaCNV. If you need to use other tools, please refer to relevant documents for more information.
Key Algorithms and Workflow
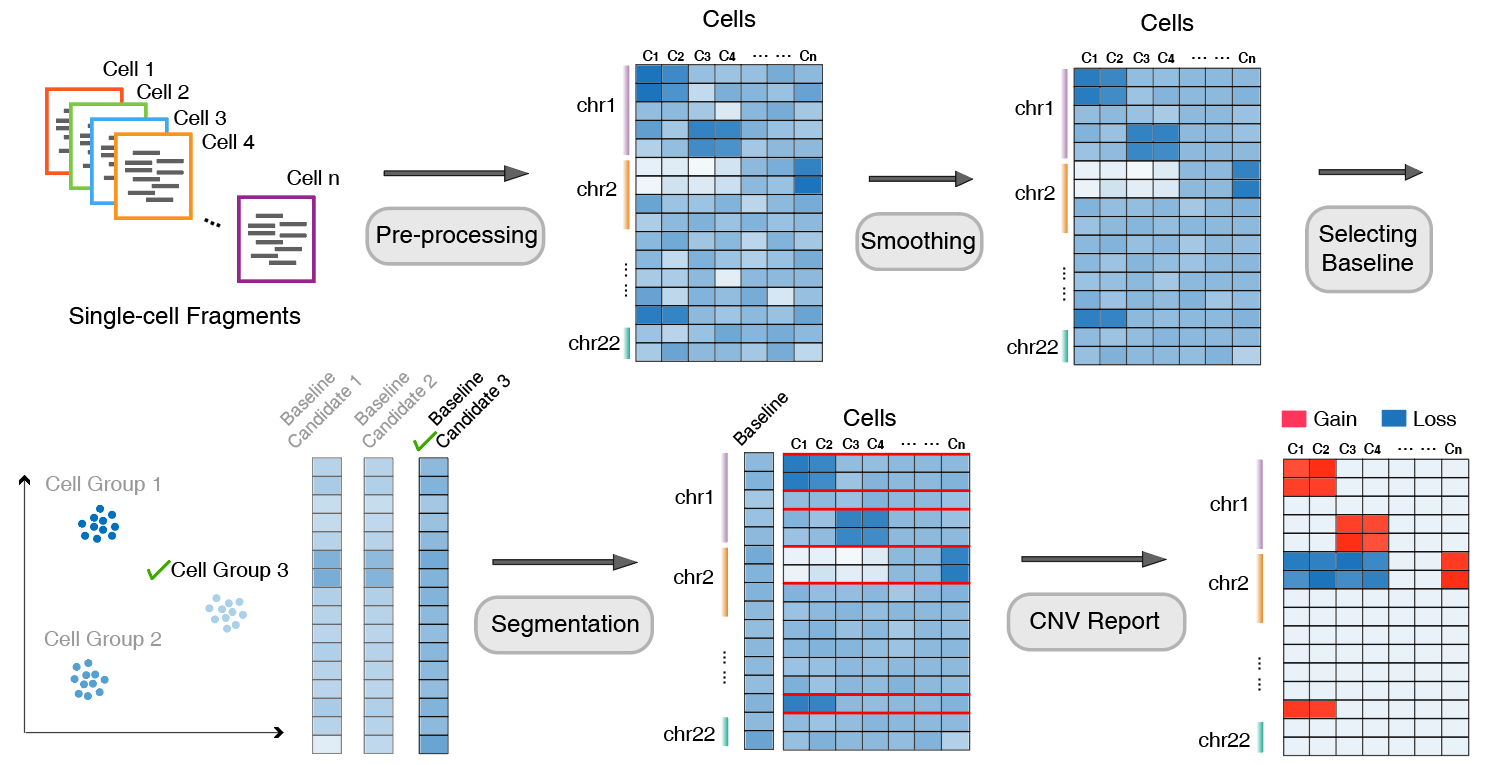
The analysis workflow of AtaCNV can be summarized into the following main steps:
Input and Preliminary Screening: Using the single-cell read count matrix of million base pair (1 Mbp) genomic fragments as input, cells and genomic fragments are first screened based on fragment mappability and the number of zero values.
Data Smoothing and Bias Removal: To reduce extreme noise, AtaCNV smooths the count matrix by fitting a first-order dynamic linear model for each cell. Cell-based local regression is also performed to eliminate potential biases caused by GC content.
Normalization Processing:
- If normal cells exist: Normalize the smoothed count data against normal cell data to deconvolve copy number signals from confounding factors such as chromatin accessibility.
- If normal cells are lacking: Since tumor single-cell data often contains a large number of non-tumor cells, AtaCNV first clusters the cells to identify high-confidence normal cell groups and uses their smoothed depth data as a baseline for normalization.
Joint Segmentation and Copy Number Inference: AtaCNV applies the multi-sample BIC-seq algorithm to jointly segment all single cells and estimates the copy number ratio of fragments obtained by each cell.
CNV Group Discrimination and Further Inference: Using copy number ratio data, calculate the CNV burden score for each cell group and classify groups with high CNV burden as malignant cells. For tumor cells, AtaCNV further infers their discrete copy number states through Bayesian methods.
Applicable Scenarios and Main Objectives
Suitable Sample Types:
- Tumor Tissue Samples (Strongly Recommended) - Contain a large number of CNV events, can reveal tumor heterogeneity and subclonal structure.
- Precancerous Lesions or Developmental Abnormalities - Can detect early genomic structural variations.
Unsuitable Sample Types:
- Normal Healthy Tissues - Most cells are diploid, lacking significant CNV events, CNV analysis has limited significance.
Main Objectives of Single-cell CNV Analysis:
- Malignant Cell Identification - Distinguish malignant cells from non-malignant cells (malignant cells usually show large-scale, non-random CNV patterns).
- Tumor Heterogeneity Resolution - Identify subclonal populations with different CNV characteristics.
- Clonal Evolution Tracking - Infer clonal evolutionary relationships of tumors through CNV pattern similarity.
Cloud Platform Operation Guide
On the cloud platform, the AtaCNV analysis workflow is designed to be intuitive and easy to use. You do not need to write code; you can complete the analysis through the parameter configuration interface.
Preparation Before Analysis
TIP
The success of AtaCNV analysis largely depends on the quality of input data and the choice of normalization mode. Before starting the analysis, please ensure:
- Data Preprocessing Completed: Your single-cell ATAC data has undergone standard QC, dimensionality reduction, clustering, and cell type annotation.
- Appropriate Sample Type: AtaCNV is mainly suitable for tumor tissue samples; CNV analysis of normal healthy tissues has limited significance.
- Data Quality Requirements: Ensure fragment files align with cell barcodes and complete basic QC. Low-quality ATAC data will lead to inaccurate CNV detection.
- Normalization Mode Information: If there are matched normal samples or known normal cell information, it is recommended to prepare in advance to obtain more accurate CNV detection results.
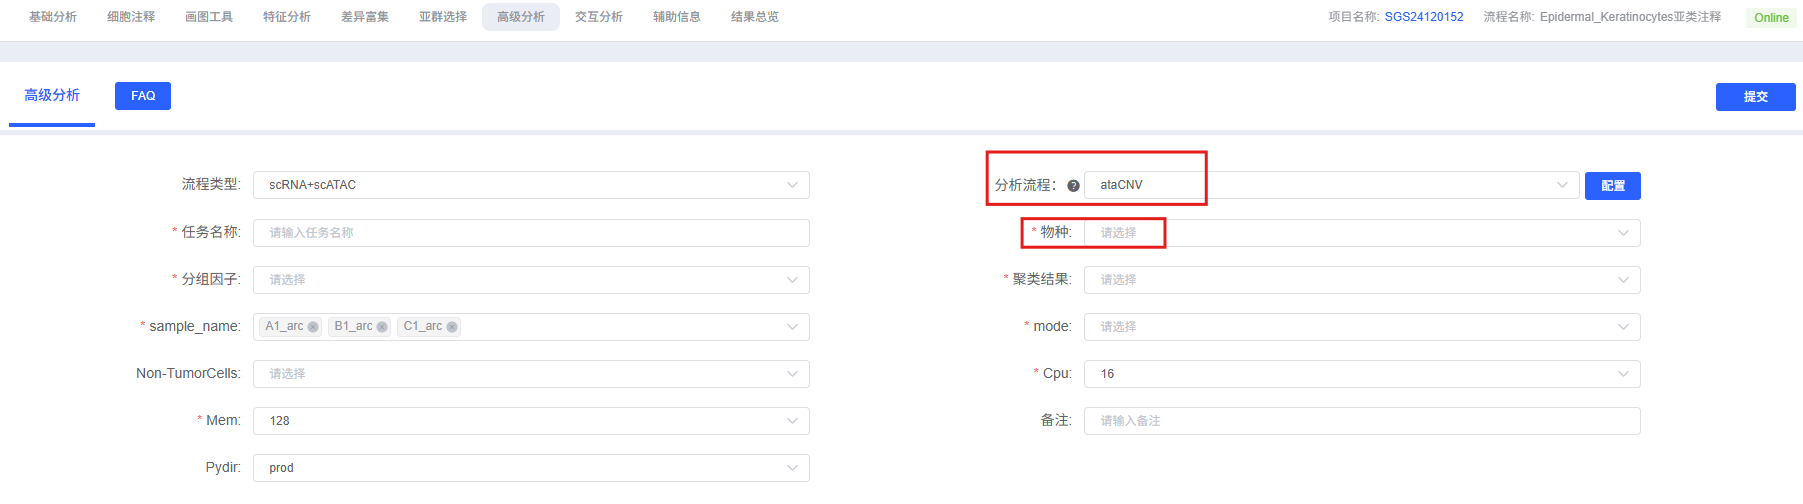
Parameter Details
The table below details the main parameters and their descriptions for the AtaCNV analysis module on the cloud platform.
| Parameter Name | Description |
|---|---|
| Task Name | Name of this analysis task, must start with an English letter, can contain English letters, numbers, underscores, and Chinese characters. |
| sample_name | Sample name, specific sample name required. |
| Species | Species, limited to human or mouse. |
| Group Factor | Cell annotation result, column name in meta, e.g., CellAnotation. |
| Clustering Result | Clustering result, column name in meta, e.g., wknn_res.0.5_d30_l2_50. |
| mode | Analysis mode, required. Options: "normal cells" (reference normal cells), "all cells" (all cells), "none" (no reference). |
| Non-TumorCells | Normal cell type used for reference. If mode is "normal cells", fill in a cell type from the group factor (e.g., T_cells); if mode is "all cells" or "none", no need to fill. |
Important Notes
TIP
- Normalization Mode Selection: AtaCNV provides four normalization modes. Mode 1 (matched normal sample) is most reliable, prioritize when matched non-tumor samples are available. Mode 2 (normal cells) is used when normal cells in the sample are known. Mode 3 (all cells) is only suitable for low tumor purity cases. Mode 4 (automatic identification) is used when no extra information is available, but accuracy may be lower.
- Data Smoothing: AtaCNV automatically smooths data to reduce extreme noise and eliminate potential biases caused by GC content.
- Window Size: Default 1 Mbp window size is suitable for most cases, can be adjusted based on data characteristics.
- Sample Type: AtaCNV is mainly suitable for tumor tissue samples; CNV analysis of normal healthy tissues has limited significance.
Operation Workflow
- Enter Analysis Module: Navigate to the "Advanced Analysis" module on the cloud platform and select "AtaCNV".
- Create New Task: Name your analysis task and select the sample or project to be analyzed.
- Configure Parameters: Select the cell types, grouping information, normalization mode, and other parameters according to the guide above.
- Submit Task: After confirming the parameters are correct, click the "Submit" button and wait for the analysis to complete.
- View Results: After the analysis is finished, view the generated analysis report and result files in the task list, including CNV heatmaps, copy number matrices, etc.
Results Interpretation
The analysis report of AtaCNV contains rich charts and data files. The following is a detailed interpretation of the core results.
Copy Number Variation Heatmap
The copy number variation heatmap is the core visualization result of CNV analysis, comprehensively displaying the copy number status of all cells across the entire genome:
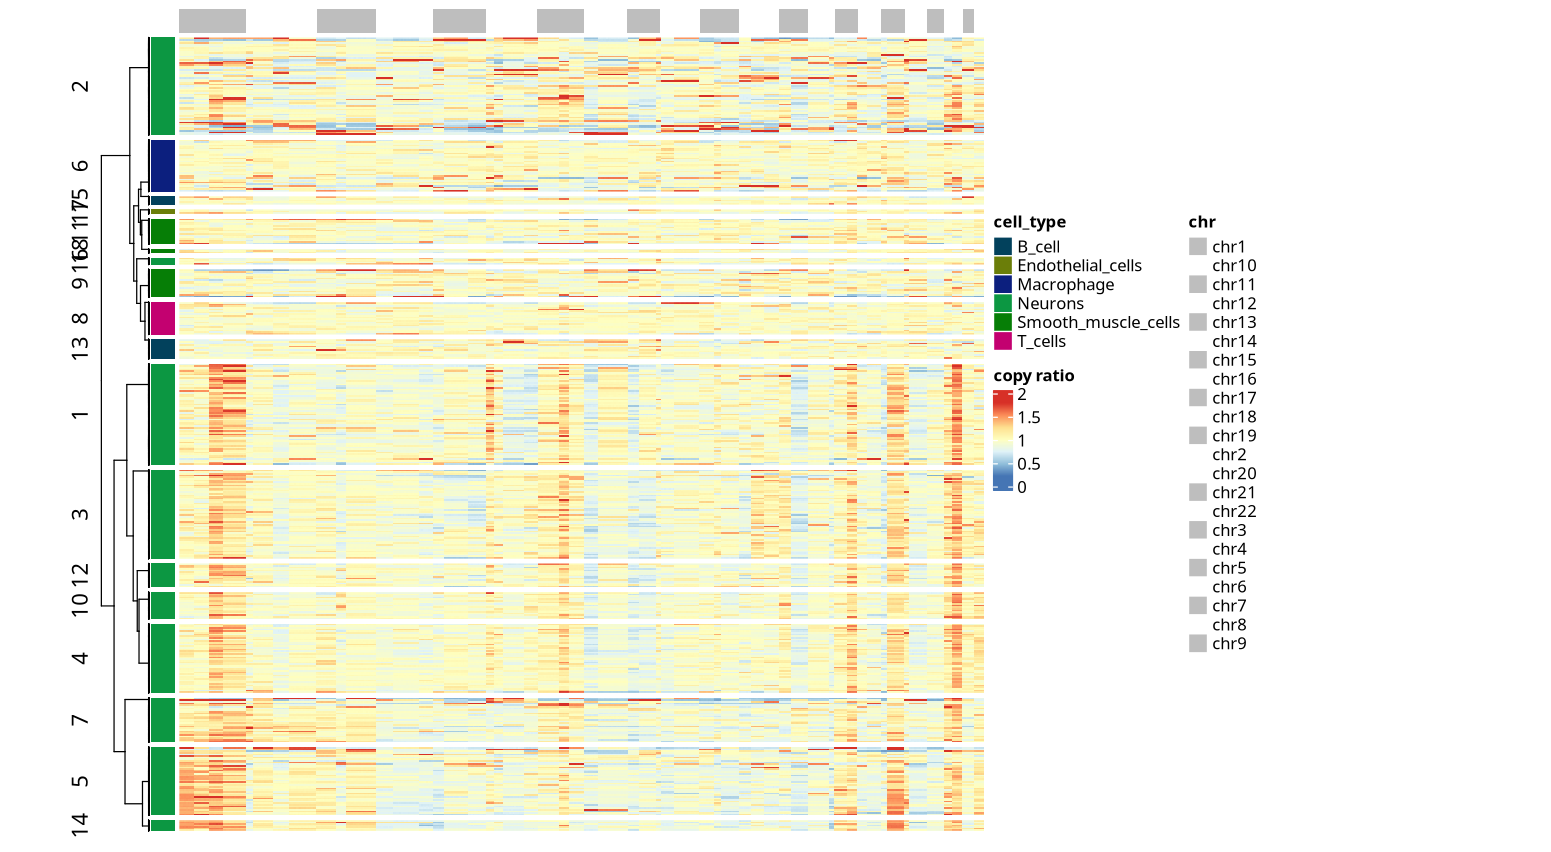
Chart Interpretation
In the copy number variation heatmap, each row represents a cell, and each column represents a continuous interval (bin) on the genome. All columns are arranged in order of chromosome physical position, from chromosome 1 to sex chromosomes (if any). The color of each column reflects the relative copy number value of that interval in the corresponding cell: red indicates copy number amplification (gain), and blue indicates copy number deletion (loss). The heatmap shows that the number of columns between adjacent chromosomes may differ significantly (e.g., some have 3 columns, some 4, some only 1), reflecting subtle differences in chromosome length.
Analysis Points
Identify Malignant Cells: By observing CNV patterns, malignant cells can be distinguished from non-malignant cells. Malignant cells usually show large-scale, non-random CNV patterns, while non-malignant cells maintain a relatively normal diploid state.
Resolve Tumor Heterogeneity: Different cell populations may exhibit different CNV characteristics, reflecting cellular heterogeneity and subclonal structures within the tumor.
High-Resolution Detection: AtaCNV provides high-resolution CNV detection in units of 1 Mbp, capable of accurately quantifying the copy number state of each cell across the entire genome.
Result File List
| File Name | Content Description |
|---|---|
copy_ratio.png | Copy Number Variation Heatmap: Displays the copy number status of all cells across the entire genome. |
Notes
1. Importance of Sample Type: AtaCNV is mainly suitable for tumor tissue samples; CNV analysis of normal healthy tissues has limited significance. Please confirm if the sample type is suitable before performing CNV analysis.
2. Selection of Normalization Mode: AtaCNV provides four normalization modes, and selecting the appropriate mode is crucial for the accuracy of CNV detection. It is recommended to prioritize Mode 1 (matched normal sample) or Mode 2 (known normal cells) for more accurate results.
3. Data Quality Requirements: Ensure the quality of input data meets requirements; low-quality ATAC data will lead to inaccurate CNV detection. AtaCNV automatically performs data smoothing and bias removal, but high-quality input data is still required.
4. Selection of Window Size: Default 1 Mbp window size is suitable for most cases, can be adjusted based on data characteristics. Smaller windows provide higher resolution but require higher sequencing depth.
5. Caution in Result Interpretation: CNV detection results need to be interpreted in combination with biological knowledge. Certain technical factors (such as sequencing depth, batch effects) may affect the accuracy of CNV detection.
6. Use of Clustering Information: If there are no pre-existing clustering results, AtaCNV will automatically cluster based on the count matrix. If clustering results are available, it is recommended to provide them to improve analysis accuracy.
FAQ
Q1: How to choose the appropriate normalization mode?
A: AtaCNV provides four normalization modes, suggestions are as follows:
- Mode 1 (matched normal sample): Most reliable, prioritize when matched non-tumor samples are available.
- Mode 2 (normal cells): Used when normal cells in the sample are known; tools like ArchR can be used to estimate marker gene expression from scATAC-seq data to initially identify normal cells.
- Mode 3 (all cells): Only suitable for low tumor purity cases, uses all cells to build baseline.
- Mode 4 (none): Used when no extra information is available, AtaCNV will automatically identify the most likely normal cells, but accuracy may be lower.
- Suggestion: If possible, try to use Mode 1 or Mode 2 to obtain more accurate CNV detection results.
Q2: How to interpret numerical values in copy state results?
A: In copy state inference results:
- 0.5: Indicates copy number deletion (loss), the copy number in that region in the corresponding cell is lower than normal.
- 1: Indicates copy number neutral, i.e., normal diploid state.
- 1.5: Indicates copy number amplification (gain), the copy number in that region in the corresponding cell is higher than normal.
- These values reflect the copy number state of each cell in each genomic interval (bin) and can be used to identify malignant cells and subclonal structures.
Q3: What are the advantages of AtaCNV compared to other CNV detection tools?
A: The main advantages of AtaCNV include:
- Designed for scATAC-seq: Fully utilizes the characteristics of scATAC-seq data, inferring CNV directly from chromatin accessibility data.
- High-Resolution Detection: Provides high-resolution CNV detection in units of 1 Mbp.
- Data Smoothing and Bias Removal: Automatically performs data smoothing and eliminates potential biases caused by GC content.
- Multiple Normalization Modes: Offers four normalization modes, flexible selection based on data characteristics.
- Joint Segmentation Algorithm: Applies multi-sample BIC-seq algorithm to jointly segment all single cells, improving detection accuracy.
Q4: How to understand the CNV burden score?
A: The CNV burden score is an important indicator used by AtaCNV to identify malignant cells:
- High CNV Burden: Indicates that the cell group has a large number of CNV events, usually classified as malignant cells.
- Low CNV Burden: Indicates that the cell group has fewer CNV events, usually classified as non-malignant cells.
- CNV burden score is calculated based on copy number ratio data and is a key indicator for distinguishing malignant cells from non-malignant cells.
Q5: Which normalization mode should be used if there is no matched normal sample?
A: If there is no matched normal sample, selection can be made according to the following priority:
- Mode 2 (known normal cells): If normal cells can be identified by other methods (such as ArchR), prioritize this mode.
- Mode 4 (automatic identification): If no extra information is available, use this mode, AtaCNV will automatically identify the most likely normal cells.
- Mode 3 (all cells): Only suitable for cases with low tumor purity (<50%), generally not recommended.
Q6: What types of CNV can AtaCNV detect?
A: AtaCNV can detect various types of CNV:
- Chromosomal Arm Level CNV: Large-scale chromosomal amplification or deletion.
- Fragment Level CNV: Medium-sized genomic fragment amplification or deletion.
- Local CNV: Small-scale genomic region amplification or deletion.
- Through 1 Mbp window resolution, AtaCNV can detect various CNV events from local to chromosomal arm levels.
References
- Wang, Xiaochen, et al. "Detecting copy-number alterations from single-cell chromatin sequencing data by AtaCNV." Cell Reports Methods 5.1 (2025).