CellPhoneDB_spatial Analysis
Introduction
IMPORTANT
CellPhoneDB is a publicly available human ligand-receptor interaction database that, combined with statistical analysis tools, can be used to infer cell-cell communication in single-cell or spatial transcriptomics data. CellPhoneDB_spatial is a version specifically developed for spatial transcriptomics data, which can identify ligand-receptor interactions between spatially adjacent cells by integrating spatial microenvironment information, providing a powerful tool for understanding cell communication in tissue microenvironments.
In spatial transcriptomics research, cell communication is not only regulated by gene expression but also significantly influenced by spatial position and microenvironment context. CellPhoneDB_spatial can identify ligand-receptor interactions occurring in specific spatial environments by integrating cell type annotations, gene expression data, and spatial microenvironment information, revealing cell communication networks in tissue microenvironments.
Core Functions of CellPhoneDB_spatial
- Ligand-receptor database: Contains approximately 3,000 manually curated ligand-receptor interaction pairs
- Multi-subunit complex support: Accurately represents heteromeric complexes of ligands and receptors
- Spatial microenvironment analysis: Identifies cell communication in specific regions based on spatial microenvironment information
- Statistical significance testing: Evaluates statistical significance of cell communication through permutation tests
- Rich visualization: Provides various visualization methods such as dot plots, heat maps, and circle diagrams
This document aims to provide spatial transcriptomics researchers with a detailed technical guide for CellPhoneDB_spatial, covering its basic principles, operation methods on SeekSoul™ Online, result interpretation, practical cases, and frequently asked questions, helping you quickly master and apply this tool.
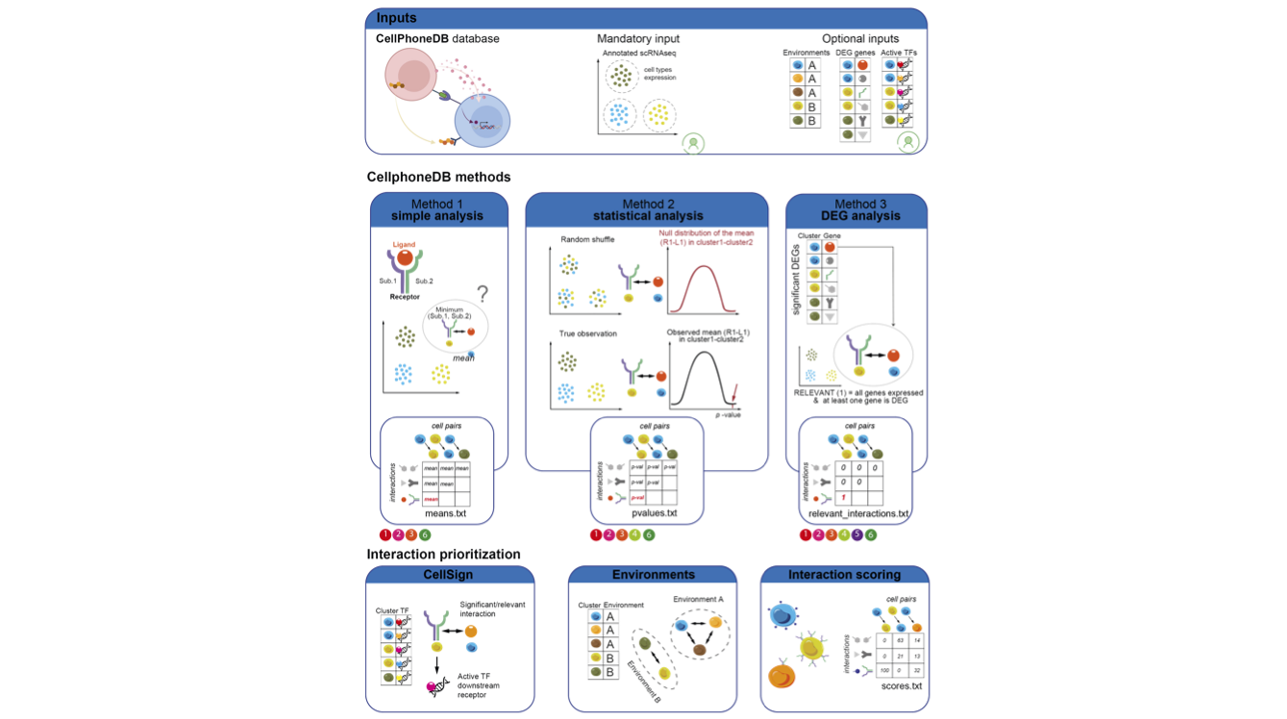
CellPhoneDB_spatial Theoretical Foundation
The core idea of CellPhoneDB_spatial is: to infer ligand-receptor-mediated cell communication between spatially adjacent cells by integrating ligand-receptor database, gene expression data, and spatial microenvironment information, and to evaluate its significance through permutation tests. This process can be summarized in the following main steps:
- Data preprocessing: Quality control and normalization of the expression matrix
- Ligand-receptor pair filtering: Filtering ligand-receptor pairs expressed in the data from the database
- Spatial microenvironment integration: Defining cells' microenvironment affiliation based on spatial position information
- Expression calculation: Calculating the average expression levels of ligands and receptors in each cell group
- Statistical significance testing: Evaluating statistical significance of ligand-receptor interactions through permutation tests
- Spatial specificity analysis: Identifying cell communication enriched in specific spatial microenvironments
SeekSoul™ Online Operation Guide
On SeekSoul™ Online, the CellPhoneDB_spatial analysis process is designed to be intuitive and user-friendly. You don't need to write code; you can complete the analysis through the parameter configuration interface.
Preparation Before Analysis
IMPORTANT
The success of CellPhoneDB_spatial analysis largely depends on the quality of input data and the rationality of microenvironment definition. Before starting the analysis, please ensure:
- Data has been preprocessed: Your spatial transcriptomics data has undergone standard quality control, dimensionality reduction, clustering, and cell type annotation.
- Microenvironment definition is reasonable: Ensure each cell is assigned to a reasonable spatial microenvironment (through spatial clustering or spatial domain annotation).
- Cell type annotation is accurate: The accuracy of cell type annotation directly affects the results of cell communication analysis.
- Sample selection is reasonable: It is recommended that each microenvironment contains at least 2 or more cell types.
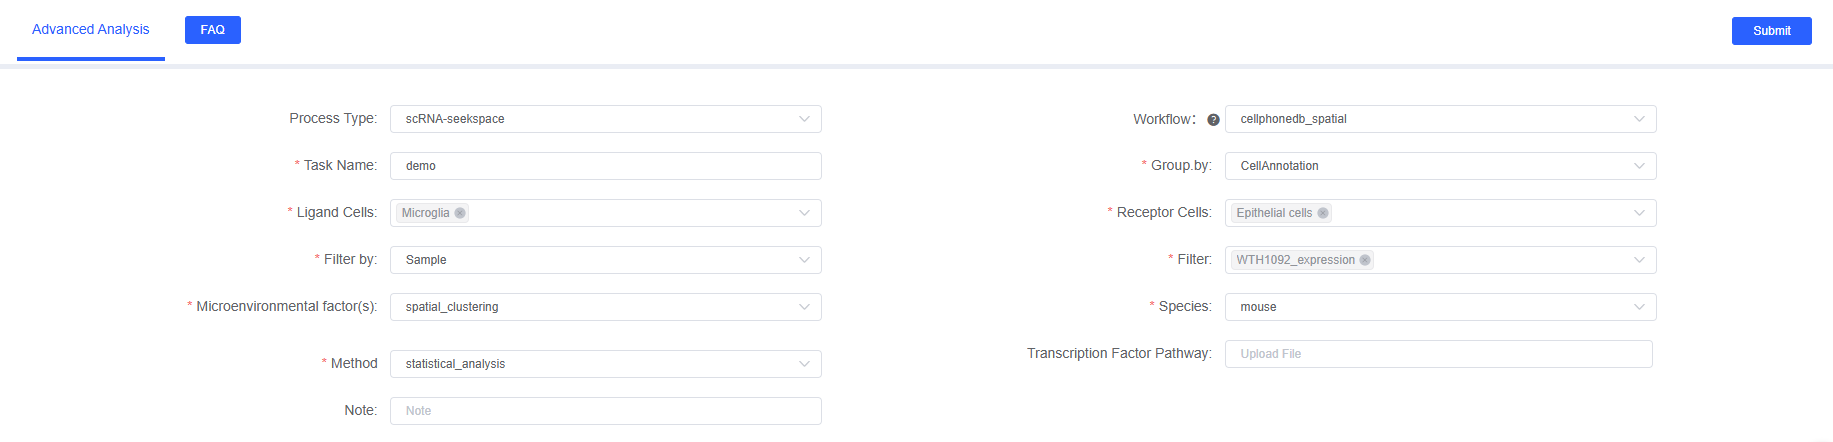
Parameter Details
The following table details the main parameters and descriptions of the CellPhoneDB_spatial analysis module on SeekSoul™ Online.
| Interface Parameter | Description |
|---|---|
| Task Name | The name of this analysis task, must start with an English letter, and can include English letters, numbers, underscores, and Chinese characters. |
| Group.by | Column name of meta, such as CellAnnotation, used to specify the cell type annotation column, required. |
| Ligand Cells | Objects corresponding to the col_celltype column of meta, interacting cell type 1, multiple selection. Select the cell type as the ligand-expressing cell. |
| Receptor Cells | Objects corresponding to the col_celltype column of meta, interacting cell type 2, multiple selection. Select the cell type as the receptor-expressing cell. Can be the same as cell type 1, indicating analysis of all communications between cell types. |
| Filter.by | Column name of meta, such as Sample, used to specify the sample column, used in conjunction with "Filtering Objects", required. |
| Filter | Sample names based on the col_sam column of meta, select the samples to be analyzed, required. |
| Microenvironmental factor(s) | Column name of meta, microenvironment factor column name. For example, spatial clustering result column name (such as clust_M1_lam0.6_k50_res0.4) or custom spatial domain annotation column name. This parameter is used to define which cells belong to the same spatial microenvironment, and CellPhoneDB will only analyze cell type pairs within the same microenvironment. |
| Species | Select the species name corresponding to the analysis workflow data, currently supporting human and mouse. Note: CellPhoneDB database is based on human genes, and mouse data needs to be converted using homologous genes. |
| Method | Selection of cell interaction calculation method, optional statistical_analysis or degs_analysis. statistical_analysis is recommended for spatial data, based on expression statistical test; degs_analysis requires providing a list of differentially expressed genes, focusing on cell type-specific communication. |
| Transcription Factor Pathway | Transcription factor file path, optional. If provided, the first column of the file is cell type, and the second column is active transcription factors (TF) in that cell type. CellPhoneDB will use this information to highlight relevant/significant interactions with active downstream TFs. Supports .txt files. |
| Note | Custom remark information, which can be used to record the reasons for setting analysis parameters or special instructions. |
Important Notes
CAUTION
- Gene ID requirements: Must use human gene symbols (HUMAN gene symbols), mouse data will be automatically converted
- Microenvironment necessity: Spatial data analysis must provide microenvironment factors, otherwise it will be analyzed as ordinary single-cell data
- Cell number requirements: It is recommended to have at least 10 cells of each cell type
- Memory limitations: Large datasets may require longer analysis time
TIP
Parameter debugging suggestions:
- It is recommended to use statistical_analysis method for initial analysis
- If there are many cell types, you can first select some interested cell types for testing
- Microenvironment definition greatly affects the results, it is recommended to try different spatial clustering parameters
- Multiple runs can be performed with different microenvironment definitions or cell type combinations
Operation Process
- Enter the analysis module: Navigate to the "Advanced Analysis" module on SeekSoul™ Online and select "cellphonedb_spatial".
- Create a new task: Name your analysis task and select the project to be analyzed.
- Configure basic parameters:
- Set grouping factor and cell types 1 and 2
- Set filtering factor and filtering objects
- Configure spatial parameters:
- Set microenvironment factor (spatial clustering or spatial domain column name)
- Select species
- Configure method parameters:
- Select analysis method (statistical_analysis or degs_analysis)
- Optional: Upload transcription factor file
- Submit task: After confirming the parameters are correct, click the "Submit" button and wait for analysis to complete.
- Download and view: After analysis is complete, download and view the generated analysis report and result files in the task list.
Result Interpretation
The CellPhoneDB_spatial analysis report contains rich charts and data files, with detailed interpretation of core results below.
Result File List
| File Name | Content Description |
|---|---|
statistical_analysis_means_*.txt | Average expression levels of ligand-receptor pairs in each cell type pair |
statistical_analysis_pvalues_*.txt | Significance p-values of ligand-receptor pairs in each cell type pair |
statistical_analysis_significant_means_*.txt | Significant ligand-receptor pairs and their average expression levels (p<0.05) |
statistical_analysis_deconvoluted_*.txt | Information about ligand-receptor pairs after disassembly of multi-subunit complexes |
statistical_analysis_interaction_scores_*.txt | Interaction scores of ligand-receptor pairs |
cpdb_dotplot_*.png/pdf | Ligand-receptor dot plot |
cpdb_heatmap_*.png/pdf | Heat map of interaction counts between cell types |
cpdb_cc_dotplot_*.png/pdf | Dot plot classified by cell communication |
netVisual_circle_*.png/pdf | Cell interaction network circle diagram |
niche_*_cpdb_heatmap_*.png/pdf | Heat map of specific ligand-receptor pairs in each microenvironment |
Ligand-receptor Dot Plot
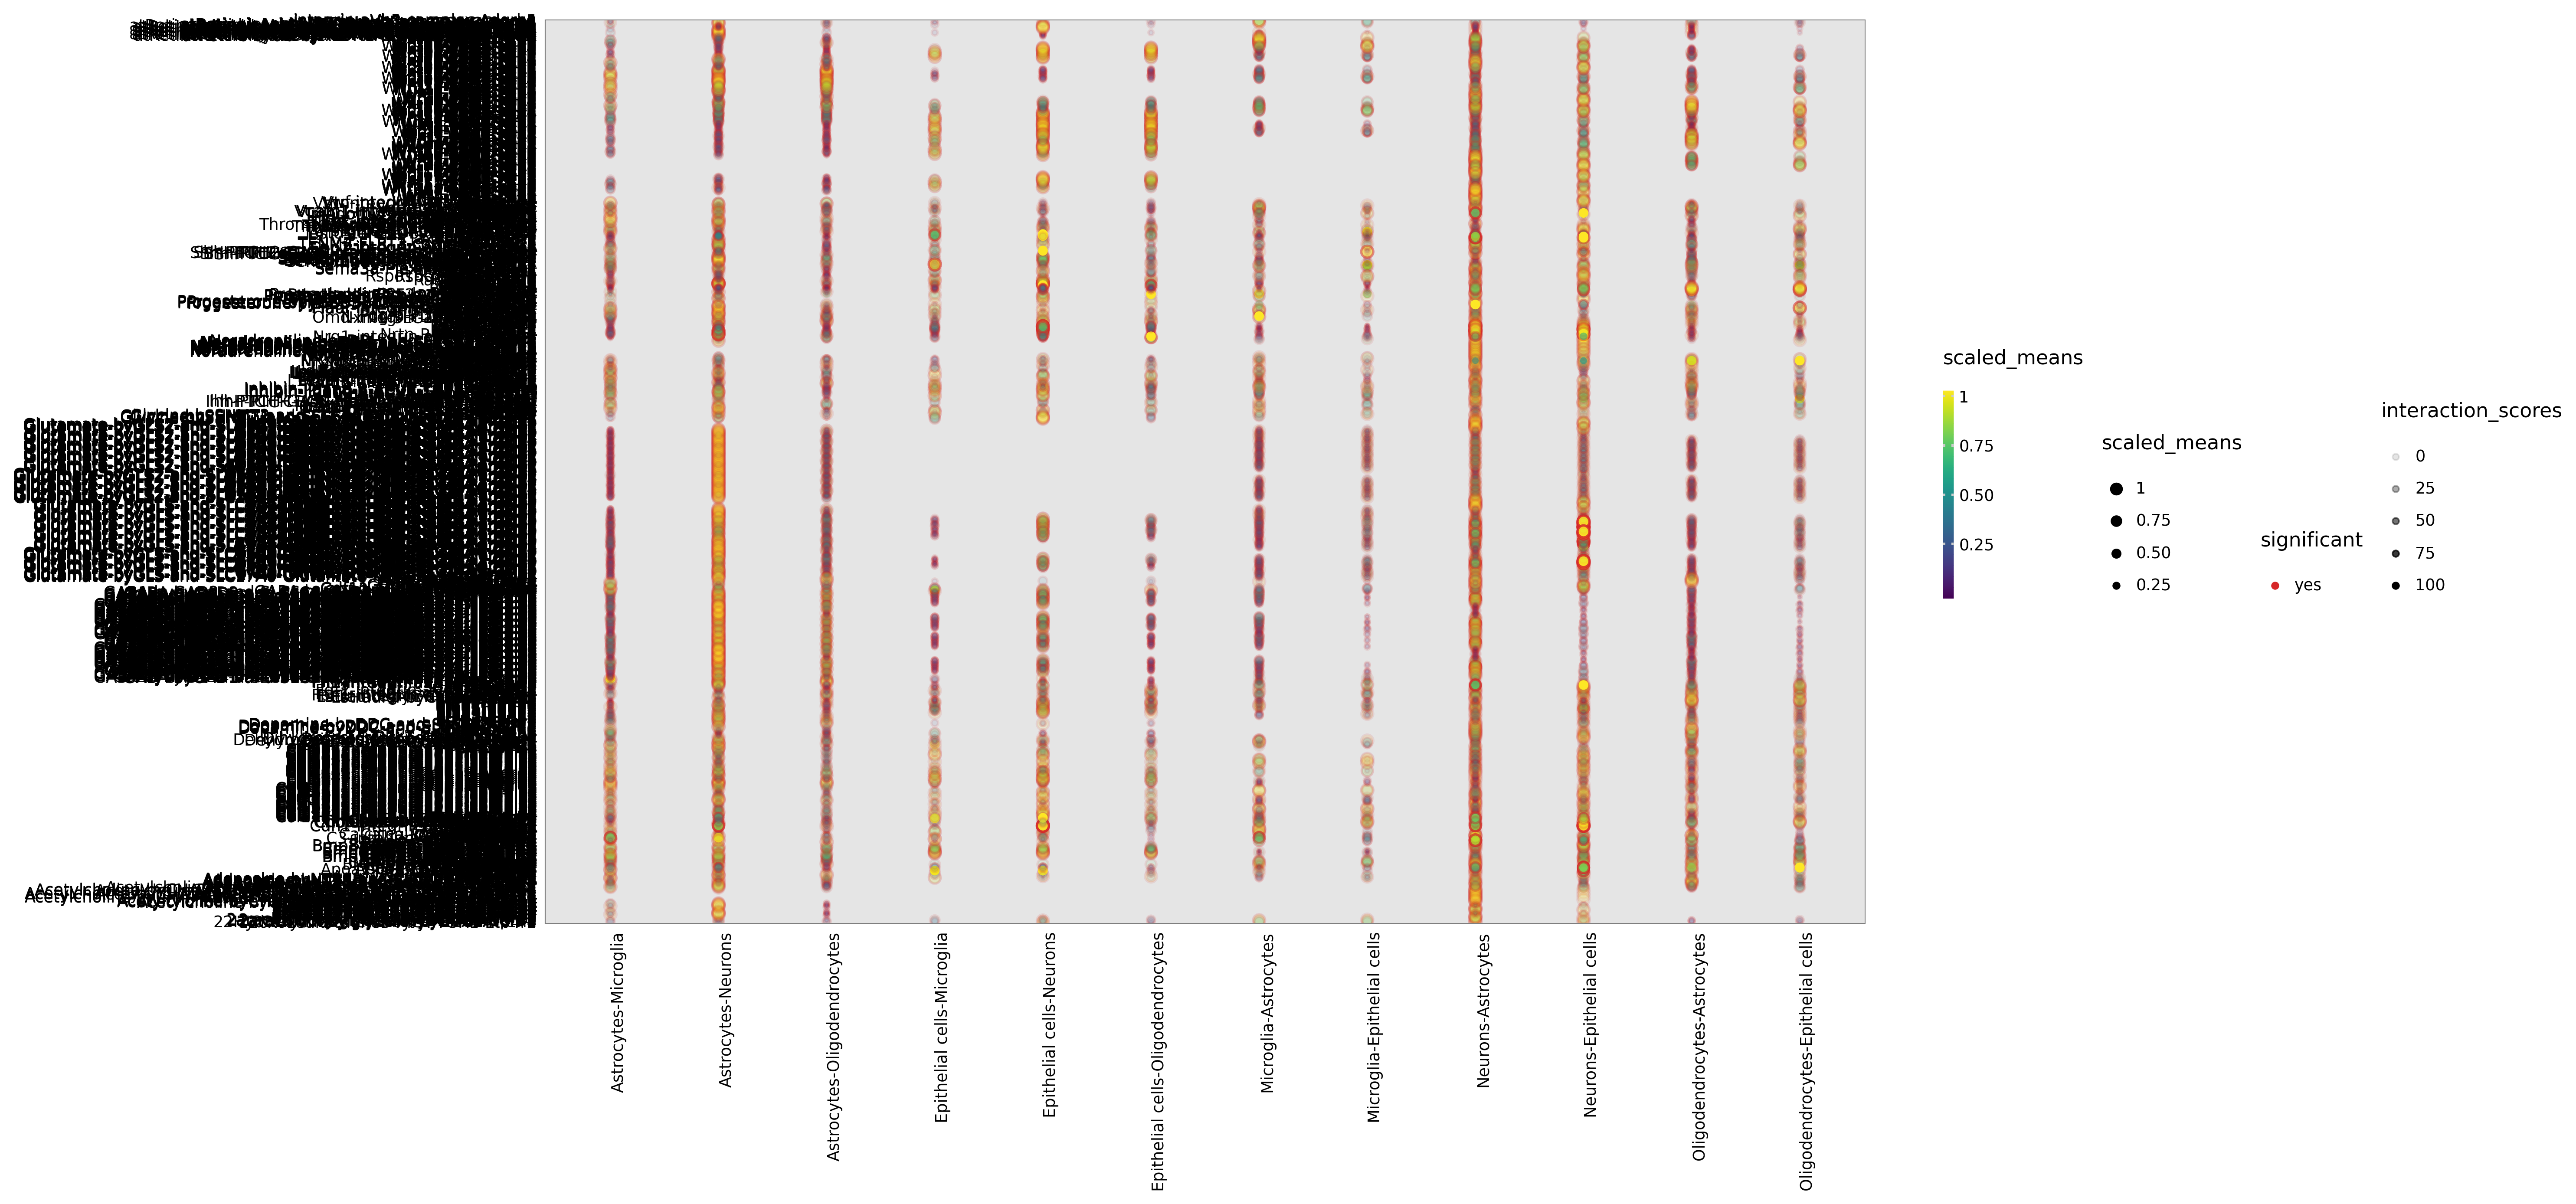
Chart Structure
- X-axis: Cell type pairs (ligand-expressing cell | receptor-expressing cell)
- Y-axis: Ligand-receptor pair names
- Point size: Average expression levels of ligand and receptor (means)
- Point color: Negative logarithm of p-value (-log10(p-value)), darker color indicates higher significance
Interpretation Points
- Significant interactions: Larger and darker points indicate that the ligand-receptor pair has high expression and significance in the cell type pair
- Cell specificity: Observe in which cell type pairs specific ligand-receptor pairs are significantly expressed
- Ligand-receptor pair selection: The chart typically shows the top 50-100 most significant ligand-receptor pairs
- Biological interpretation: Interpret biological functions of significant interactions in combination with literature and databases
Dot plots only show significant ligand-receptor pairs with p<0.05. If some expected interactions are not displayed, it may be due to low expression or not reaching the significance threshold.Interaction Heatmap Between Cell Types
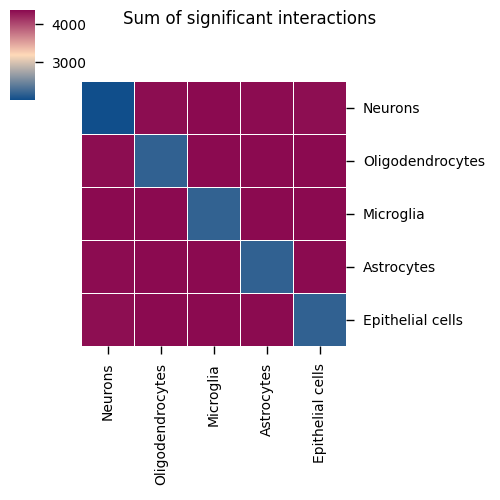
Chart Structure
- Rows and columns: Different cell types
- Color intensity: Number of significant ligand-receptor pairs between the cell type pair
- Numerical values: Display specific interaction counts
Interpretation Points
- Interaction intensity: Deeper color indicates more ligand-receptor interactions between the cell type pair
- Key cell pairs: Identify cell type pairs with the most interactions, which may be key communication axes in tissues
- Symmetry: Note that the heat map may be asymmetrical because ligand-receptor interactions have directionality
- Network structure: Overall observation of cell communication network topology in tissues
Cell Interaction Network Circle Diagram
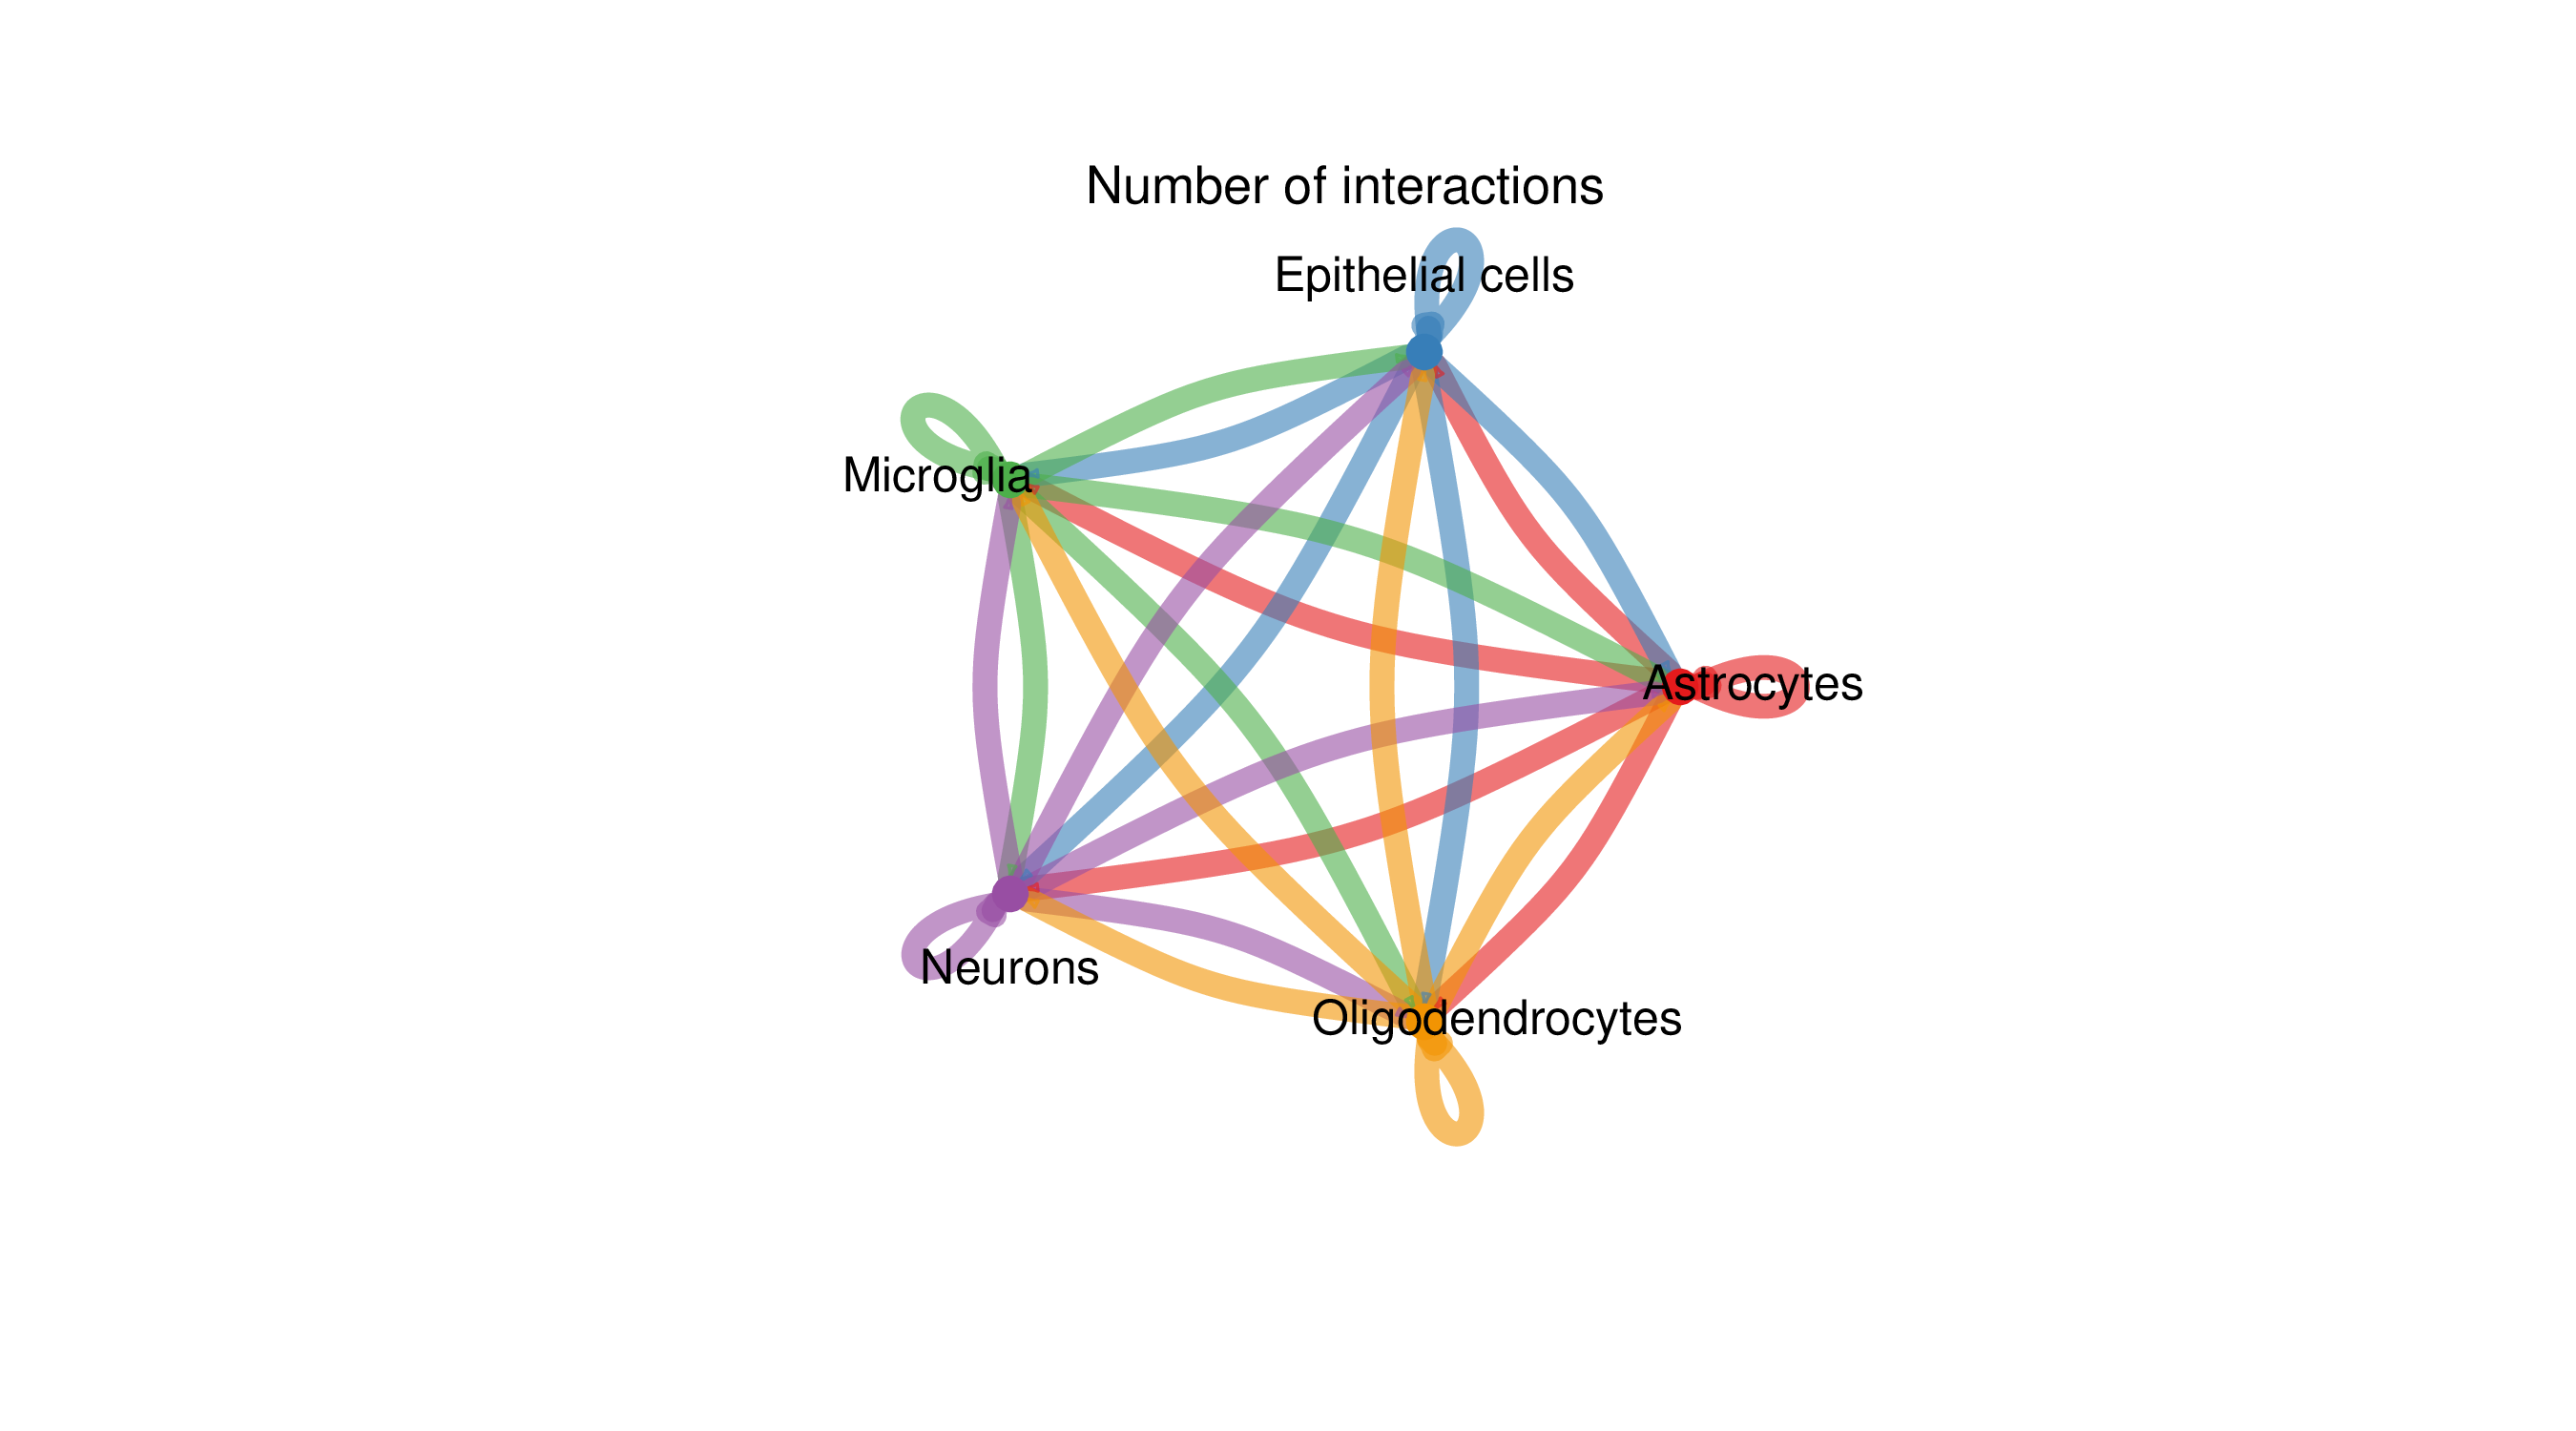
Chart Structure
- Circle: Different colors represent different cell types
- Connections: Represent ligand-receptor interactions between cell types
- Connection thickness: Proportional to the number or intensity of interactions
- Connection color: Consistent with the color of the ligand-expressing cell type
Interpretation Points
- Communication hubs: Cell types with dense connections may be communication hubs in tissues
- Interaction direction: Connections point from ligand-expressing cells to receptor-expressing cells
- Network topology: Overall observation of structural characteristics of the cell communication network
- Key nodes: Identify cell types that play key roles in the network
Microenvironment-specific Heatmap
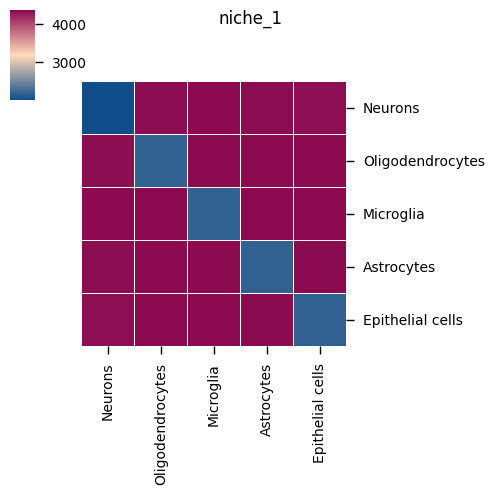
Chart Structure
- One chart per microenvironment: Shows specific ligand-receptor pairs in that microenvironment
- Rows: Ligand-receptor pairs
- Columns: Cell type pairs in the microenvironment
- Color: Average expression level or significance
Interpretation Points
- Microenvironment specificity: Identify cell communication active only in specific microenvironments
- Spatial heterogeneity: Compare differences in cell communication patterns between different microenvironments
- Functional regions: Understand functional characteristics of different spatial regions in combination with histological features
- Disease correlation: In disease samples, identify specific cell communication in lesion areas
Data Table Interpretation
means table (average expression level)
- Columns: Cell type pairs (format: cell type A | cell type B)
- Rows: Ligand-receptor pair names (format: ligand_receptor)
- Values: Average expression scores of the ligand-receptor pair in the cell type pair
- Interpretation: Larger values indicate higher expression levels of ligand and receptor in the corresponding cell types
pvalues table (significance p-values)
- Columns: Cell type pairs
- Rows: Ligand-receptor pairs
- Values: Statistical significance p-values (calculated through permutation tests)
- Interpretation: p<0.05 indicates that the interaction is significantly higher than random level
significant_means table (significant interactions)
- Only contains significant ligand-receptor pairs with p<0.05
- Most commonly used result file
- Can be directly used for downstream analysis and visualization
deconvoluted table (disassembled interactions)
- Disassembles multi-subunit complexes into individual genes
- interacting_pair: Ligand-receptor pair name
- partner A/B: Specific genes of ligand and receptor
- gene_a/b: Gene names
- Purpose: Understand which specific genes in the complex participate in the interaction
interaction_scores table (interaction scores)
- Contains scores for each ligand-receptor pair
- rank: Ranking based on specificity scores
- specificity: Cell type specificity score of the interaction
- Purpose: Identify the most specific cell communication
Result Quality Assessment
Indicators of Good Results
- ✓ Identifies a reasonable number of significant ligand-receptor pairs (usually dozens to hundreds)
- ✓ Interaction patterns conform to known biological knowledge
- ✓ Communication patterns between different microenvironments show obvious differences
- ✓ Important ligand-receptor pairs (such as VEGF-VEGFR, TNF-TNFR, etc.) are identified
Possible Problems and Solutions
Problem 1: Too few identified interactions
- Reasons: Poor data quality, insufficient cell numbers, unreasonable microenvironment definition
- Solution: Check data quality, increase cell numbers, adjust microenvironment definition
Problem 2: Too many identified interactions with high noise
- Reasons: Insufficient permutation times, improper threshold settings
- Solution: Increase permutation times (default 1000), use more stringent p-value thresholds (such as p<0.01)
Problem 3: Similar results across different microenvironments
- Reasons: Improper microenvironment definition, small differences in cell type composition
- Solution: Redefine microenvironments, ensure obvious differences in cell composition between microenvironments
Application Cases
Analysis of Temporal and Spatial Dynamics of Cell Communication in Human Endometrium
- Data Source: Garcia-Alonso L. et al. Nature Genetics 2021
- Background: The study developed CellPhoneDB v3.0, which integrated spatial transcriptomics data for the first time to analyze cell communication networks in endometrial microenvironments, revealing dynamic changes in cell communication during the menstrual cycle.
- Analysis Strategy: Using Visium spatial transcriptomics data, three spatial microenvironments (luminal, functional, and basal layers) were defined, and CellPhoneDB analysis was run in each microenvironment separately to identify spatially specific ligand-receptor interactions.
CellPhoneDB v3.0 Analysis Results
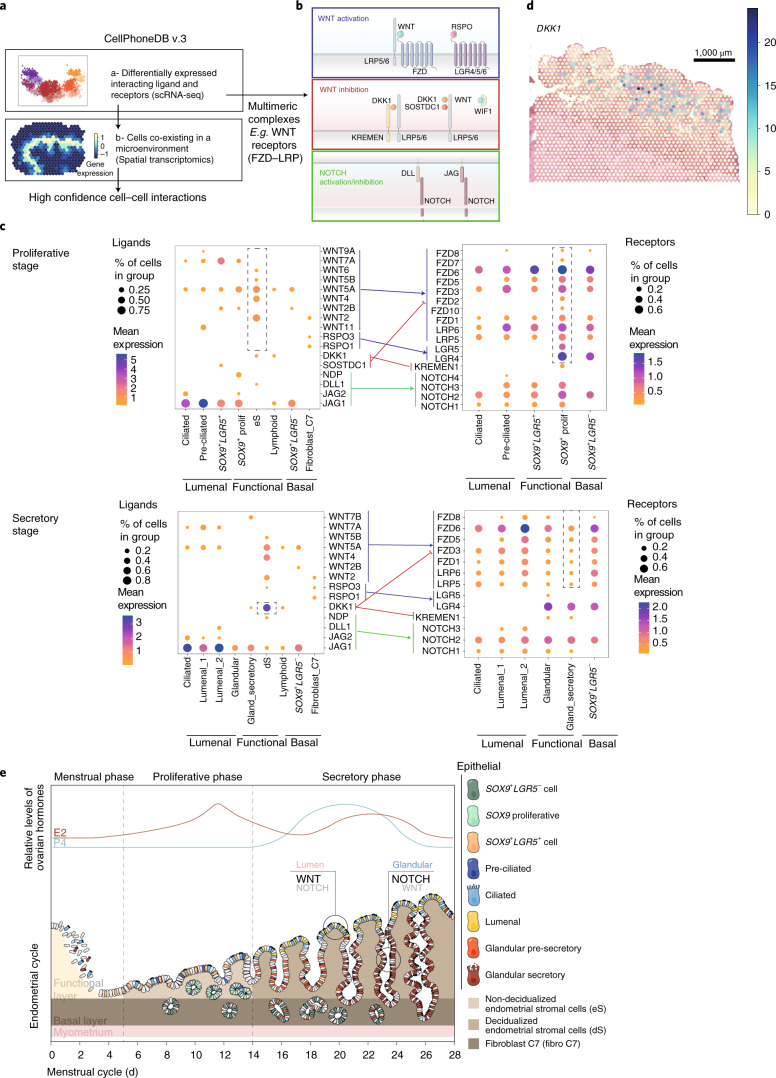
Figure 5: CellPhoneDB v3.0 analysis of ligand-receptor mediated epithelial differentiation. a. CellPhoneDB v3.0 analysis framework, integrating spatial cell colocalization information. b. Schematic diagram of receptors and ligands in WNT and NOTCH signaling pathways, showing multi-subunit complexes. c. Dot plot showing expression of relevant ligands in epithelial, stromal, and fibroblast populations and their cognate receptors in epithelial subpopulations, arrow colors correspond to signaling pathways. d. Spatial distribution estimation of DKK1 (WNT inhibitor) in early proliferative phase. e. Model of spatio-temporal distribution of epithelial and stromal subpopulations during menstrual cycle: proliferative phase is dominated by WNT environment to promote regeneration, spatial segregation of WNT and NOTCH signals in secretory phase promotes efficient differentiation towards ciliated and secretory lineages.
Core Findings
Spatial segregation pattern of WNT signaling pathway: WNT signaling shows obvious gradient distribution in the three microenvironments of luminal, functional, and basal layers. High expression of WNT ligands and receptors in the luminal microenvironment promotes ciliated epithelial differentiation, expression of WNT antagonists in the functional layer creates a low WNT microenvironment to promote secretory phenotype differentiation, and non-classical WNT ligands in the basal layer maintain stem cell pools.
Spatial specificity of NOTCH signaling pathway: Ligand JAG1 is mainly expressed by luminal epithelial cells, and receptor NOTCH2 expression is enhanced in functional layer glands, forming a spatial gradient. NOTCH signaling promotes differentiation of glandular epithelial cells into secretory cells.
Microenvironment-specific ligand-receptor interaction networks: Dozens of ligand-receptor pairs significantly enriched in specific microenvironments were identified, with epithelial-stromal communication mainly mediated through WNT, NOTCH, TGF-β, and EGF pathways. Spatial constraint analysis significantly reduced false positives.
Temporal and spatial regulation model of menstrual cycle: WNT signaling dominates the proliferative phase to promote tissue regeneration, and spatial segregation of WNT and NOTCH signals in the secretory phase achieves precise cell differentiation regulation. This model provides clues for understanding the pathogenesis of diseases such as endometrial cancer and endometriosis.
Notes and Best Practices
WARNING
Avoid overinterpretation: CellPhoneDB results are computational inferences based on ligand-receptor expression data, not equivalent to actual cell-cell interactions. Any key findings need to be confirmed by subsequent biological experiments (such as ligand-receptor colocalization, functional blocking experiments, etc.).
CAUTION
Data quality is crucial:
- Gene ID accuracy: Must use correct human gene symbols, case-sensitive
- Microenvironment definition: Rationality of microenvironment definition directly affects accuracy of spatial specificity analysis
- Cell type annotation: Incorrect cell type annotation leads to incorrect communication inferences
TIP
Optimizing analysis effects:
- Microenvironment optimization: Try different spatial clustering parameters, choose microenvironment definitions with clearest biological significance
- Literature validation: Combine known ligand-receptor interaction knowledge to validate results
- Multi-method cross-validation: Cross-validate results with other cell communication analysis tools (such as CellChat, NicheNet)
- TF integration: Provide transcription factor activity information to identify functional cell communication
NOTE
Database version:
- CellPhoneDB v5 database contains approximately 3,000 manually curated ligand-receptor pairs
- Database only contains human genes, other species need to use homologous gene conversion
- Database is regularly updated, it is recommended to use the latest version
Result Validation Strategies
Computational Validation
- Expression consistency: Check whether ligands and receptors are expressed in expected cell types
- Spatial consistency: Verify whether interacting cells are in the same microenvironment
- Statistical significance: Focus on interactions with p<0.05 and higher average expression levels
Literature Validation
- Known interactions: Consult literature to verify whether identified ligand-receptor pairs have literature support
- CellPhoneDB database: Check literature evidence and functional annotations in the database
- Signaling pathways: Confirm whether signaling pathways to which ligand-receptor pairs belong are known to be active in the tissue
Experimental Validation
- Ligand-receptor colocalization: Use immunofluorescence to verify spatial proximity of ligands and receptors
- Functional validation:
- Ligand stimulation experiments: Exogenously add ligands to observe responses of receptor-expressing cells
- Receptor blocking experiments: Use antibodies or small molecules to block receptors and observe functional changes
- Gene knockout/knockdown: Verify functional importance of ligands or receptors
Frequently Asked Questions (FAQ)
Q1: What are the differences between CellPhoneDB_spatial and CellChat_spatial?
A: The main differences are:
- Database: CellPhoneDB uses a manually curated ligand-receptor database (approximately 3,000 pairs), while CellChat uses an integrated database (more comprehensive but may contain low-confidence interactions)
- Algorithm: CellPhoneDB is based on permutation test statistical methods, while CellChat uses mass action law modeling
- Spatial integration: CellPhoneDB integrates spatial information through microenvironment files, while CellChat integrates through distance factors
- Output: CellPhoneDB focuses on identification of ligand-receptor pairs, while CellChat focuses on analysis of signaling pathways and cell roles
- Application scenarios: Both can be used complementarily to cross-validate results
Q2: Why is it necessary to define a microenvironment?
A: Importance of microenvironment definition:
- Biological relevance: Ensure that analyzed cell pairs are spatially adjacent to avoid false positives
- Spatial specificity: Identify specific cell communication patterns in different spatial regions
- Functional analysis: Understand cell interactions in different functional regions of tissues
- Disease research: In disease samples, distinguish communication differences between lesion and normal regions
Q3: How to select cell types 1 and 2?
A: Selection strategies:
- Comprehensive analysis: Select the same list for cell types 1 and 2 to analyze all possible cell type pairs
- Directional analysis: According to research questions, select specific ligand-expressing cells (type 1) and receptor-expressing cells (type 2)
- Example: To study how immune cells regulate epithelial cells, set immune cells as type 1 and epithelial cells as type 2
Q4: How to choose between statistical_analysis and degs_analysis?
A:
- statistical_analysis (recommended):
- Based on expression amount statistical testing
- No additional input required
- Suitable for most scenarios
- More comprehensive analysis
- degs_analysis:
- Analysis based on differentially expressed genes
- Requires providing a list of differentially expressed genes
- Focuses on cell type-specific communication
- Results are more conservative
Q5: Why are some known ligand-receptor pairs not identified in my results?
A: Possible reasons:
- Low expression: Expression levels of ligand or receptor are below detection threshold
- Not reaching significance: Although expressed, not reaching significance threshold through permutation test
- Not included in database: The ligand-receptor pair may not be included in the CellPhoneDB database
- Gene name mismatch: Gene name misspelling or use of non-standard gene symbols
- Species differences: Mouse genes may not have suitable human homologous genes
Q6: How to interpret p-values and mean values?
A:
- p-value: Calculated through permutation test, p<0.05 indicates that the interaction is significantly higher than random level
- mean value: Mean of average expression levels of ligand and receptor, reflecting interaction strength
- Comprehensive interpretation: Ideal interactions should be both significant (p<0.05) and have high expression levels (large mean value)
- Note: Significant p-value does not represent biological importance, needs to be comprehensively judged in combination with expression level and biological background
Q7: How are multi-subunit complexes handled?
A:
- Expression calculation: Take the minimum value of expression levels of all subunits
- Biological principle: Ensure that all components of the complex are expressed before considering functional expression of the complex
- Example: Integrin receptor ITGA5_ITGB1 requires both ITGA5 and ITGB1 to be expressed
- Result display: Individual gene information after disassembly can be seen in the deconvoluted table
Q8: What is the function of the transcription factor file?
A:
- Functional annotation: Mark ligand-receptor interactions with active downstream transcription factors
- Priority ranking: Help identify functional cell communication (not only expressed, but also downstream signal transduction active)
- Source: Can be obtained from transcription factor activity analysis tools such as SCENIC, pySCENIC, etc.
- Non-essential: This is an optional parameter, analysis can be completed without providing it
Q9: Which spatial technologies is CellPhoneDB suitable for?
A: CellPhoneDB_spatial is suitable for:
- Sequencing-based spatial transcriptomics: Visium, Slide-seq, HDST, etc.
- Imaging-based spatial transcriptomics: MERFISH, seqFISH, Xenium, etc.
- Single-cell spatial transcriptomics: STARmap, FISSEQ, etc.
- Key requirement: Requires cell type annotation and spatial microenvironment definition
Q10: How to cite CellPhoneDB?
A: Please cite the corresponding literature according to the version used:
- CellPhoneDB v5: Garcia-Alonso L. et al. Mapping the temporal and spatial dynamics of the human endometrium in vivo and in vitro. Nature Genetics (2021).
- Original CellPhoneDB literature: Efremova M. et al. CellPhoneDB: inferring cell-cell communication from combined expression of multi-subunit ligand-receptor complexes. Nature Protocols 15, 1484–1506 (2020).
References
Efremova M., Vento-Tormo M., Teichmann S.A., Vento-Tormo R. CellPhoneDB: inferring cell-cell communication from combined expression of multi-subunit ligand-receptor complexes. Nature Protocols 15, 1484–1506 (2020). doi: 10.1038/s41596-020-0292-x.
Garcia-Alonso L. et al. Mapping the temporal and spatial dynamics of the human endometrium in vivo and in vitro. Nature Genetics 53, 1698–1711 (2021). doi: 10.1038/s41588-021-00972-2.
Armingol E., Officer A., Harismendy O., Lewis N.E. Deciphering cell-cell interactions and communication from gene expression. Nature Reviews Genetics 22, 71–88 (2021). doi: 10.1038/s41576-020-00292-x.
Browaeys R., Saelens W., Saeys Y. NicheNet: modeling intercellular communication by linking ligands to target genes. Nature Methods 17, 159–162 (2020). doi: 10.1038/s41592-019-0667-5.
Jin S. et al. Inference and analysis of cell-cell communication using CellChat. Nature Communications 12, 1088 (2021). doi: 10.1038/s41467-021-21246-9.
Rao A., Barkley D., França G.S., Yanai I. Exploring tissue architecture using spatial transcriptomics. Nature 596, 211–220 (2021). doi: 10.1038/s41586-021-03634-9.