Single-cell scATAC-seq & scRNA-seq Dual-omics Advanced Analysis: epiAneuFinder Analysis
Introduction
TIP
epiAneuFinder is an algorithm used to detect Copy Number Variations (CNV) from single-cell ATAC (scATAC) data. Single-cell multi-omics data contains scATAC-seq information, and epiAneuFinder can be used to perform CNV analysis on scATAC-seq in multi-omics, revealing tumor cell heterogeneity.
In single-cell multi-omics research, scATAC-seq data not only provides information on chromatin open states but can also infer Copy Number Variations (CNV) by analyzing the number of reads mapped to genomic regions. epiAneuFinder uses the number of reads mapped to genomic regions in scATAC-seq data as a proxy indicator for DNA copy number in that region, capable of inferring the copy number state of each cell at single-cell resolution, revealing genomic differences and heterogeneity among different cells within tissues.
Core Functions of epiAneuFinder
Malignant Cell Identification Distinguish between malignant and non-malignant cells. Malignant cells usually show large-scale, non-random CNV patterns, while non-malignant cells (such as T cells, B cells) maintain a relatively normal diploid state.
Tumor Heterogeneity Resolution Identify subclonal populations with different CNV characteristics, revealing cellular heterogeneity within the tumor.
This document aims to provide a detailed technical guide for epiAneuFinder for single-cell multi-omics researchers, covering its basic principles, operation methods on the SeekSoul™ Online Cloud Platform, result interpretation, and FAQs, helping you quickly master and apply this tool.
Theoretical Basis of epiAneuFinder
Core Principle
The core idea of epiAneuFinder analysis is: Using the number of reads mapped to genomic regions in scATAC-seq data as a proxy indicator for DNA copy number in that region, infer the copy number variation of each cell through statistical model analysis of read counts in each window.
What is CNV
Copy Number Variation (CNV) refers to structural variations in the quantity of larger DNA fragments in the genome, mainly manifesting as amplification (gain) or deletion (loss) of chromosomal regions. Normally, human cells are diploid (usually 2 copies per autosome); when amplification occurs, the copy number exceeds 2, and when deletion occurs, the copy number is below 2.
CNV is an important driver of the occurrence and progression of various diseases such as tumors. Traditional CNV analysis is mainly based on Whole Genome Sequencing (WGS) or Whole Exome Sequencing (WES), which can only provide population-average information. Single-cell CNV analysis infers the copy number state of each cell at single-cell resolution, capable of revealing genomic differences and heterogeneity among different cells within tissues.
Two Directions of Single-cell Multi-omics CNV Analysis
There are two main directions for using single-cell multi-omics data for CNV analysis:
- Direction 1: Based on scRNA-seq data - Infer CNV using gene expression information, main tool is infercnv.
- Direction 2: Based on scATAC-seq data - Infer CNV using read counts, main tools include epiAneuFinder, AtaCNV, CopyscAT.
TIP
Introduction to Mainstream Single-cell ATAC-seq CNV Analysis Tools
Currently, tools commonly used for CNV detection in scATAC-seq data include: epiAneuFinder, CopyscAT, and AtaCNV. This guide focuses on the detailed usage of epiAneuFinder. If you need to use other tools, please refer to relevant documents for more information.
Key Algorithms and Workflow
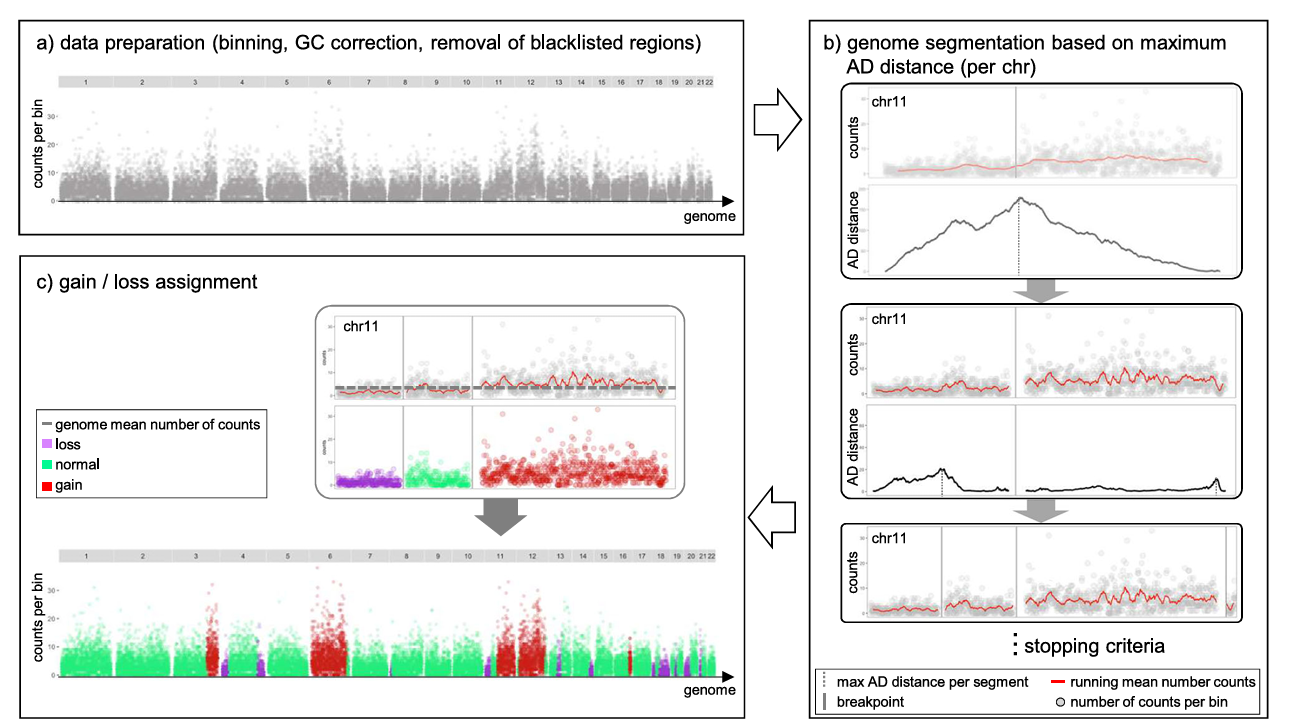
To overcome the inherent coverage sparsity of single-cell sequencing, epiAneuFinder adopts the following strategies:
- Data Filtering: Filter low-coverage cells to ensure subsequent analysis is based on high-quality single-cell data.
- Genomic Window Division: Divide the genome into equal-length windows (default window size is 100,000 base pairs) and quantify the number of mapped reads in each window.
- Blacklist Region Removal: Remove ENCODE blacklist regions—genomic sites with systematic mappability biases such as telomeric ends and repetitive regions—to avoid interfering with copy number inference.
- Low Coverage Window Filtering: For each dataset, epiAneuFinder also removes windows with excessive zero counts across all cells to exclude genomic regions that are generally poorly mappable in specific datasets.
By using different cancer scATAC-seq datasets, epiAneuFinder can identify intratumoral clonal heterogeneity within cell populations based on single-cell CNA profiles. Studies have proven that these CNA profiles are consistent with results inferred from single-cell whole genome sequencing data of the same samples.
Applicable Scenarios and Main Objectives
Suitable Sample Types:
- Tumor Tissue Samples (Strongly Recommended) - Contain a large number of CNV events, can reveal tumor heterogeneity and subclonal structure.
- Precancerous Lesions or Developmental Abnormalities - Can detect early genomic structural variations.
Unsuitable Sample Types:
- Normal Healthy Tissues - Most cells are diploid, lacking significant CNV events, CNV analysis has limited significance.
Cloud Platform Operation Guide
On the cloud platform, the epiAneuFinder analysis workflow is designed to be intuitive and easy to use. You do not need to write code; you can complete the analysis through the parameter configuration interface.
Preparation Before Analysis
TIP
The success of epiAneuFinder analysis largely depends on the quality of input data and sample type. Before starting the analysis, please ensure:
- Data Preprocessing Completed: Your single-cell ATAC data has undergone standard QC, dimensionality reduction, clustering, and cell type annotation.
- Appropriate Sample Type: epiAneuFinder is mainly suitable for tumor tissue samples; CNV analysis of normal healthy tissues has limited significance.
- Data Quality Requirements: Ensure fragment files align with cell barcodes and complete basic QC. Low-quality ATAC data will lead to inaccurate CNV detection.
Parameter Details
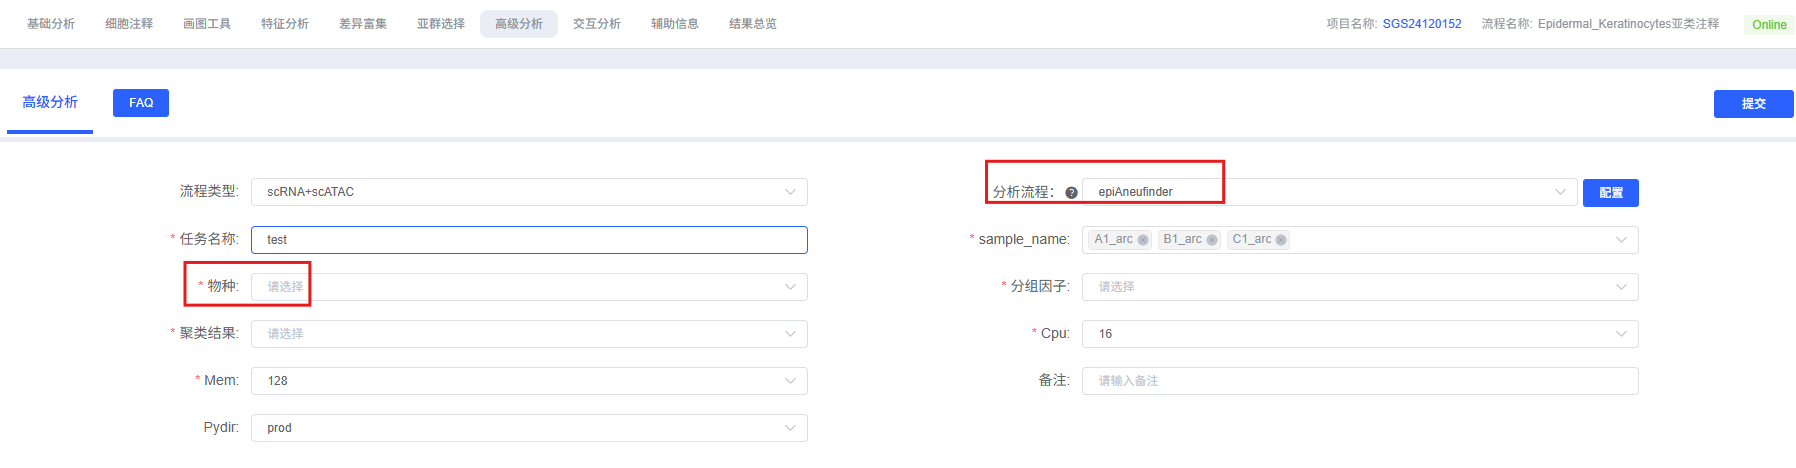
The table below details the main parameters and their descriptions for the epiAneuFinder analysis module on the cloud platform.
| Interface Parameter | Description |
|---|---|
| Task Name | Name of this analysis task, must start with an English letter. |
| sample_name | Sample names to be analyzed, multiple selection allowed, e.g., Tumor_1,Tumor_2. |
| Species | Select the species corresponding to your data. Supports human and mouse. |
| Group Factor | Multiple selection, select specific cell types to include in the analysis. This parameter is mainly used for row annotation in CNV heatmap visualization. |
| Clustering Result | Multiple selection, function same as Group Factor above, e.g., wknn_res.0.5_d30_l2_50. |
Important Notes
TIP
- Window Size Selection: The choice of window size needs to balance resolution and statistical power. Smaller windows (50kb) provide higher resolution but require higher sequencing depth; larger windows (200kb) are suitable for data with lower sequencing depth but reduce resolution. It is recommended to run with default window size first and then adjust based on result quality.
- Blacklist Regions: Strongly recommended to use ENCODE blacklist region files to exclude genomic sites with systematic mappability biases.
- Parameter Consistency: Once key parameters like window size are determined, they should be kept consistent across the entire data analysis to ensure result comparability.
- Sample Type: epiAneuFinder is mainly suitable for tumor tissue samples; CNV analysis of normal healthy tissues has limited significance.
Operation Workflow
- Enter Analysis Module: Navigate to the "Advanced Analysis" module on the cloud platform and select "epiAneuFinder".
- Create New Task: Name your analysis task and select the sample or project to be analyzed.
- Configure Parameters: Select the cell types, grouping information, window size, and other parameters according to the guide above.
- Submit Task: After confirming the parameters are correct, click the "Submit" button and wait for the analysis to complete.
- View Results: After the analysis is finished, view the generated analysis report and result files in the task list, including CNV heatmaps, copy number matrices, etc.
Results Interpretation
The analysis report of epiAneuFinder contains rich charts and data files. The following is a detailed interpretation of the core results.
Copy Number Variation Heatmap
The copy number variation heatmap is the core visualization result of CNV analysis, comprehensively displaying the copy number status of all cells across the entire genome:
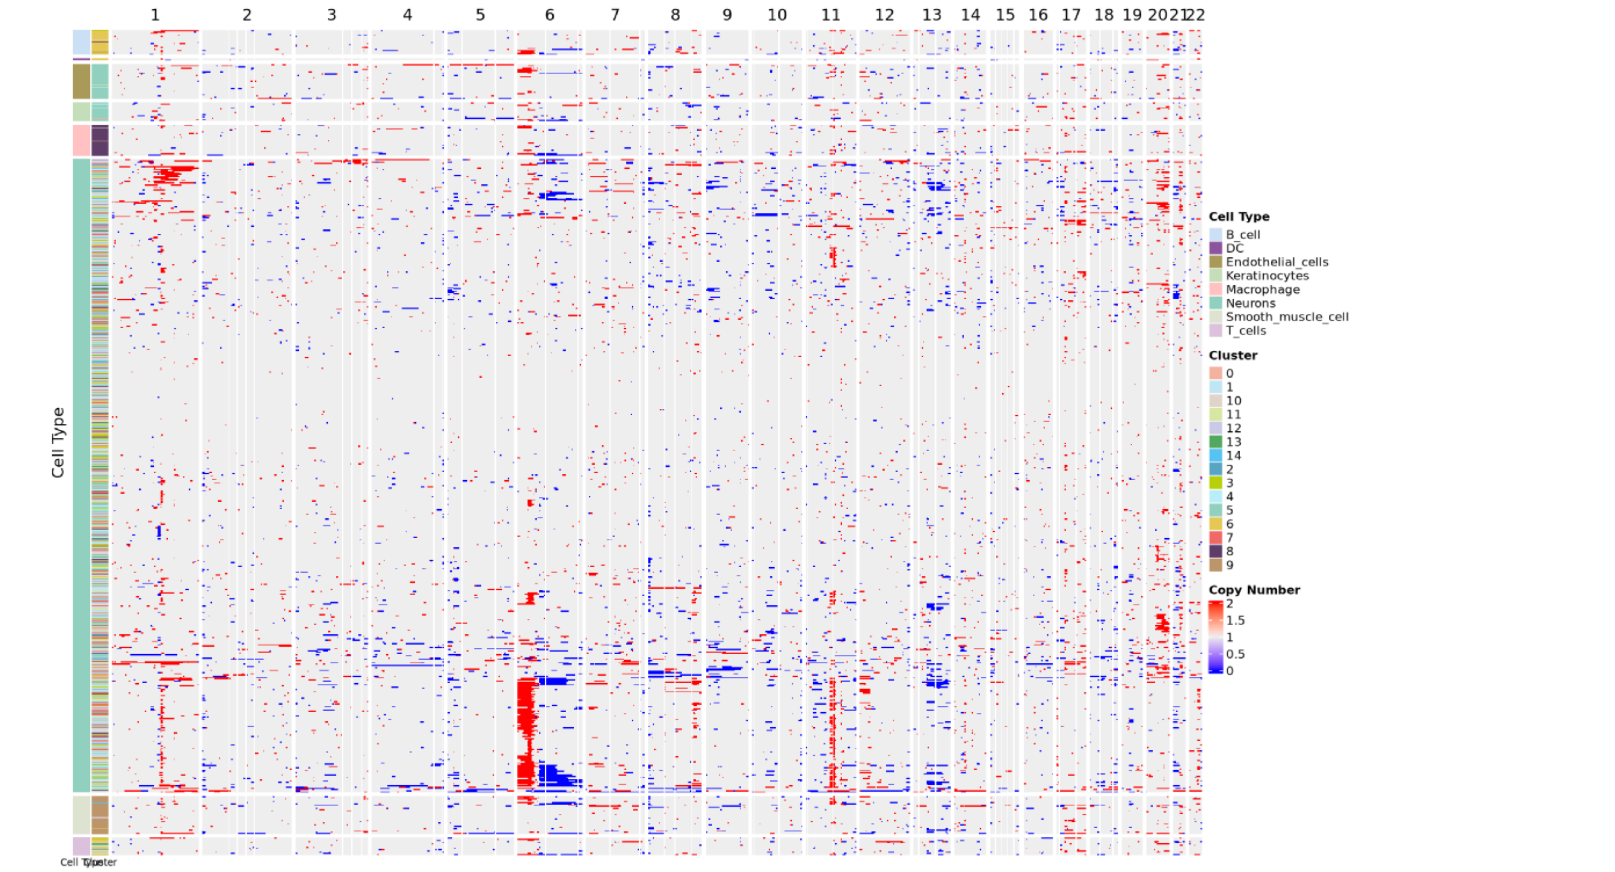
Chart Interpretation
Meaning of Rows and Columns:
- Each row represents a cell.
- Each column represents a chromosome arm, and the heatmap color indicates the CNV score.
- The order of columns corresponds to the linear arrangement of the genome from chromosome 1 to sex chromosomes (if retained).
Color Mapping:
- Copy number value near 2 indicates normal diploid state.
- Copy number between 1~2 indicates chromatin deletion; closer to 1 means more severe deletion.
- Copy number between 2~3 indicates chromatin amplification; closer to 3 means more severe amplification.
- Redder color indicates more severe amplification, bluer color indicates more severe deletion.
Cell Annotation:
- The color bar on the left side of the heatmap indicates the arrangement of cells according to cell type and cell clustering.
- The heatmap usually adds cell type annotation or cluster information on the row side to distinguish malignant and non-malignant cell groups.
- Malignant cells usually show obvious CNV patterns (large-scale amplification or deletion), while non-malignant cells (such as T cells, B cells) maintain a relatively normal diploid state.
Analysis Points
Identify Malignant Cells: By observing CNV patterns, malignant cells can be distinguished from non-malignant cells. Malignant cells usually show large-scale, non-random CNV patterns, while non-malignant cells maintain a relatively normal diploid state.
Resolve Tumor Heterogeneity: Different cell populations may exhibit different CNV characteristics, reflecting cellular heterogeneity and subclonal structures within the tumor.
Track Clonal Evolution: By comparing CNV pattern similarities of different cells, clonal evolutionary relationships of tumors can be inferred, helping to understand the tumor development process.
Result File List
| File Name | Content Description |
|---|---|
results_table.tsv | Core Data: Contains the copy number state of each cell in each genomic window. |
cnv_heatmap_annotated.pdf | Core Visualization: Copy number variation heatmap, displaying the copy number status of all cells across the entire genome. |
Notes
1. Importance of Sample Type: epiAneuFinder is mainly suitable for tumor tissue samples; CNV analysis of normal healthy tissues has limited significance. Please confirm if the sample type is suitable before performing CNV analysis.
2. Impact of Parameter Selection: The choice of parameters such as window size and filtering thresholds will significantly affect CNV detection results. It is recommended to run with default parameters first and then adjust appropriately based on result quality.
3. Use of Blacklist Regions: Strongly recommended to use ENCODE blacklist region files to exclude genomic sites with systematic mappability biases and avoid interfering with copy number inference.
4. Caution in Result Interpretation: CNV detection results need to be interpreted in combination with biological knowledge. Certain technical factors (such as sequencing depth, batch effects) may affect the accuracy of CNV detection.
5. Comparison with Other Tools: epiAneuFinder is a CNV detection tool designed specifically for scATAC-seq data. If your data contains scRNA-seq information, you can also consider using infercnv for CNV analysis; results from both methods can verify each other.
FAQ
Q1: How to choose suitable window size?
A: The choice of window size needs to balance resolution and statistical power:
- Smaller Window (50kb): Provides higher resolution but requires higher sequencing depth, noise may be larger.
- Default Window (100kb): Suitable for most cases, balancing resolution and statistical power.
- Larger Window (200kb or larger): Suitable for data with lower sequencing depth but reduces resolution.
- Suggestion: Can run with default window size first; if detected CNV events are too many or too few, adjust window size based on data characteristics.
Q2: How to interpret numerical values in copy number results?
A: In copy number inference results:
- Close to 2: Indicates normal copy number (diploid state), i.e., the region maintains normal copy number in the corresponding cell.
- Between 1~2: Indicates copy number deletion (loss), the copy number in that region in the corresponding cell is lower than normal; closer to 1 means more severe deletion.
- Between 2~3: Indicates copy number amplification (gain), the copy number in that region in the corresponding cell is higher than normal; closer to 3 means more severe amplification.
- These values reflect the copy number state of each cell in each genomic window and can be used to identify malignant cells and subclonal structures.
Q3: How to distinguish malignant cells from non-malignant cells?
A: Malignant cells can be distinguished from non-malignant cells by observing the CNV heatmap:
- Malignant Cells: Usually show large-scale, non-random CNV patterns, with obvious amplification (red) or deletion (blue) regions visible on the heatmap.
- Non-Malignant Cells: Usually maintain a relatively normal diploid state, showing near-neutral colors on the heatmap (copy number value close to 2).
- Suggestion to combine cell type annotation information to further confirm the identity of malignant cells.
References
- Schep, A. N., et al. "epiAneufinder: detecting copy number alterations in single-cell ATAC-seq data." Nature Methods 18.12 (2021): 1473-1481.