GSVA Analysis
Preface
TIP
GSVA (Gene Set Variation Analysis) is a powerful non-parametric, unsupervised enrichment analysis method. It transforms gene expression profiles into activity scores for gene sets (such as signaling pathways), thereby evaluating changes in biological pathways at the single-cell or sample level, and is particularly suitable for revealing functional heterogeneity between different cell subsets.
In single-cell transcriptomics research, we are not only concerned with the expression changes of individual genes, but also hope to understand the functional status of cells from a systemic perspective. Traditional enrichment analysis methods (such as GO/KEGG) typically rely on the screening of differentially expressed genes, which may overlook genes that have synergistic effects but do not show significant expression changes. GSVA makes up for this deficiency by treating each cell as an independent sample and calculating enrichment scores for each functional gene set based on expression information from all genes, thus being able to more comprehensively and sensitively capture dynamic changes in cell states.
This document aims to provide single-cell researchers with a detailed GSVA technical guide, covering its core principles, operation methods on the SeekSoul™ Online cloud platform, result interpretation, practical cases, and common questions, helping you quickly master and apply this tool for in-depth functional analysis.
GSVA Theoretical Foundation
Core Principles
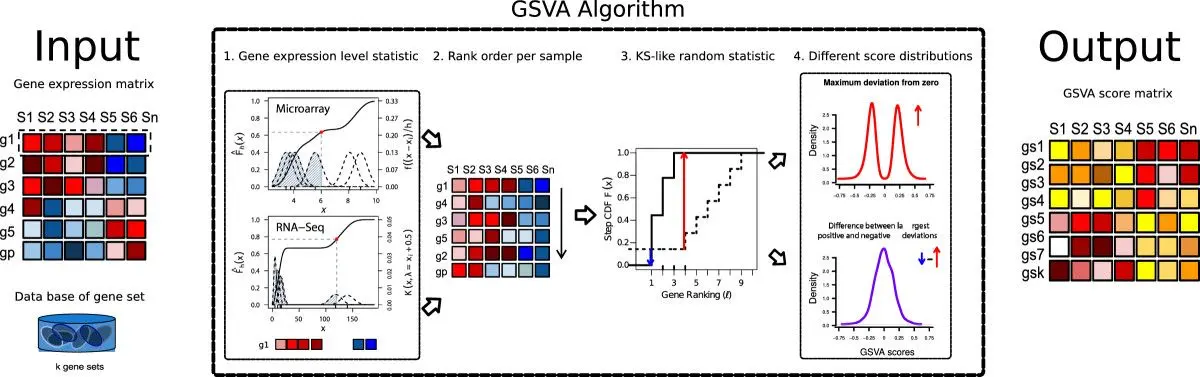
The core idea of GSVA is to transform a "gene-cell" expression matrix into a "gene set-cell" GSVA score matrix. This process does not rely on prior differential analysis, but directly scores each cell.
The algorithm flow can be summarized as:
- Gene Expression Sorting: For a single cell, the algorithm sorts genes from highest to lowest based on their expression levels.
- Enrichment Score Calculation: For a given gene set (for example, a KEGG pathway), the algorithm evaluates the distribution of genes in the gene set in the above sorted list. If genes in the gene set are significantly clustered at the top or bottom of the sorted list, a higher enrichment score is obtained. This process is similar to GSEA (Gene Set Enrichment Analysis), but GSVA is completed within a single sample (cell).
- Score Transformation: Through non-parametric kernel density estimation, the enrichment scores are transformed into final GSVA scores. These scores reflect the relative activity of the gene set in the cell.
TIP
Compared with classic GSEA (population-based enrichment analysis), the greatest advantage of GSVA is that it is a single-sample enrichment analysis method. It calculates a pathway activity score for each cell, thus raising functional analysis to single-cell resolution. This allows us to intuitively display the distribution of pathway activity on UMAP dimensionality reduction plots, or to quantitatively compare pathway activity between different cell subsets.
SeekSoul™ Online Operation Guide
On the SeekSoul™ Online platform, the GSVA analysis process is designed to be intuitive and easy to use. You do not need to write code, just complete the analysis through the parameter configuration interface.
Preparation Before Analysis
TIP
High-quality input data is the prerequisite for obtaining reliable GSVA results. Before starting the analysis, please make sure:
- Data has been preprocessed: Your single-cell data has undergone standard quality control, dimensionality reduction, clustering, and cell type annotation.
- Appropriate grouping has been selected: GSVA analysis aims to compare functional differences between different groups (such as different cell types, different treatment conditions). Please ensure that your metadata contains columns for grouping.
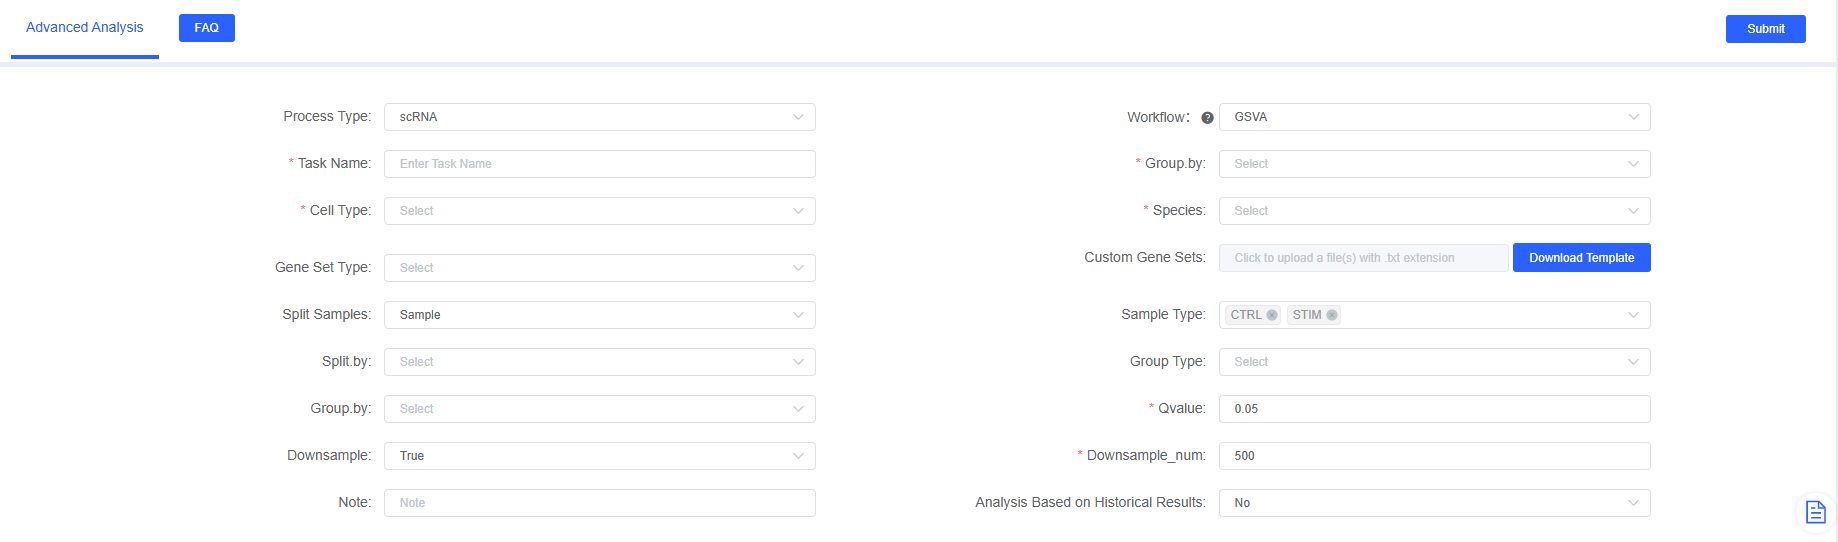
Parameter Details
The following table details the main parameters and their descriptions for the SeekSoul™ Online GSVA analysis module.
| Interface Parameter | Description |
|---|---|
| Task Name | The name of this analysis task, which must start with an English letter and can contain letters, numbers, underscores, and Chinese characters. |
| Group.by | Select labels used to define cell populations, such as celltype. |
| Cell Type | Multiple selection, select specific cell types or clusters to include in the analysis. |
| Species | Supports multiple species including human and mouse. |
| Gene Set Type | Multiple selection, pre-configured MSigDB gene sets on the platform. |
| Custom Gene Set | Upload custom gene set files (.txt). When uploading, Species must be selected as "user-defined". |
| Split Samples | Split label for plotting, usually select sample labels such as Sample. |
| Sample Type | Multiple selection, select samples to be analyzed. |
| Split.by | Split label for plotting, usually select group labels such as Group. |
| Group Type | Multiple selection, select groups to be analyzed. |
| Group.by | Multiple selection, select groups for differential pathway analysis. |
| Qvalue | q-value (FDR) threshold for differential pathway screening. |
| Downsample | Whether to randomly downsample large datasets to speed up analysis. |
| Downsample_num | If downsampling is enabled, the number of cells to retain in each cell subset. |
| Note | Custom remark information. |
| Analysis Based on Historical Results | Select "Gene Set Plotting" to re-filter gene sets for plotting based on completed analysis tasks. |
| Historical Task Name | Select a successful GSVA task. |
| Filter Gene Sets | Upload a list file containing only the names of gene sets you want to display. |
Important Notes
TIP
- Custom Gene Set Format: Uploaded gene set files (.txt) must use tabs as delimiters, not spaces.
- Heatmap Limitation: If the uploaded or filtered gene set contains only one pathway, the process will not be able to draw a heatmap.
Operation Flow
- Enter Analysis Module: Navigate to the "Advanced Analysis" module on the SeekSoul™ Online platform and select "GSVA".
- Create New Task: Name your analysis task and select samples or projects to analyze.
- Configure Parameters: According to the above guidelines, select grouping factors, cell types, species, gene set types, etc.
- Submit Task: After confirming the parameters are correct, click the "Submit" button and wait for the analysis to complete.
- Download and View: After the analysis is complete, download and view the generated analysis report and result files in the task list.
Result Interpretation
GSVA analysis reports provide charts and files to examine pathway activity from multiple dimensions.
GSVA Scores of Gene Sets Between Different Cell Groups
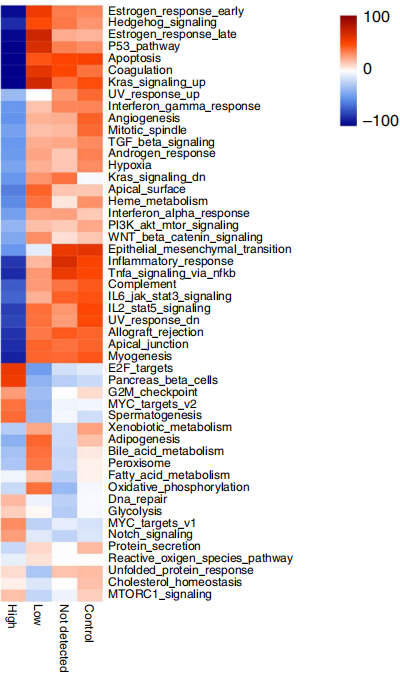
This is one of the most core results, showing the average GSVA scores of different cell groups on each gene set through a heatmap, which can quickly identify specific pathways with specifically high or low activity in certain cell groups.
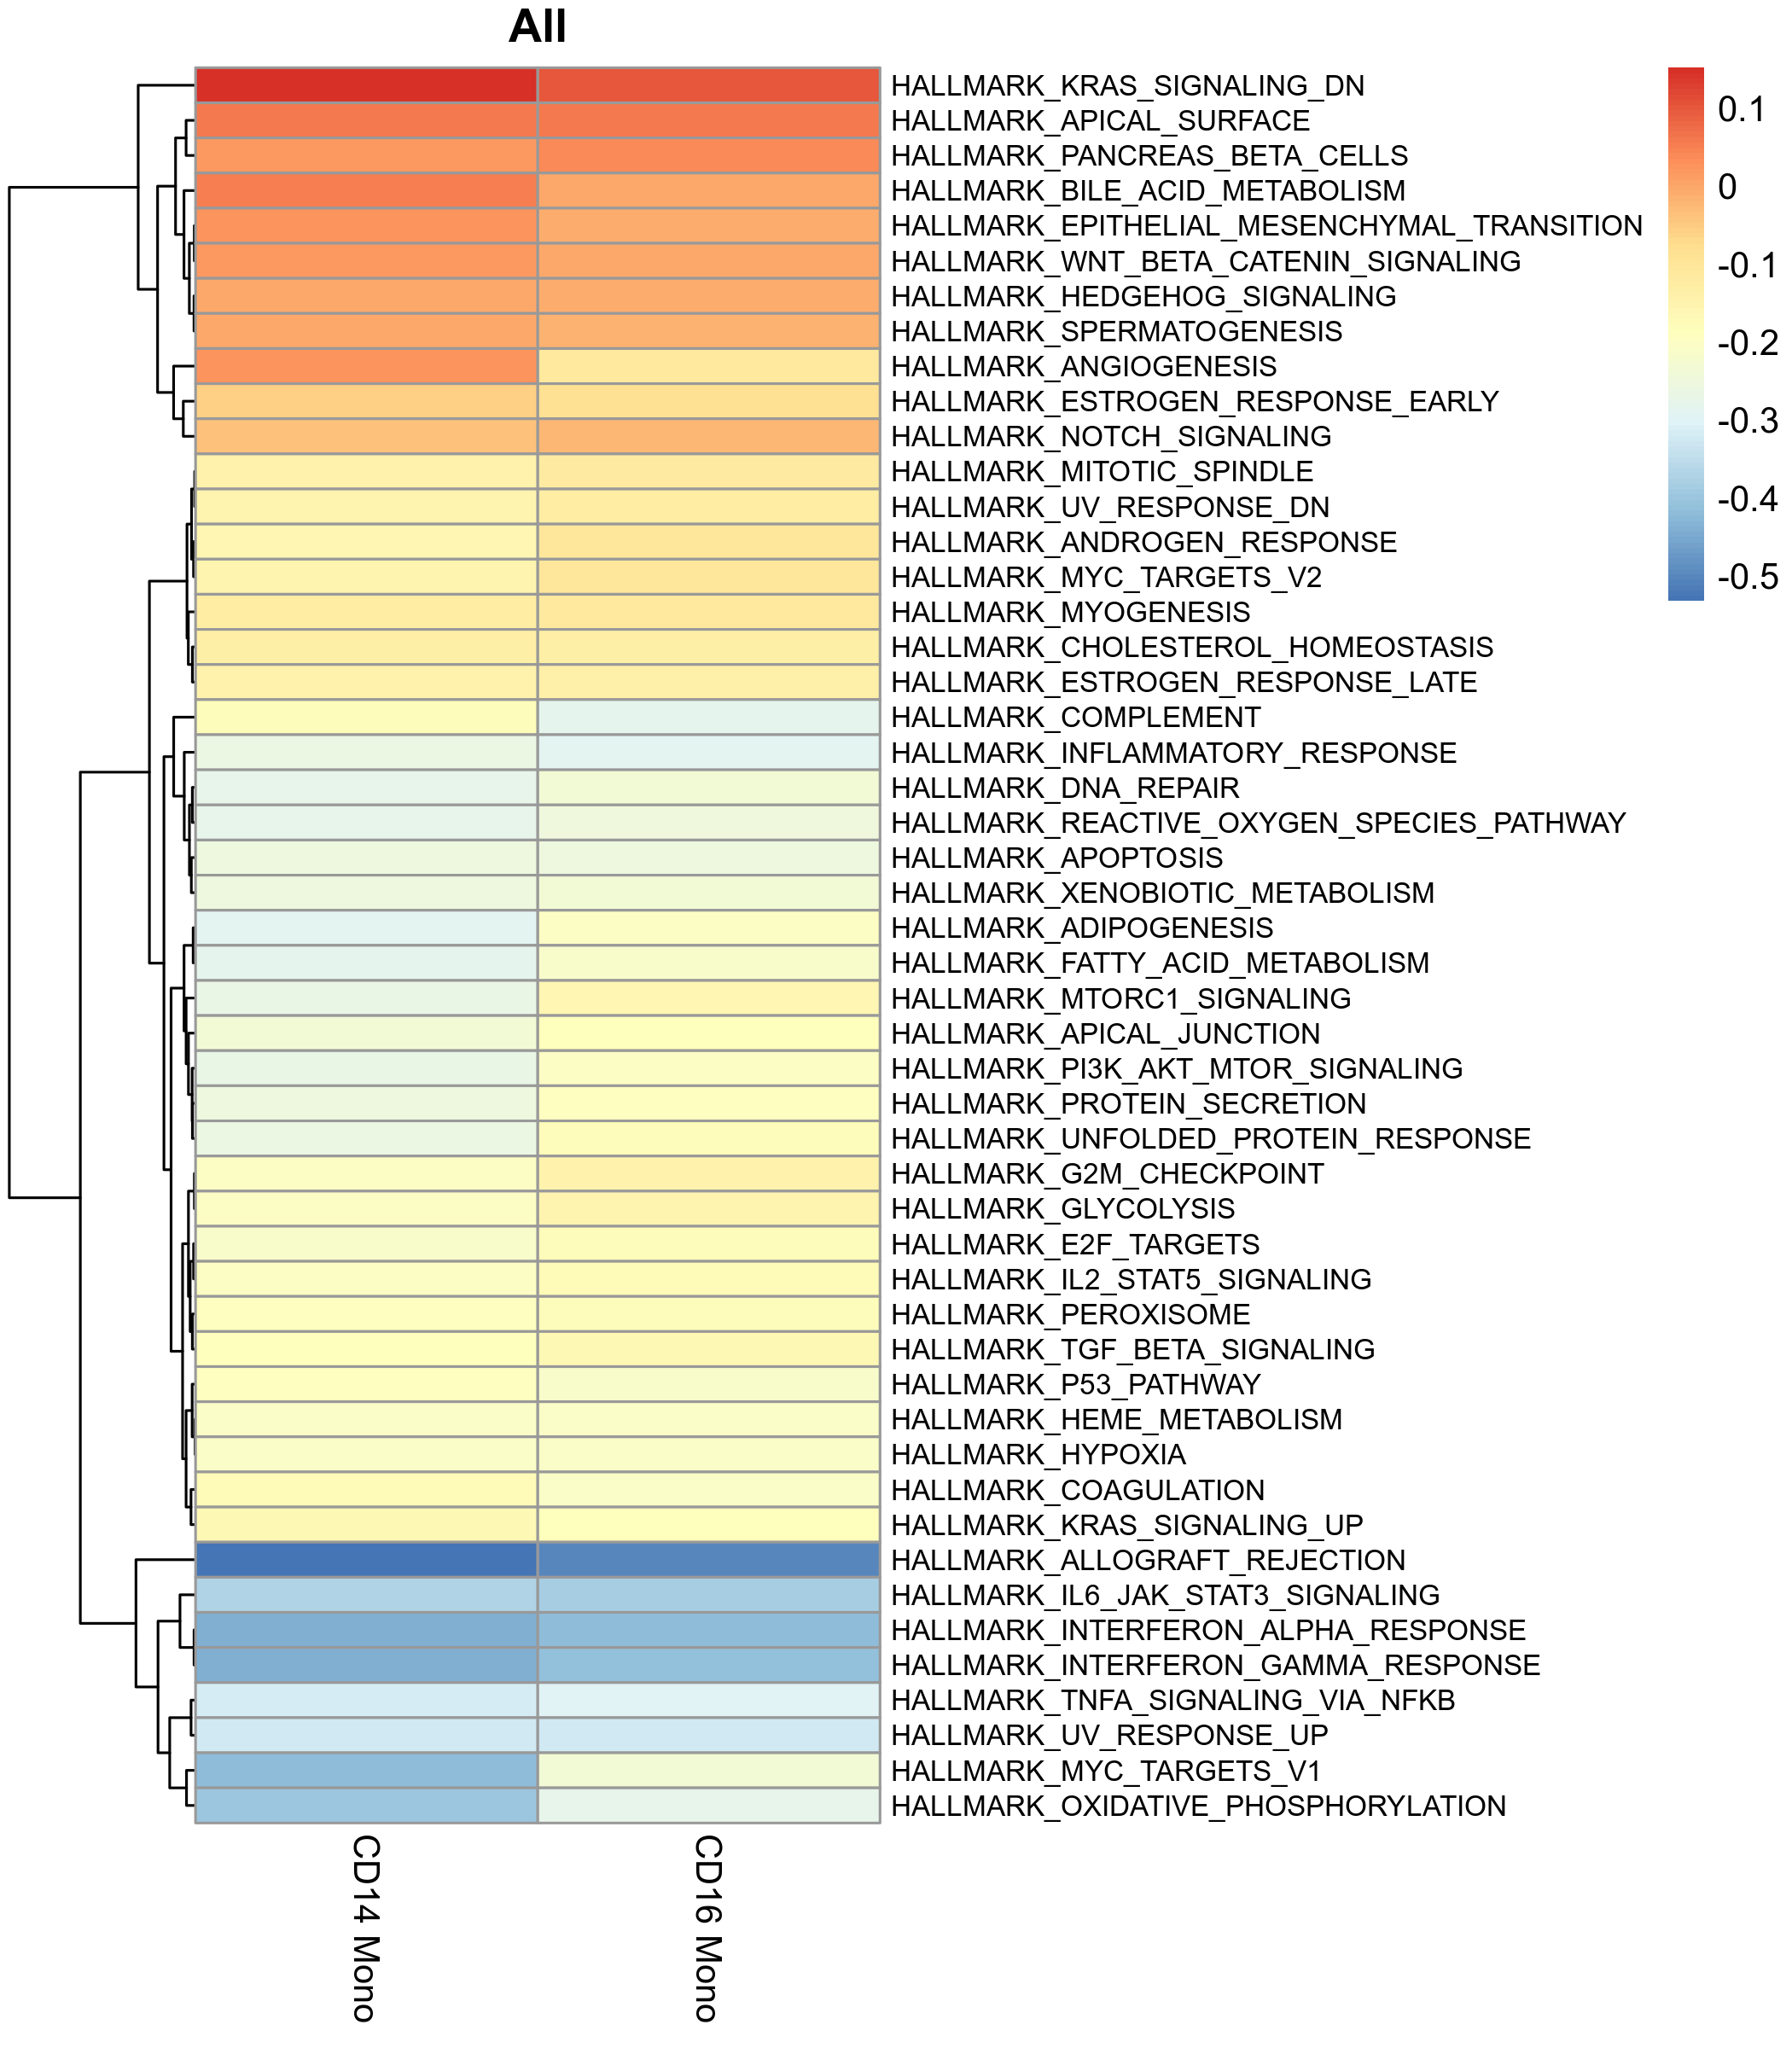
- Chart Interpretation:
- X-axis: Cell groups (such as different cell types).
- Y-axis: Gene sets (pathways).
- Color: Red represents high GSVA scores (high pathway activity), blue represents low GSVA scores (low pathway activity).
- Analysis Points:
- Look for pathways showing "bright red" bands in a certain cell group, as these are characteristic functions of that cell group.
- Compare the score differences of the same pathway between different cell groups to reveal functional heterogeneity.
GSVA Scores of Gene Sets in Single Cells
To observe the heterogeneity of pathway activity between cells in more detail, the report also provides a heatmap showing GSVA scores of single cells.
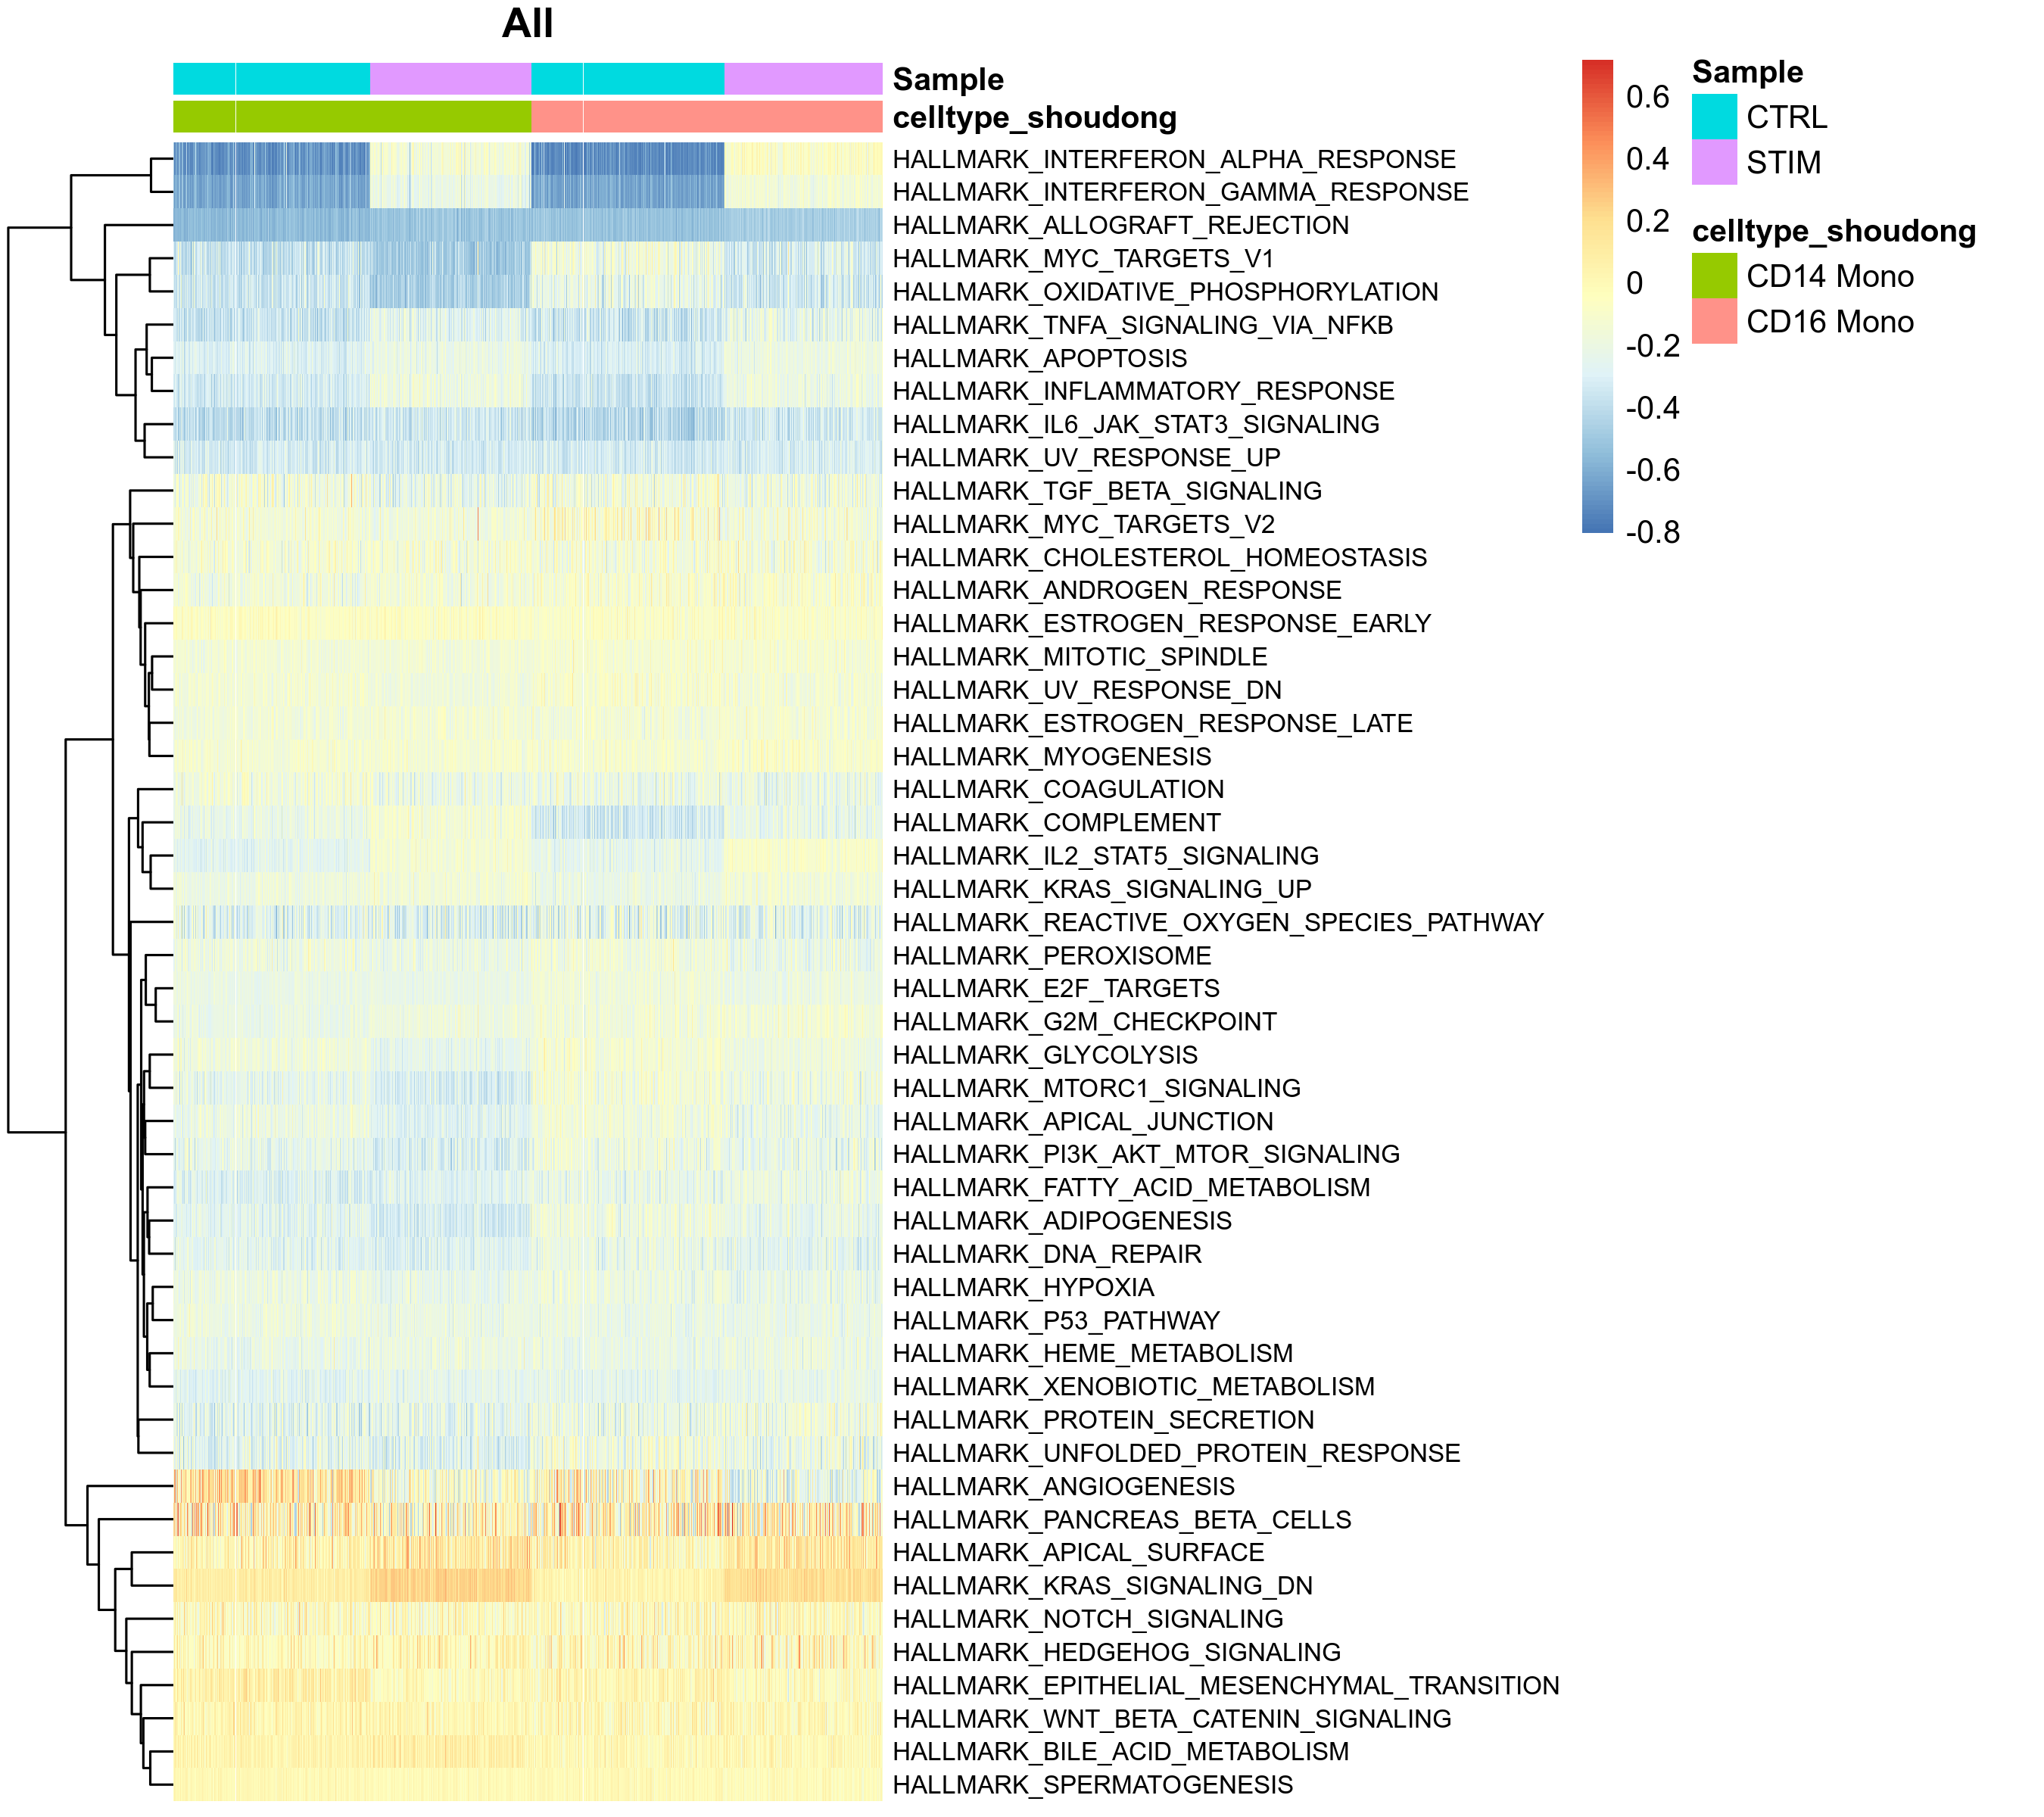
- Chart Interpretation:
- Columns: Represent individual cells, usually arranged by cell type or grouping.
- Rows: Represent gene sets (pathways).
- Analysis Points:
- Observe whether there is heterogeneity in pathway activity within the same cell group.
- Combined with UMAP plots, high/low GSVA score cell groups can be mapped to specific regions in the dimensionality reduction space.
Differentially Enriched Pathway Analysis
If "Group Comparison" is set, the platform will use the limma package to perform differential tests on GSVA scores between two groups, and display significantly different pathways through diverging bar plots (Diverging Bar Plot) and other forms.
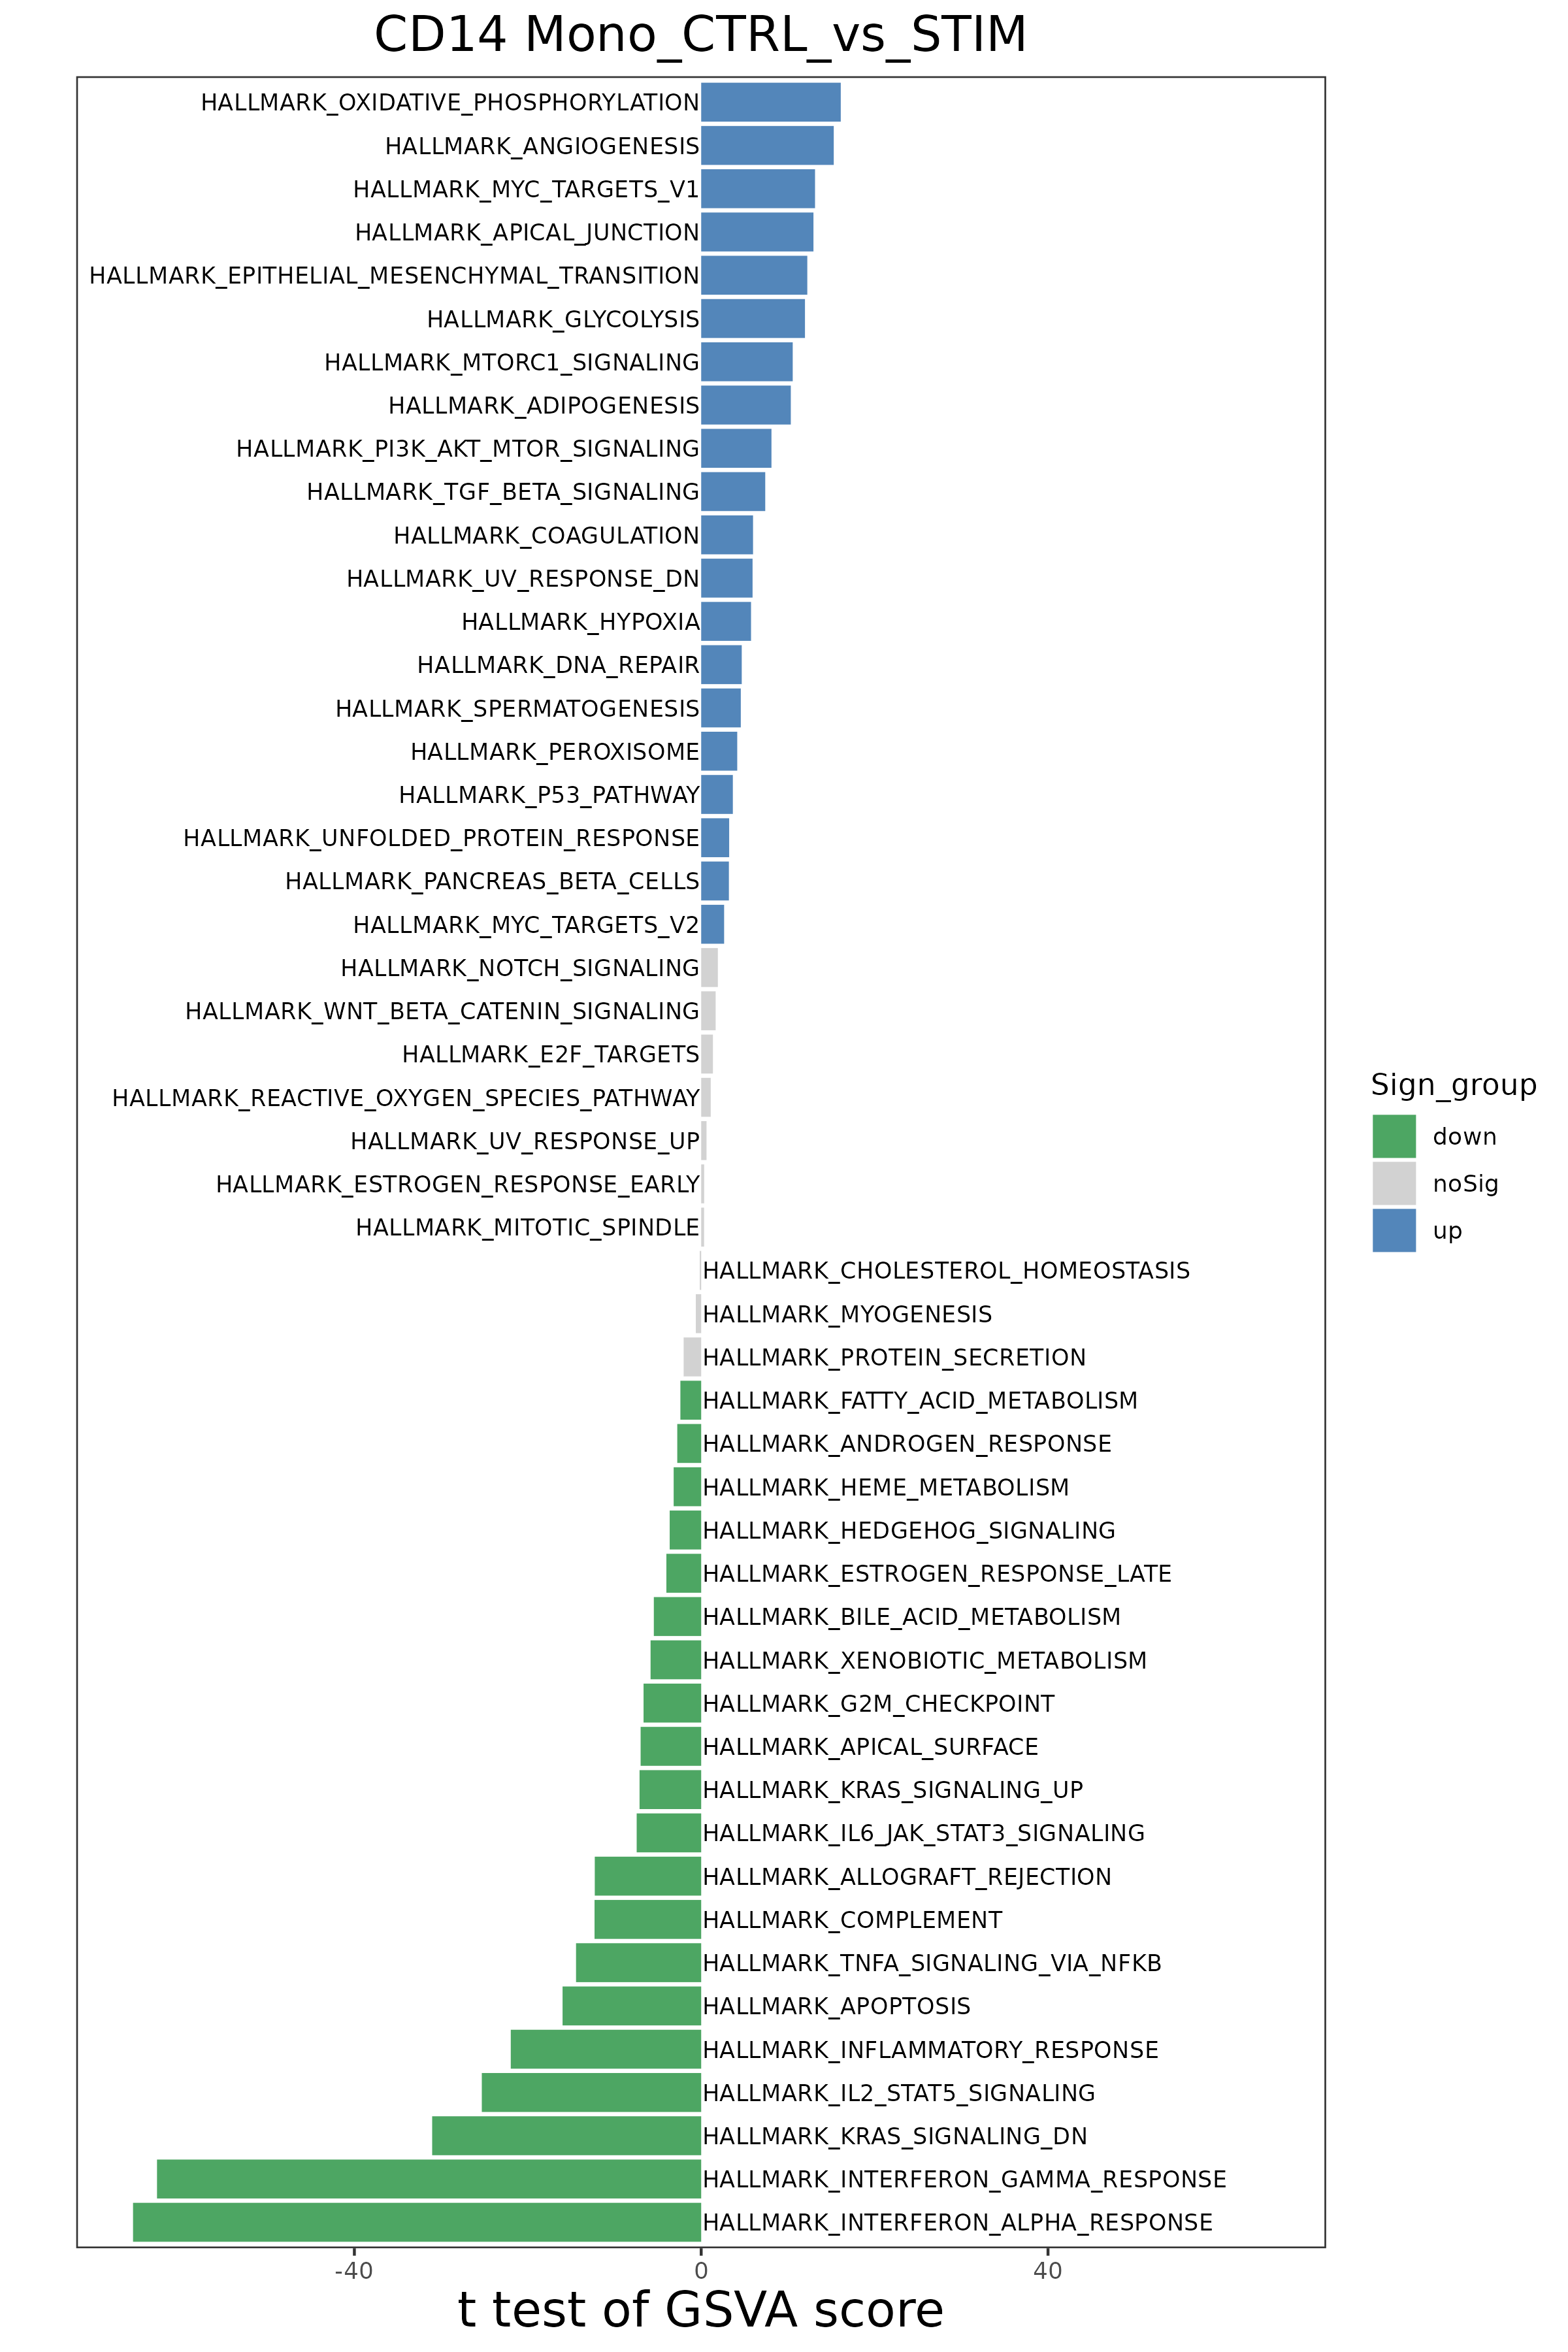
- Chart Interpretation:
- X-axis: t-value, reflecting the strength and direction of pathway differences between the two groups. A positive t-value means the pathway is upregulated in the comparison group; a negative t-value means it is downregulated.
- Y-axis: Gene set (pathway) names.
- Color: Usually, bright colors such as red or blue represent statistically significant differences (e.g., q-value < 0.05), and gray represents non-significant differences.
- Analysis Points:
- Quickly identify key biological pathways whose activity changes significantly under different conditions. For example, pathways with the largest and smallest t-values in the figure are the most significantly upregulated and downregulated pathways between the two groups, respectively.
Result File List
| File Name/Directory | Content Description |
|---|---|
*gsva_scores.csv | Core Data: Contains GSVA scores calculated by cell group or sample. |
*.png/pdf | Various GSVA score heatmaps. |
compare_Ttest/ | Differential Pathways: Statistical results and visualization charts of differential enrichment pathway analysis. |
split_cluster/ | Split Samples: GSVA analysis results after splitting samples. |
Application Cases
Case 1: Using Hallmark Gene Sets to Define Functional Characteristics of Tumor Subtypes
- Literature: Wu SZ, et al. Nat Genet. 2021.
- Background: Researchers hoped to subtype malignant epithelial cells in breast cancer based on copy number variations (CNV) and explore the functional characteristics of different subtypes.
- Analysis Strategy: After dividing cells into four groups: CNV-High, CNV-Low, Not detected, and Control, they used Hallmark gene sets from MSigDB to perform GSVA scoring on them.
- Core Findings: GSVA heatmaps clearly showed that CNV-High cells had significantly higher scores in pathways related to cell proliferation and cycle, such as "E2F signaling", "G2M checkpoint", and "MYC target genes", revealing a functional association between high CNV levels and malignant proliferation.
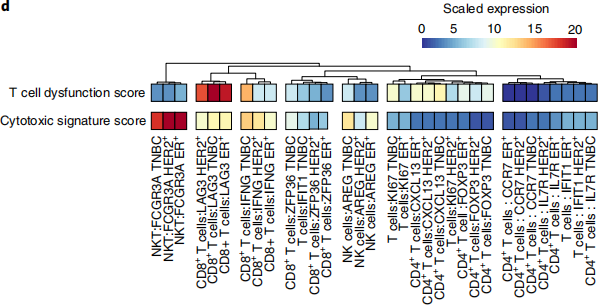
Case 2: Evaluating T Cell Functional Status Through Custom Gene Sets
- Literature: Kim, Ik Sun et al. Nature cell biology. 2019.
- Background: In the tumor immune microenvironment, the functional status of T cells (such as cytotoxicity, dysfunction) is crucial. Researchers hoped to quantitatively evaluate the function of different T cell subsets.
- Analysis Strategy: Researchers first divided T/NK cells into multiple subsets based on classical marker genes. Subsequently, they constructed two custom gene sets: "T cell dysfunction score" and "Cytotoxic signature score", and used GSVA to calculate scores for each subset.
- Core Findings: The results showed that exhausted T cells had the highest scores on the "dysfunction score" and lower scores on the "cytotoxicity score", which was highly consistent with known biological knowledge and provided precise evaluation indicators for subsequent immunotherapy research.
Frequently Asked Questions (FAQ)
Q1: What are the differences between GSVA, GSEA, and GO/KEGG enrichment analysis?
A: They are analysis tools at three different levels:
- GO/KEGG enrichment analysis: Based on differential gene lists, it answers the question "In which functions/pathways are these differential genes mainly enriched?" It relies on threshold screening of differential genes.
- GSEA: Based on the expression change ranking of all genes between two groups, it answers the question "Is a certain gene set more enriched in group A than in group B?" It is a group-to-group comparison.
- GSVA: Also based on all genes, but it calculates a gene set score for each sample/cell, answering the question "How active is a certain pathway in this cell/sample?" It raises functional analysis to single-sample/single-cell resolution.
Q2: How to choose an appropriate gene set (.txt file)?
A: The choice of gene set depends on your biological question:
- Exploratory analysis: It is recommended to use the Hallmark (h.all) gene set from MSigDB. It contains 50 well-defined biological states or processes with low information redundancy, and is the best choice for quickly understanding macroscopic functional changes.
- Metabolic research: You can choose KEGG or Reactome pathway gene sets, which contain detailed metabolic pathway information.
- Immunological research: You can choose the BP (Biological Process) part of GO (Gene Ontology) or specialized immune gene set databases (such as ImmPort).
- Validation analysis: If you have specific research goals (such as evaluating "ferroptosis" or "epithelial-mesenchymal transition"), you can construct custom gene sets by creating .txt files with core gene lists reported in relevant literature for analysis.
Q3: Are positive or negative GSVA scores better?
A: GSVA scores are relative values, and their absolute magnitude itself has no clear biological threshold. Their significance lies in comparison. For example, if cell group A has a higher GSVA score on the "apoptosis" pathway than cell group B, this indicates that the apoptosis pathway in A may be more active compared to B. Therefore, the focus of analysis should be on comparing score differences between different groups or cells, rather than obsessing over the positive or negative nature or absolute value of the scores.
References
- Hänzelmann, S., Castelo, R. & Guinney, J. GSVA: gene set variation analysis for microarray and RNA-Seq data. BMC Bioinformatics 14, 7 (2013).
- Kim, Ik Sun et al. "Immuno-subtyping of breast cancer reveals distinct myeloid cell profiles and immunotherapy resistance mechanisms." Nature cell biology vol. 21,9 (2019): 1113-1126.
- Chen Z, et al. Single-cell RNA sequencing highlights the role of inflammatory cancer-associated fibroblasts in bladder urothelial carcinoma. Nat Commun. 2020 Oct 8;11(1):5077.
- Wu SZ, et al. A single-cell and spatially resolved atlas of human breast cancers. Nat Genet. 2021 Sep;53(9):1334-1347.
- Lambrechts, et al. Phenotype molding of stromal cells in the lung tumor microenvironment. Nat Med 24, 1277–1289 (2018).