inferCNV Analysis
Preface
TIP
inferCNV is a mainstream bioinformatics tool in the field of single-cell transcriptomics used to infer copy number variations (CNV) in tumor cells. By analyzing gene expression data, it identifies potential amplification or deletion of chromosomal segments in individual cells or cell populations, effectively distinguishing tumor cells from normal cells and revealing intratumoral clonal heterogeneity.
In tumor research, genomic instability is one of the core characteristics, and CNV is an important cause of this instability. By analyzing CNV at the single-cell level, researchers can:
- Precisely identify malignant cells: Distinguish tumor cells with extensive CNVs from normal immune cells, stromal cells, etc., mixed in tumor tissues.
- Explore tumor heterogeneity: Identify tumor subclones with different CNV characteristics and understand the tumor evolution process.
- Correlate genotype and phenotype: Link specific CNV events with cellular functional states, drug resistance, and other phenotypes.
This document aims to provide researchers with a detailed technical guide for inferCNV, covering its basic principles, operation methods on the SeekSoul™ Online platform, result interpretation, and practical cases.
inferCNV Theoretical Basis
Core Principles
The core idea of inferCNV is: In a mixed cell population, if a group of genomically stable cells can be used as "normal" reference, then by comparing the gene expression levels of other cells, we can infer whether they have copy number changes in chromosomal segments.
It is based on a key assumption: the average expression level of genes in a specific chromosomal region is proportional to its copy number. If a region is amplified, the overall expression level of genes in that region will increase; conversely, if a deletion occurs, the overall level will decrease.
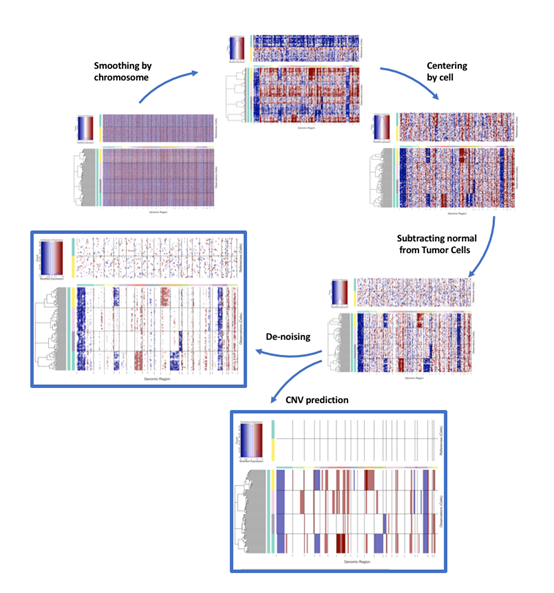
Analysis Process Overview
- Define cell groups: Divide cells into two groups: the "Observation" group to be analyzed and the "Reference" group as the benchmark. The reference group is usually known normal cells, such as T cells, B cells, or fibroblasts.
- Calculate relative expression: Calculate the log2(fold change) of each gene in each cell of the observation group relative to the average expression of the reference group.
- Smooth noise: To eliminate random fluctuations in individual gene expression, inferCNV smooths the relative expression values of genes along chromosomes using a moving window (e.g., 101 genes). This step effectively highlights persistent expression changes caused by large segment CNVs.
- Centralize and denoise: Centralize the data to bring the baseline back to 0. At the same time, specific algorithms can be applied to remove background noise.
- Result visualization: Finally, the CNV spectrum is displayed through a heatmap. The rows of the heatmap are cells, and the columns are genes sorted by chromosomal position. Red represents increased copy number, and blue represents decreased copy number.
SeekSoul™ Online Operation Guide
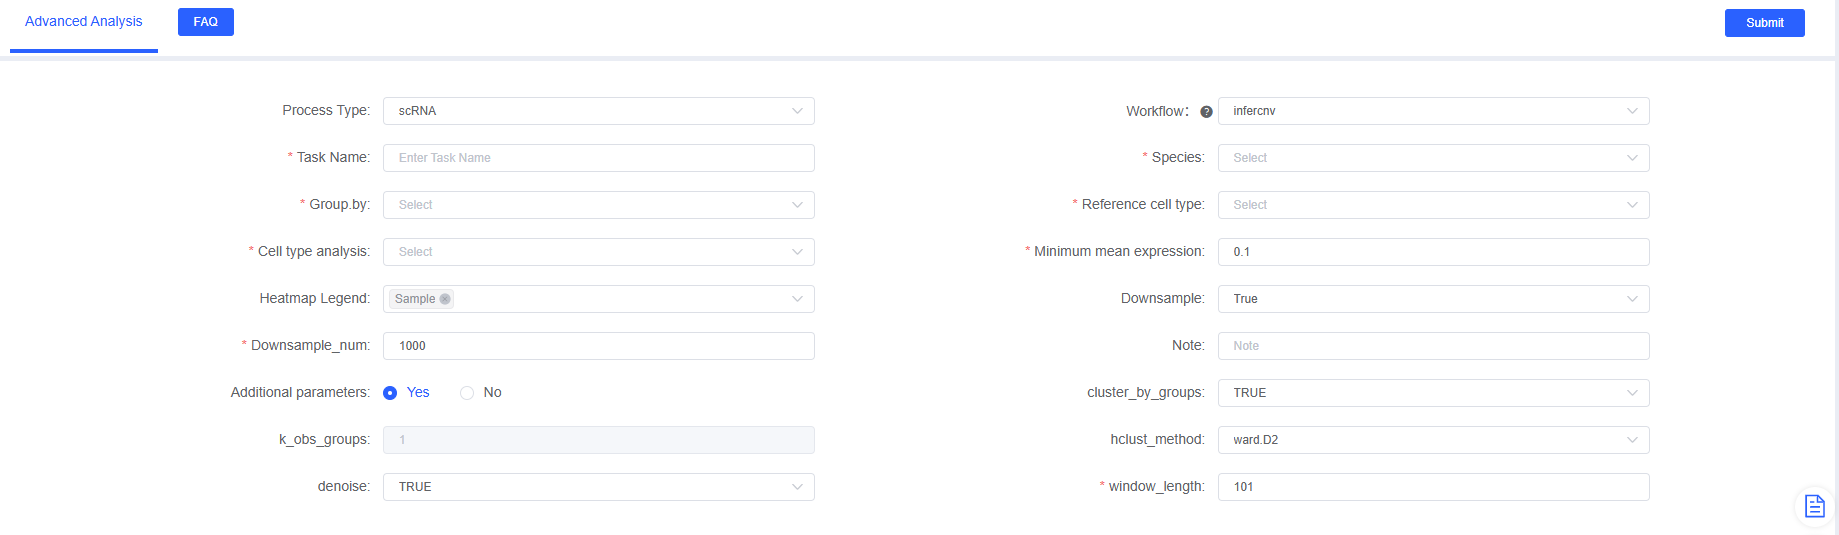
On the SeekSoul™ Online platform, the inferCNV analysis process is designed to be intuitive and easy to use, requiring no coding.
Parameter Details
| Interface Parameter | Description |
|---|---|
| Task Name | The name of this analysis task, must start with an English letter, and can include English letters, numbers, underscores, and Chinese characters. |
| Species | Select the species name corresponding to the analysis flow data, currently supporting human, mouse, and rat. |
| Group.by | Select the label corresponding to the cell type or cluster to be analyzed. For example, if you want to analyze annotated cell types, select the corresponding label (such as CellAnnotation) and use it with the "Reference/Analysis Cell Types" below. |
| Reference cell type | (Core parameter) Multiple selection, select the cell type as the normal reference, usually immune cells or epithelial cells of normal tissues. All levels in the grouping factor can be selected. |
| Cell type analysis | (Core parameter) Multiple selection, select the cell type to be analyzed, usually epithelial cells of cancerous tissues. All levels in the grouping factor except reference cell types can be selected. |
| Minimum mean expression | Threshold for the average expression of genes, range is (0,1], default is 0.1. |
| Heatmap Legend | Add grouping annotations to the heatmap according to the selected label. |
| Downsample | Whether to downsample cells (extract some cells) for analysis. |
| Downsample_num | If downsampling is enabled, set the number of cells to extract here. |
| Note | Custom remark information. |
| Additional Parameters | Whether to modify the default advanced parameters, default is not to modify. |
| cluster_by_groups | When k_obs_groups is FALSE, you can customize the final clustering number of analysis cell types here. |
| k_obs_groups | When TRUE is selected, each analysis cell type is clustered separately first, and then total hierarchical clustering is performed. When FALSE is selected, all analysis cell types are clustered as a whole. |
| hclust_method | Method for cell hierarchical clustering, including ward.D, ward.D2 (default), single, complete, etc. |
| denoise | Whether to perform denoising processing, default is enabled. |
| window_length | The size of the gene expression smoothing window (number of genes), needs to be an odd number. |
TIP
The selection of reference cells is crucial. Incorrectly selecting tumor cells as references or mixing cells carrying CNVs into the reference set will seriously affect the accuracy of results. It is usually recommended to select cells from different germ layers than tumor cells as references (for example, for epithelial-derived tumors, select immune cells or stromal cells).
Operation Process
- Enter analysis module: Navigate to the "Advanced Analysis" module on SeekSoul™ Online and select "infercnv".
- Create a new task: Name your analysis task and select the sample or project to analyze.
- Configure parameters: According to the above guidelines, select the cell type to be analyzed, grouping information, etc.
- Submit task: After confirming that the parameters are correct, click the "Submit" button and wait for the analysis to complete.
- Download and view: After the analysis is completed, download and view the generated analysis report and result files in the task list.
Result Interpretation
The inferCNV analysis report contains rich charts and data files. Here is a detailed interpretation of the core results.
CNV Distribution Overview Heatmap
This is the most core and intuitive result, showing the CNV patterns of all cells across the entire genome.
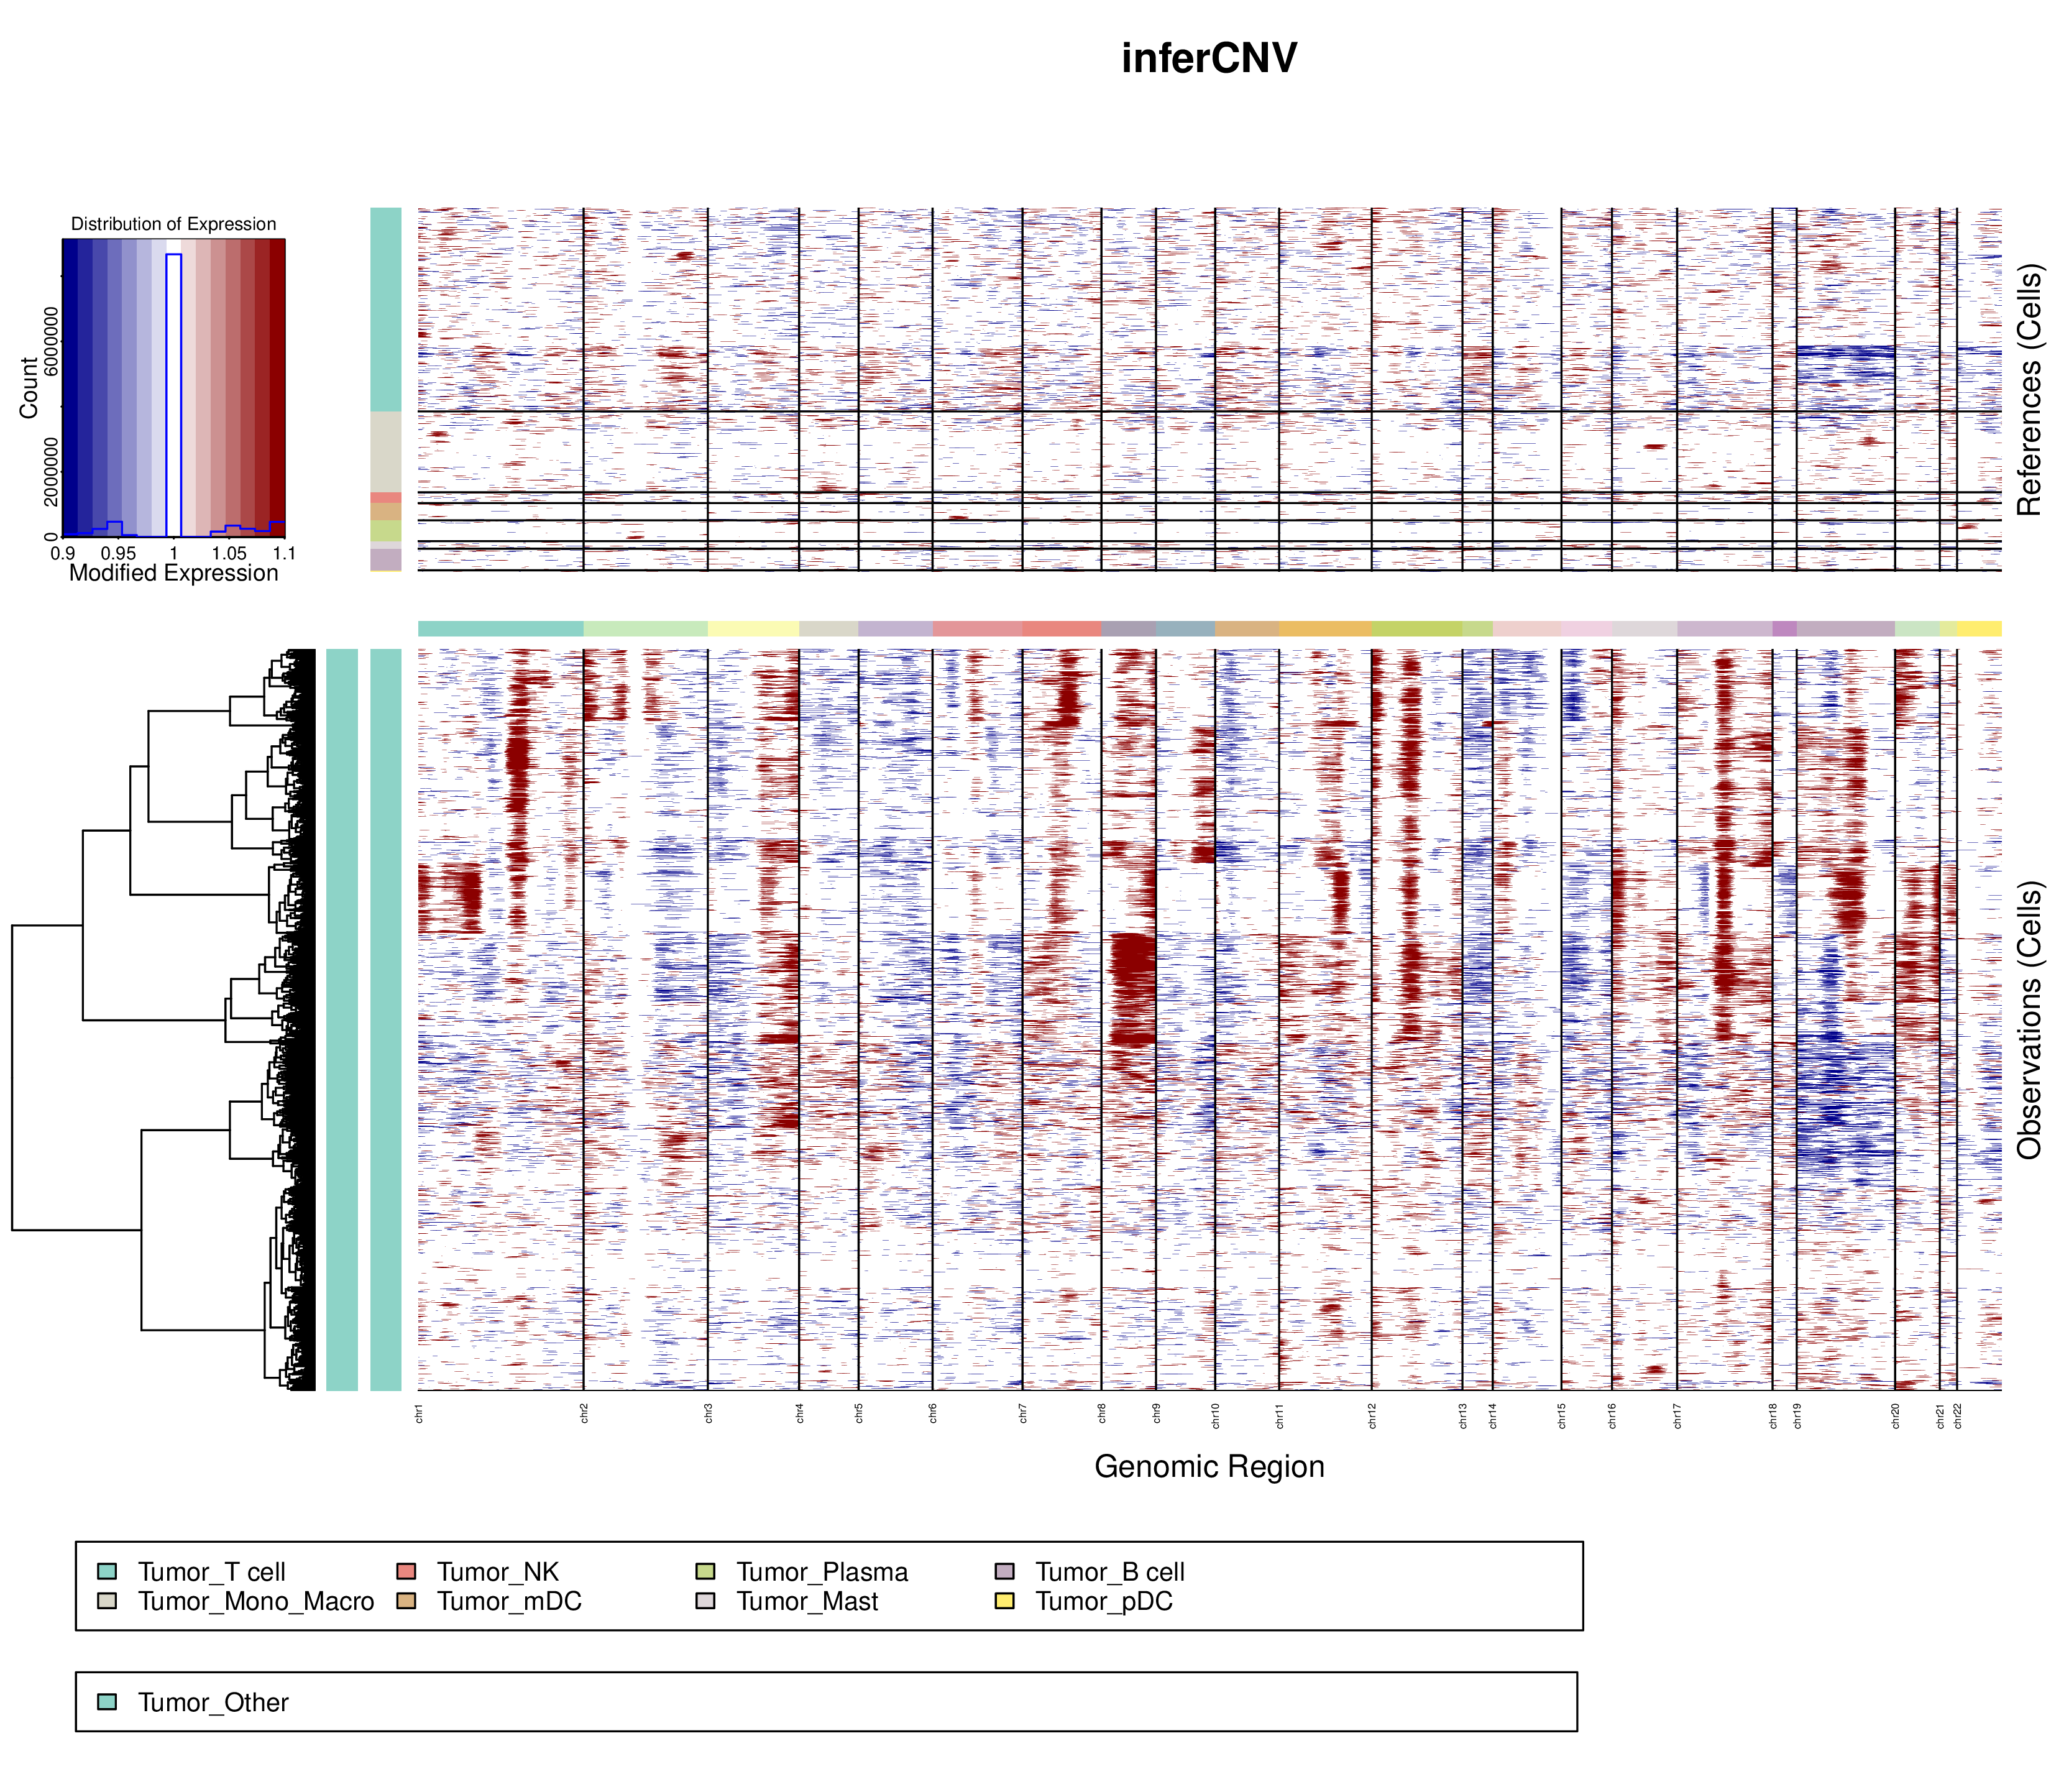
- Chart Interpretation:
- Rows: Represent individual cells, usually clustered according to cell type or CNV pattern.
- Columns: Represent genes sorted by chromosomal position (from chromosome 1 to X/Y).
- Colors: Red indicates upregulated gene expression relative to reference cells, inferred as increased copy number; blue indicates downregulated gene expression, inferred as decreased copy number.
- Upper and lower partitions: The heatmap is usually divided into upper and lower parts, with the upper part being reference cells (Reference) and the lower part being cells to be analyzed (Observation).
- Analysis Points:
- Observe whether the reference cell area is basically neutral in color, which indicates that the reference cells are properly selected.
- Observe whether there are large segments of continuous red or blue areas in the cells to be analyzed, these are the inferred CNV events.
- Compare the CNV patterns of different cells or cell groups to identify tumor subclones with different genomic variation characteristics.
CNV Heatmap by Cell Type/Group
This chart focuses more on the cells to be analyzed and displays them grouped by pre-annotated cell types.
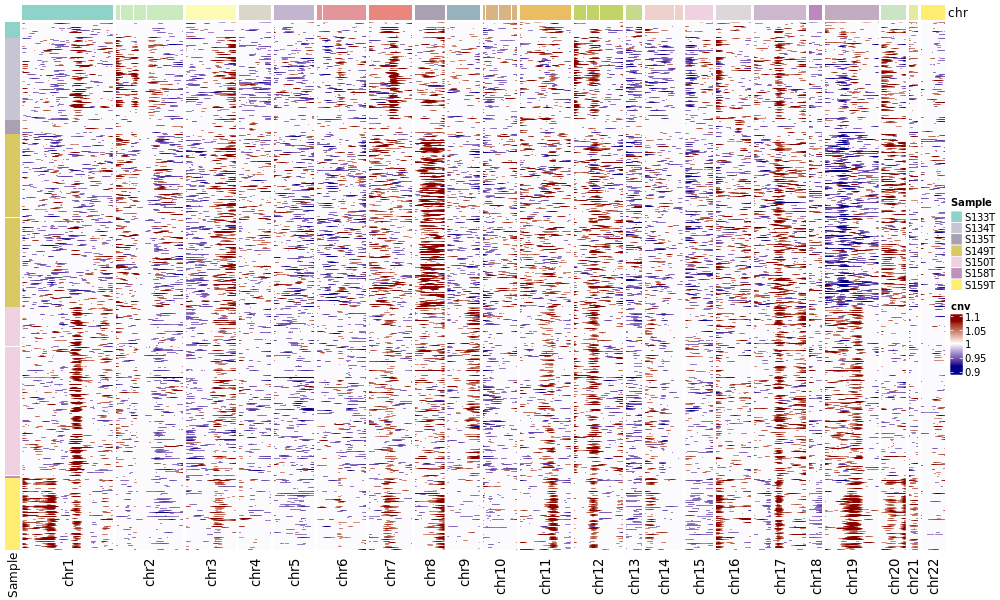
- Chart Interpretation: This chart only displays the cells to be analyzed (Observation), and sorts and color-marks the cells (rows) according to the cell type annotations you provide.
- Analysis Points:
- Confirm whether CNV events are mainly enriched in the expected tumor cell types.
- Evaluate intratumoral heterogeneity. For example, whether certain tumor cell subpopulations carry specific CNV events that other subpopulations do not have.
CNV Score
To quantify the CNV level of each cell, inferCNV calculates a CNV Score, which reflects the overall strength of CNV signals in the cell genome.
CNV Score Dimension Reduction Plot
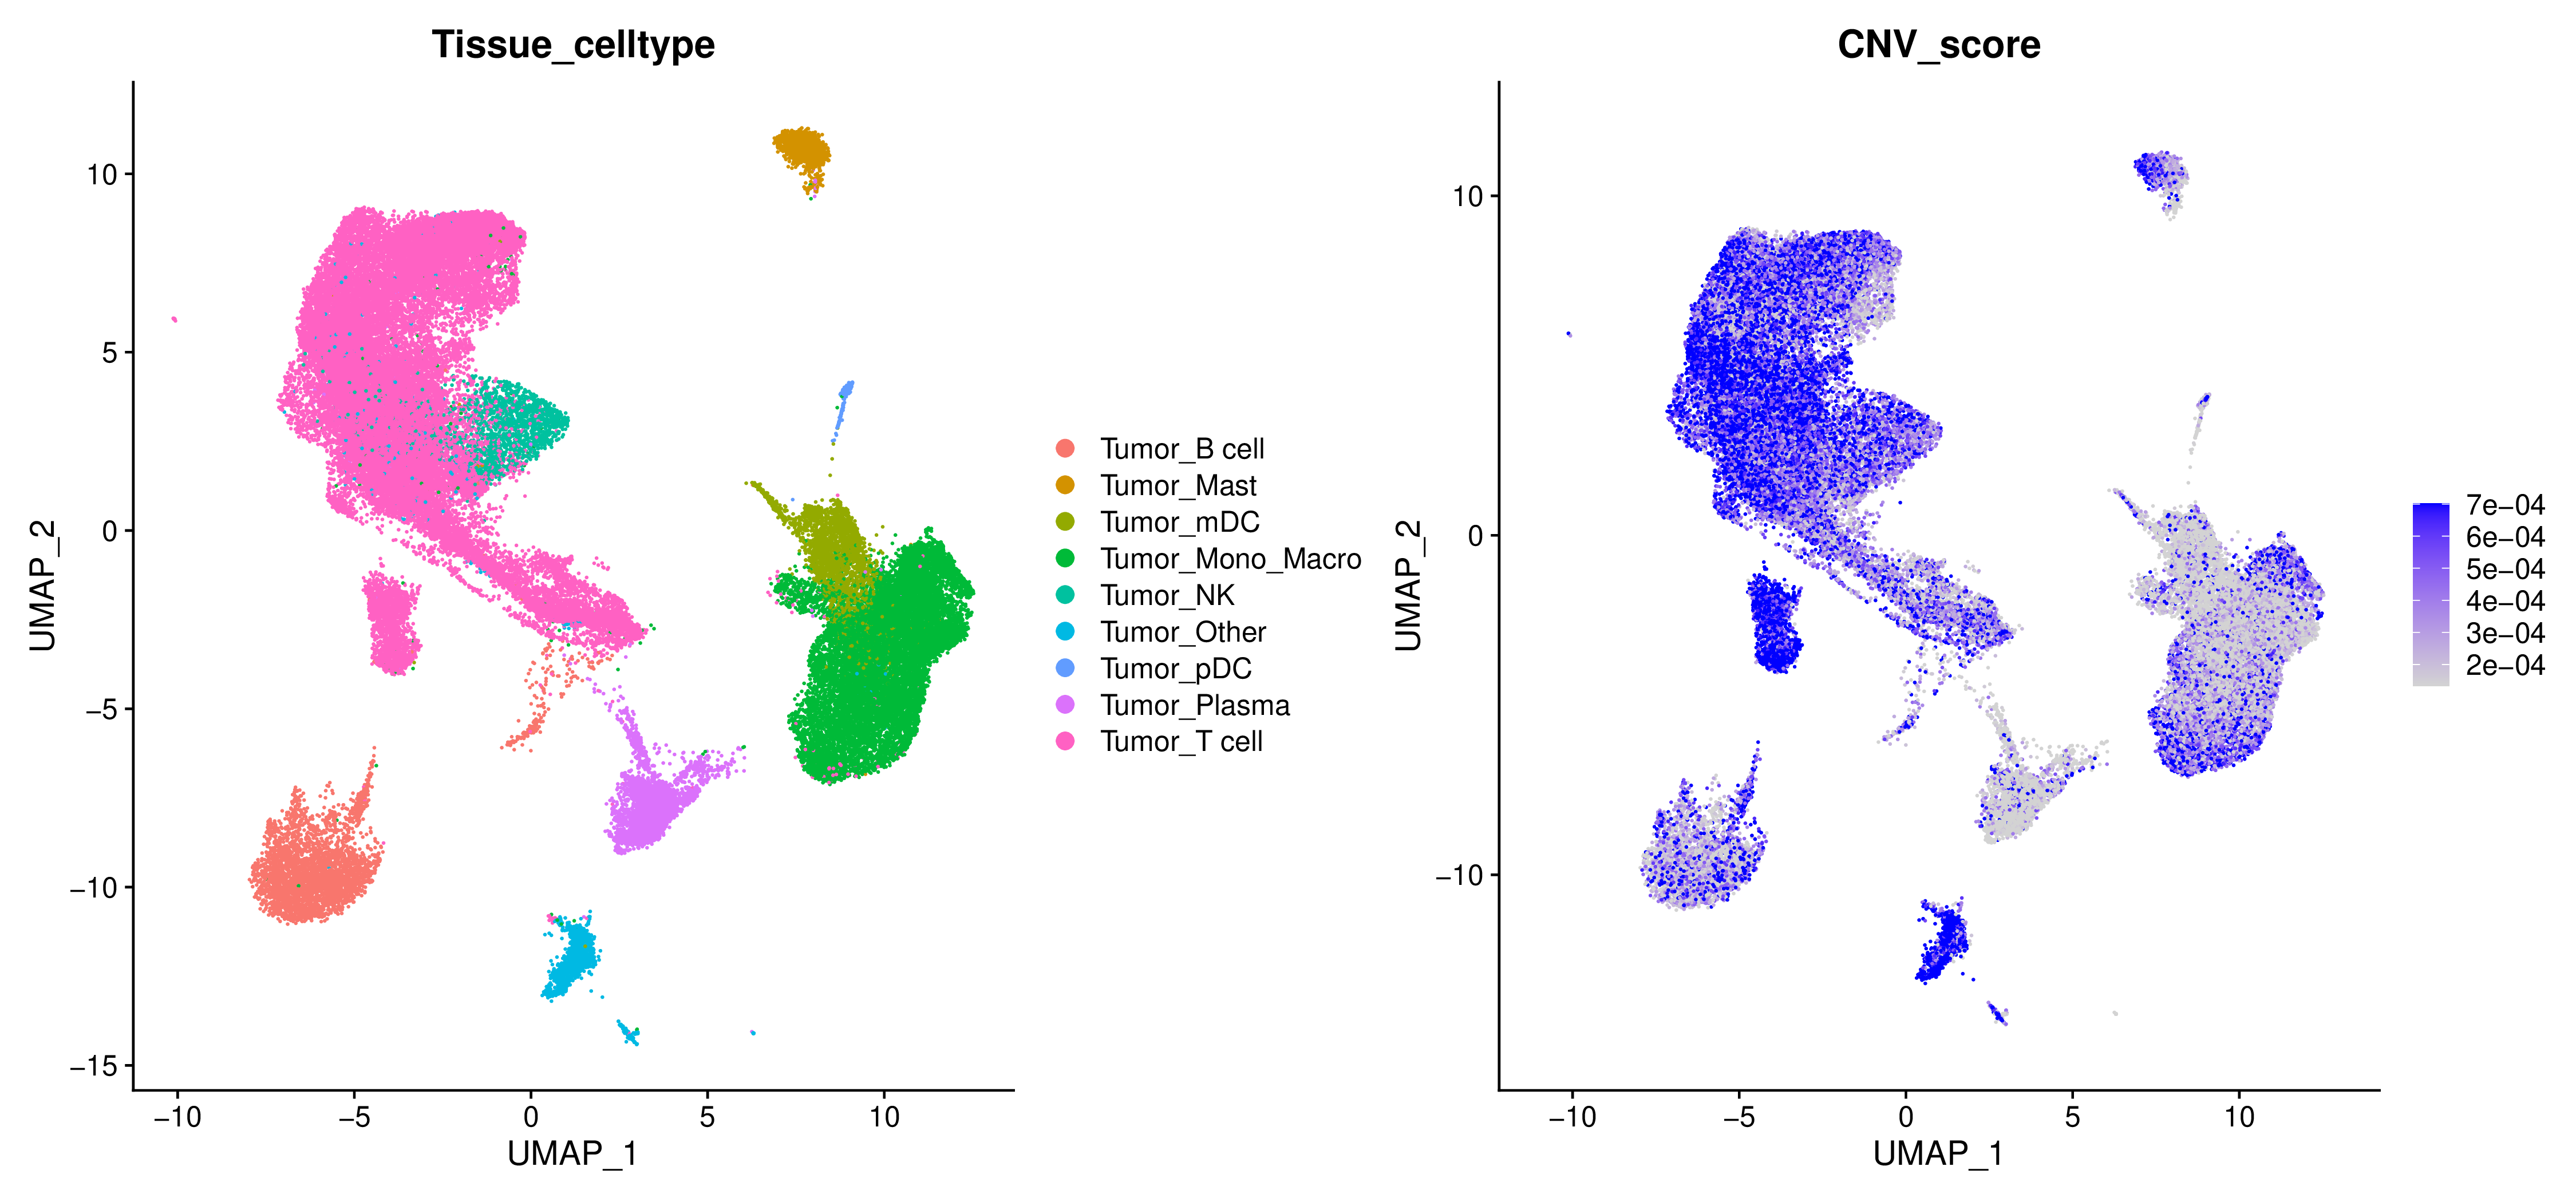
- Chart Interpretation: Project the CNV Score onto UMAP or t-SNE dimension reduction plots. The darker the color, the higher the CNV Score, indicating that the cell genome is more unstable.
- Analysis Points: Intuitively identify which cell clusters are potential tumor cells (usually areas with high CNV Scores).
CNV Score Violin Plot
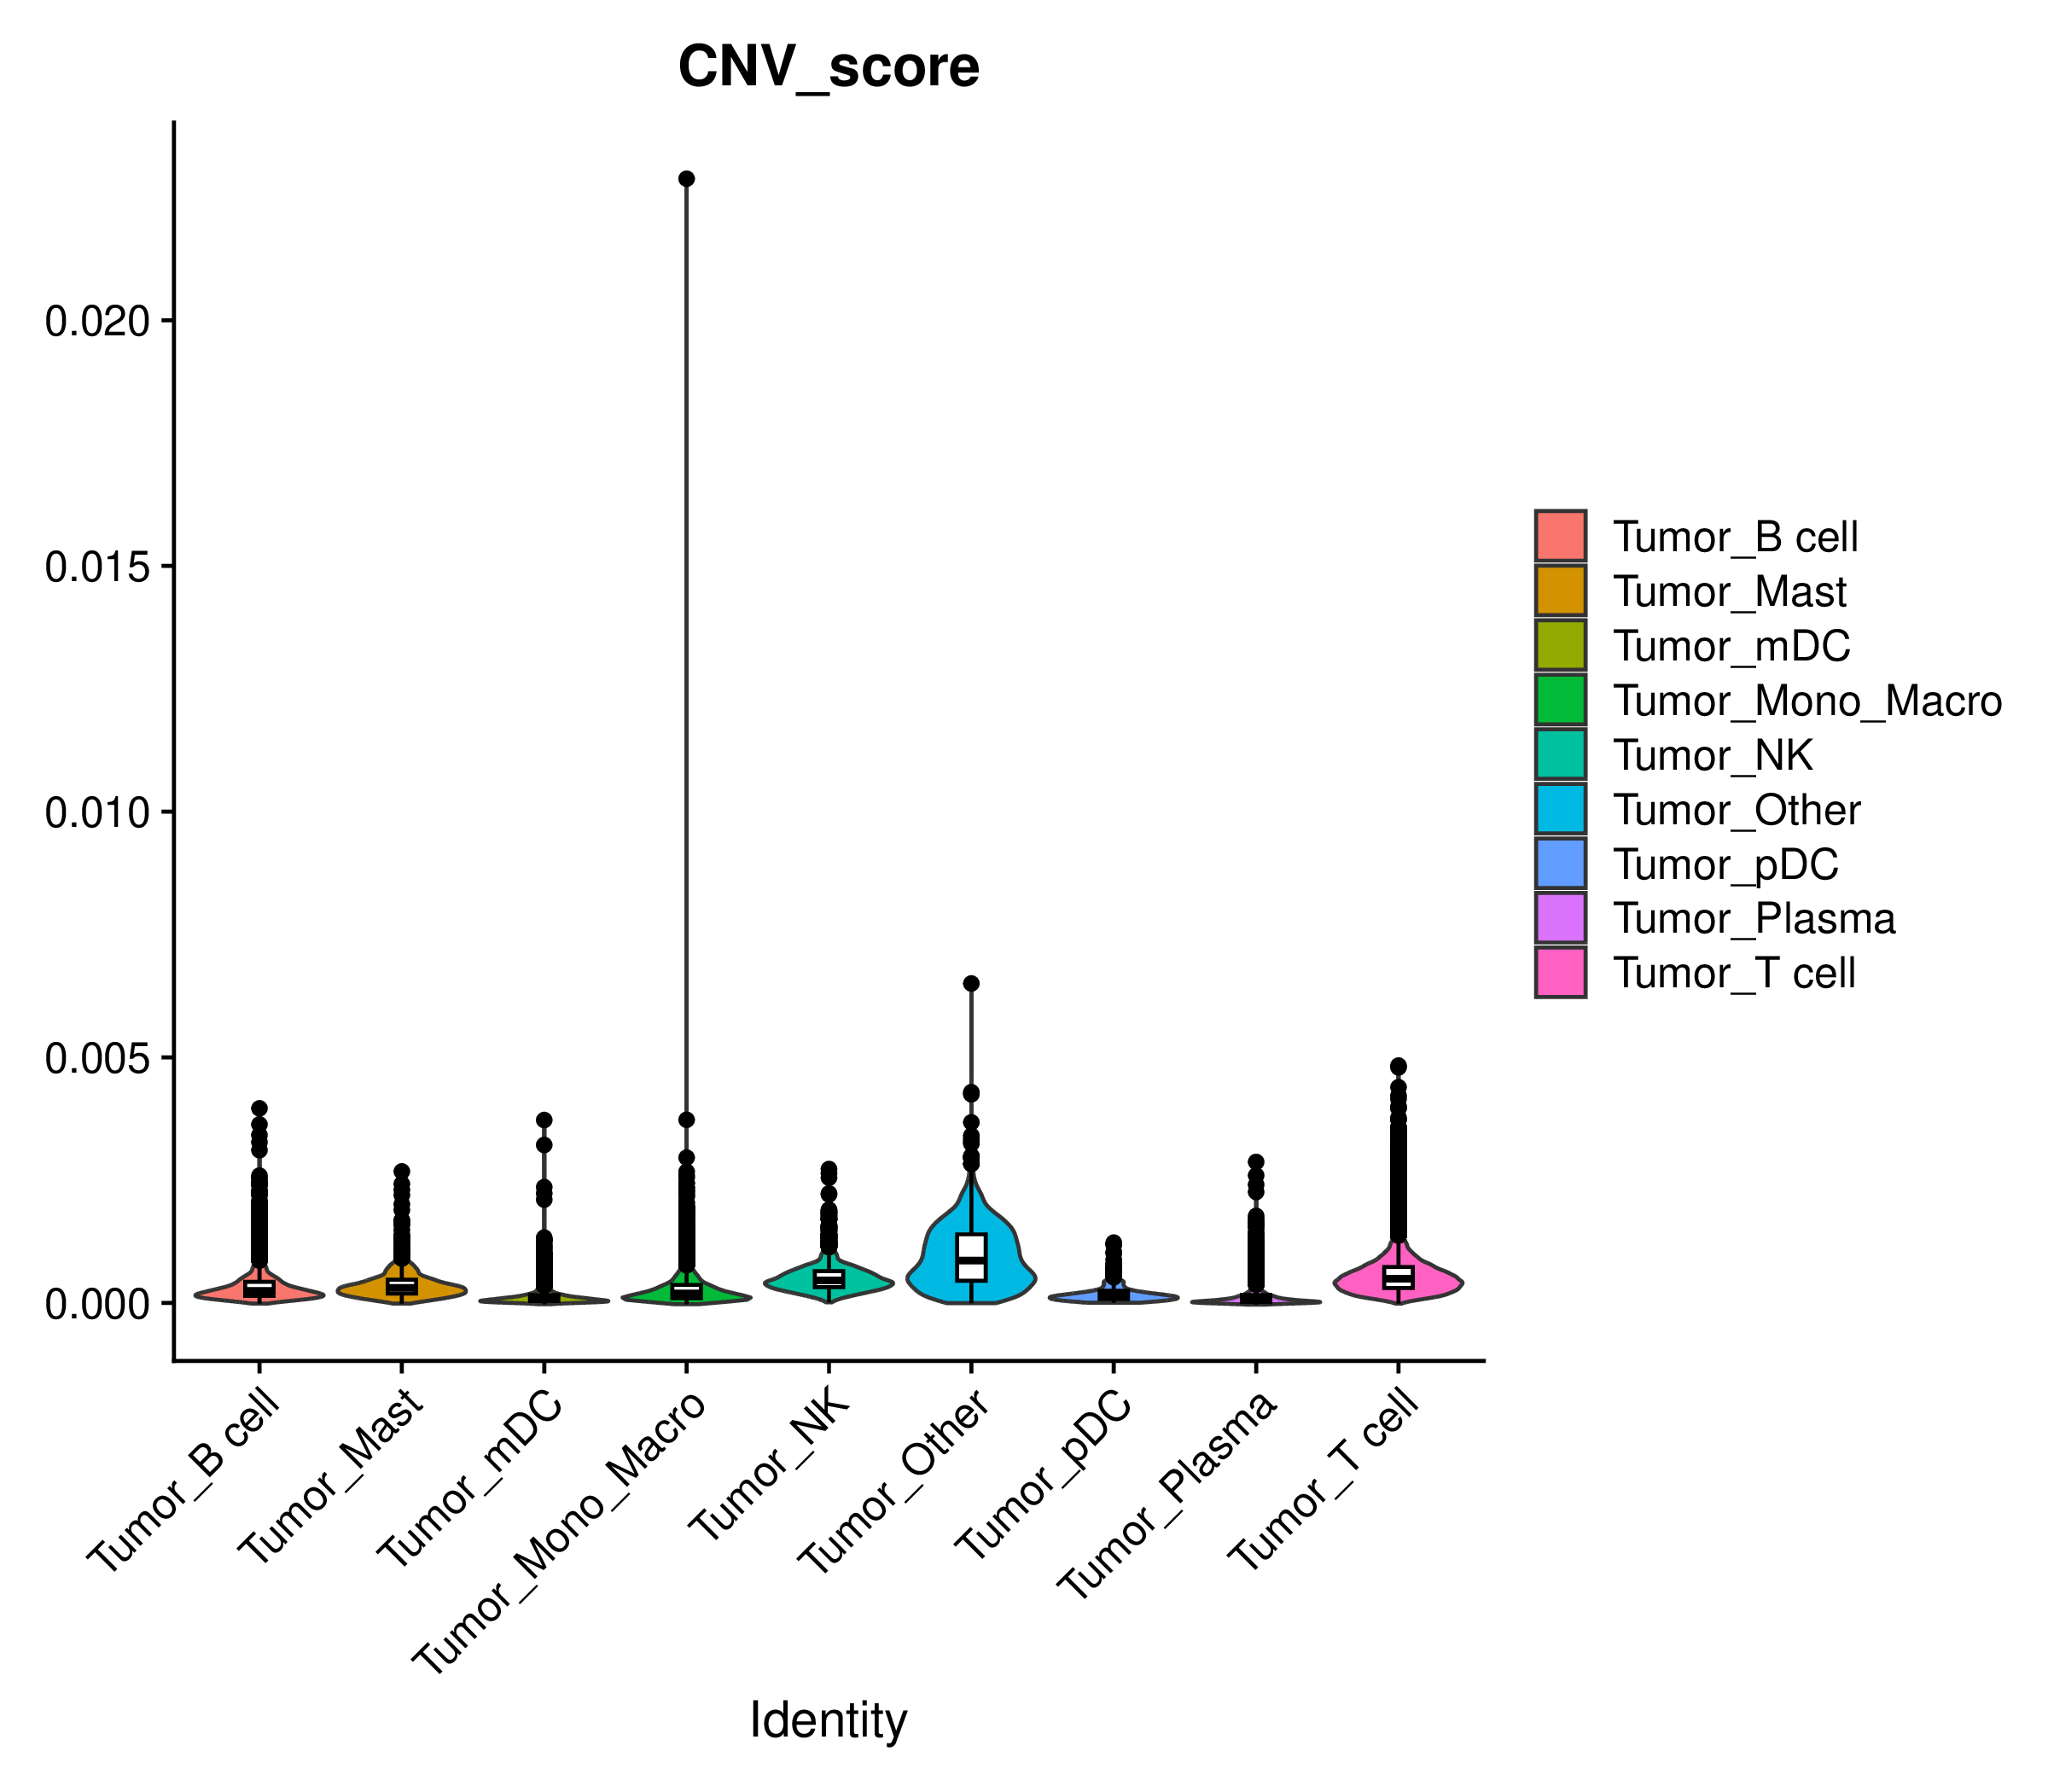
- Chart Interpretation: Display the CNV Score distribution of each cell group by cell type.
- Analysis Points: Quantitatively compare the CNV levels of different cell types. Typically, tumor cell groups will have significantly higher CNV Scores than normal cell groups.
Application Cases
Case 1: Lung Adenocarcinoma (Literature Interpretation)
Research Background
In a study published in Science Advances in 2021, researchers used single-cell transcriptome technology to reveal the tumor heterogeneity of lung adenocarcinoma. Among them, inferCNV was used to distinguish tumor cells from non-tumor cells and verify its consistency with whole-exome sequencing (WES) results.
Analysis Results
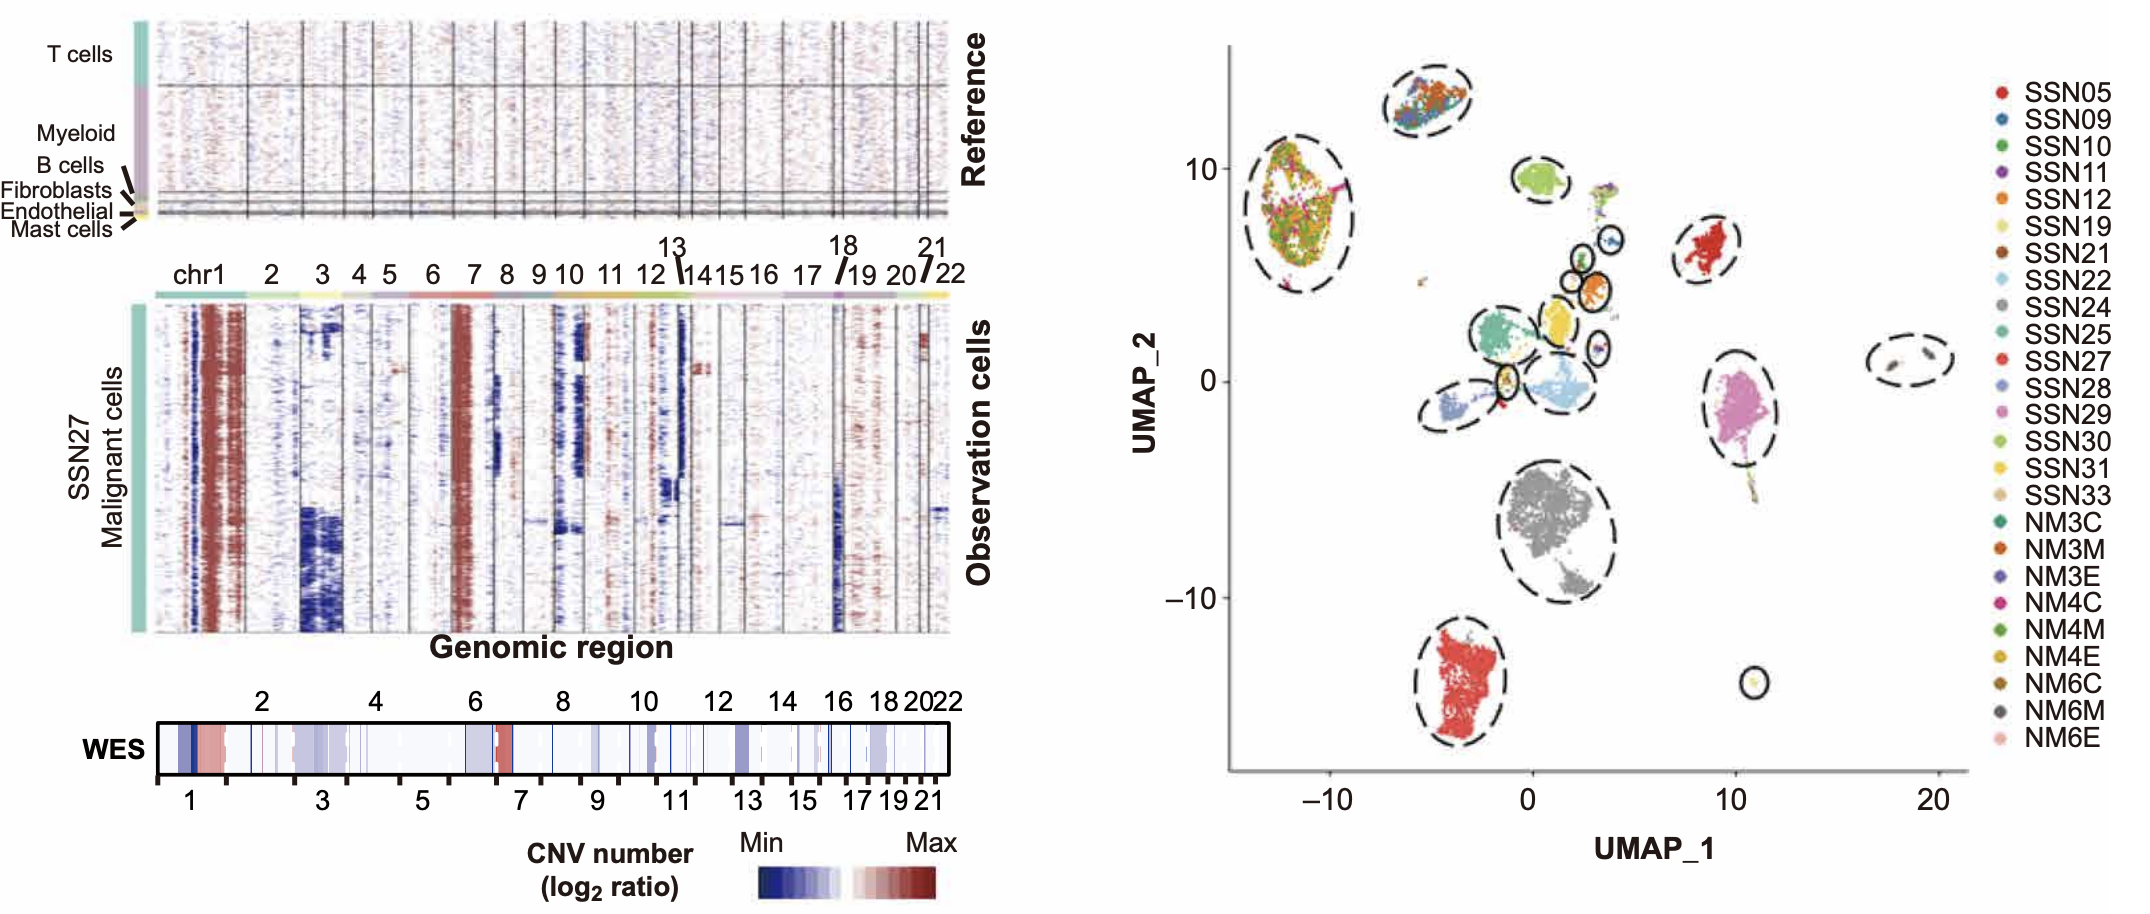
- Left Figure: Shows the inferCNV results of a single sample. With non-malignant cells (immune cells and stromal cells) as reference (upper figure), a large number of copy number variation events highly consistent with the CNV patterns detected by WES (lower figure) can be clearly seen in malignant cells (middle figure).
- Right Figure: The UMAP diagram shows that tumor cells from different patients largely cluster separately, indicating high inter-tumor heterogeneity.
Conclusion
This case shows that inferCNV can:
- Effectively distinguish tumor and non-tumor cells.
- Reveal intratumoral heterogeneity.
- Provide reliable results with good consistency with gold standards (such as WES).
Notes
1. The selection of reference group is crucial: The accuracy of inferCNV analysis extremely depends on a high-quality reference cell population determined to be "normal" diploid. If the reference group is selected incorrectly (for example, mixing tumor cells, or selecting cell types that themselves have physiological gene expression differences), it will lead to systematic bias in the entire analysis results, or even completely wrong conclusions.
2. Signal-to-noise ratio issue: Single-cell transcriptome data itself has the characteristics of high noise and high sparsity. inferCNV enhances signals by smoothing gene expression on chromosomes, but it may still be affected by technical noise. For tumors with weak CNV signals, the results may be unclear or unreliable.
3. Application of HMM mode: When you need clearer CNV status classification (such as "amplification", "deletion", "neutral") rather than just a heatmap of relative expression, you can consider using HMM (Hidden Markov Model) prediction mode. This helps to more objectively define CNV regions, but requires higher data quality.
4. Results are not absolute copy numbers: inferCNV shows changes in gene expression levels relative to the reference group. It reflects relative copy numbers rather than absolute copy numbers (such as 2 copies, 3 copies).
Frequently Asked Questions (FAQ)
Q1: Why do all cells (including reference cells) on my CNV heatmap appear to have CNVs?
A1: This is a common phenomenon, usually caused by technical noise or imperfect reference cells. The results of inferCNV are relative, and the key lies in comparing the pattern differences between the "Observation" and "Reference" groups. If the observation group shows stronger and more consistent large-segment CNV patterns than the reference group, these signals are usually reliable. In addition, you can try to replace the reference cell type or enable denoise mode to optimize the results.
Q2: Can inferCNV distinguish loss of heterozygosity (LOH)?
A2: No. inferCNV is based on transcriptome data, and it can only infer total copy number changes (increase or decrease) but cannot distinguish alleles. Accurate identification of LOH requires genomic sequencing data.
Q3: My analysis failed, what might be the reason?
A3: Common reasons include: 1) Reference cell selection error: The "Reference Cell Type" you selected in the parameters does not exist or the name does not match in your cell annotation data. 2) Too few genes: After filtering with "Minimum Average Gene Expression", there are too few remaining genes to perform effective smoothing analysis. 3) Species and gene ID mismatch: The selected species (such as human) does not match the gene IDs in your expression matrix (such as mouse genes).
References
- Patel, A. P., et al. (2014). Single-cell RNA-seq highlights intratumoral heterogeneity in primary glioblastoma. Science, 344(6190), 1396-1401.
- Tirosh, I., et al. (2016). Dissecting the multicellular ecosystem of metastatic melanoma by single-cell RNA-seq. Science, 352(6282), 189-196.
- Xing, X., et al. (2021). Decoding the multicellular ecosystem of lung adenocarcinoma manifested as pulmonary subsolid nodules by single-cell RNA sequencing. Science Advances, 7(5), eabd9738.
- Kumar, M., et al. (2020). Single-cell analysis of copy-number alterations in serous ovarian cancer reveals substantial heterogeneity in both low- and high-grade tumors. Cell Cycle, 19(23), 3154-3166.
- Wu, F., et al. (2021). Single-cell profiling of tumor heterogeneity and the microenvironment in advanced non-small cell lung cancer. Nature Communications, 12(1), 2540.
- inferCNV Wiki