mut Analysis
Introduction
IMPORTANT
The mut module focuses on single-cell SNV/Indel enrichment analysis, localizing cell populations carrying specific mutations and evaluating their functional pathways through joint modeling of mutation matrices and expression matrices. The workflow defaults to accepting upstream mutation detection results (*.snp_indel.all_UMI.matrix, *.snp_indel.alt_UMI.matrix) and does not require re-running long processes like VarScan within this module.
With the widespread application of single-cell sequencing, many studies aim to answer whether "a specific cell population carries particular mutations and exhibits functional gains." The mut module in SeekSoul™ Online is designed for this purpose: it automatically performs matrix validation, sample splitting, mutation enrichment, differential/pathway analysis, and report generation, significantly lowering the threshold for bioinformatics development.
Theoretical Foundation of mut Analysis
Core Principles
- Matrix Validation and Download: The system automatically reads the
all_UMI/alt_UMIpaths recorded insample_matrix.txt, performs availability validation, and downloads them in parallel to ensure all mutation matrices for each sample are ready. - RDS Subset and Sample Identification: Generates subset RDS based on the user-specified sample column (default
Sample) and cell annotation column, unifying barcode naming for subsequent analysis and filtering irrelevant cells. - Mutation Information Summary: The workflow reads the mutation matrix and counts each site's UMI count, number of barcodes carrying mutations, mutation rate, and distribution across different celltypes/clusters.
- Mutation Enrichment Determination: Mounts the mutation matrix as an additional Assay to the single-cell object, uses Fisher's exact test to determine significant enrichment for each site × cell population, and outputs
*_snv_markers.xlswith UMAP visualization. - Differential and Pathway Analysis: If the species is human/mouse, the system automatically selects the top 10 significant sites, performs differential analysis between mutant cells and covered cells, and conducts GO/KEGG/Reactome enrichment, outputting tables and images.
- Report Generation: Produces directly deliverable HTML/PDF reports.
Single Sample vs. Multiple Sample Strategy
| Scenario | Processing Approach | Output |
|---|---|---|
| Single Sample | Directly performs statistics, enrichment, and visualization on the sample's *.snp_indel.*.matrix | Sample.mut.info.txt, mutation_umap/, differential enrichment (if species ∈ {human, mouse}) |
| Multiple Samples | The system generates two matrix sets: multi (all mutations) and common (shared sites), and performs statistics and enrichment separately for each, facilitating comparison of overall and intersection results | Dual results of multi.* and common.*, presented in separate sections in the report |
Key Statistical Indicators
- UMI / barcode: Reflects the coverage of mutations at the cellular level, which can be used to assess whether sequencing depth is sufficient.
- mut_rate:
barcode_count / total_cells, measuring the frequency of mutations in the sample. - Fisher's exact test: Constructs a 2×2 contingency table of "mutation vs. coverage" and "target cells vs. other cells," returning indicators such as
p_valandident1_mut. - Differential expression/enrichment: Default
logfc.threshold=0.25, with GO/KEGG/Reactome unified plotting and table output.
SeekSoul™ Online Operation Guide
Pre-Analysis Preparation
CAUTION
- The upstream mutation matrix files should maintain consistent barcode naming with those in RDS; if they include suffixes, the mut process will automatically match them, but it's still recommended to check before uploading.
- The column names and content of metadata should not contain Chinese characters or special characters (
&, spaces, etc.), otherwise the process may fail.
- The differential enrichment module is only executed when
speciesis set to human/mouse.
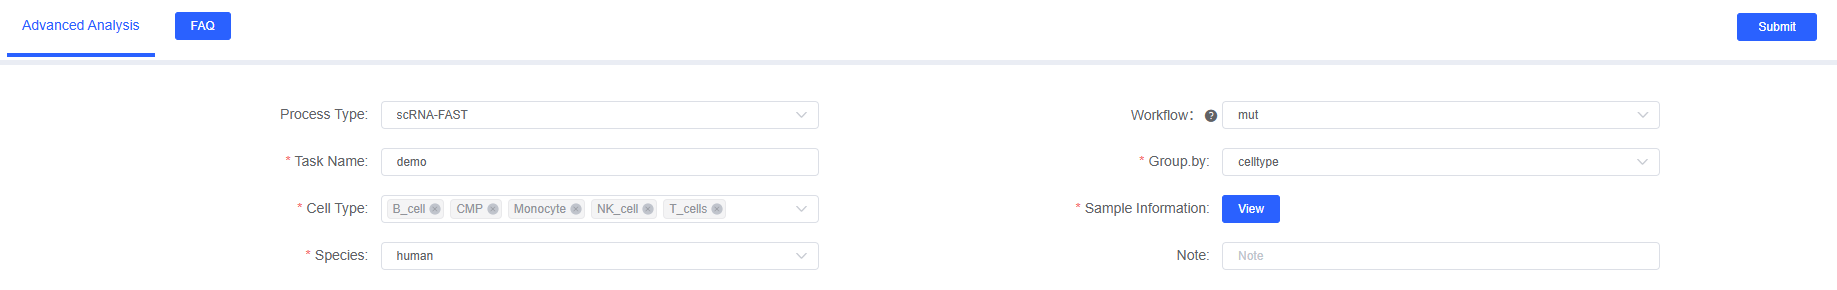
Parameter Details
| Interface Parameter | Description | Notes |
|---|---|---|
| Task Name | Starts with English, can contain Chinese/numbers/underscores | Used for report header and task tracking |
| Group.by | Column representing samples in metadata, default Sample | Determines subset_samples.R --group |
| Cell Type | Cell annotation column in metadata, e.g., CellAnnotation | Affects enrichment test and differential analysis |
| Sample Information | Sample information to be analyzed, along with corresponding all_UMI.matrix and alt_UMI.matrix | Supports OSS paths |
| Species | human / mouse / other | Controls whether differential enrichment is performed |
| Note | Custom text | Records analysis background |
Result Interpretation
Result Directory Overview
| Path | Content | Description |
|---|---|---|
output/results/<sample>.mut.info.txt | UMI, barcode, mut_rate and cluster information for each site | Can be used for downstream screening of hotspot mutations |
output/results/<sample>/mutation_umap/SNV_diff/*.png | UMAP visualization of Fisher significant mutations | The file name indicates the mutation site |
output/results/<sample>/mutation_umap/SNV_diff/<sample>_snv_markers.xls | Mutation enrichment statistics table | Contains p_val, ident*_mut/cover, etc. |
.../diff_pathway/pos*/diffgene.xls | Differential expression results | ident.1 = alt, ident.2 = WT |
| `.../diff_pathway/pos*/go | kegg | reactome/` |
report/ | HTML report directory | Packaged as report.zip for download |
Key Visualization Examples
Single Sample View
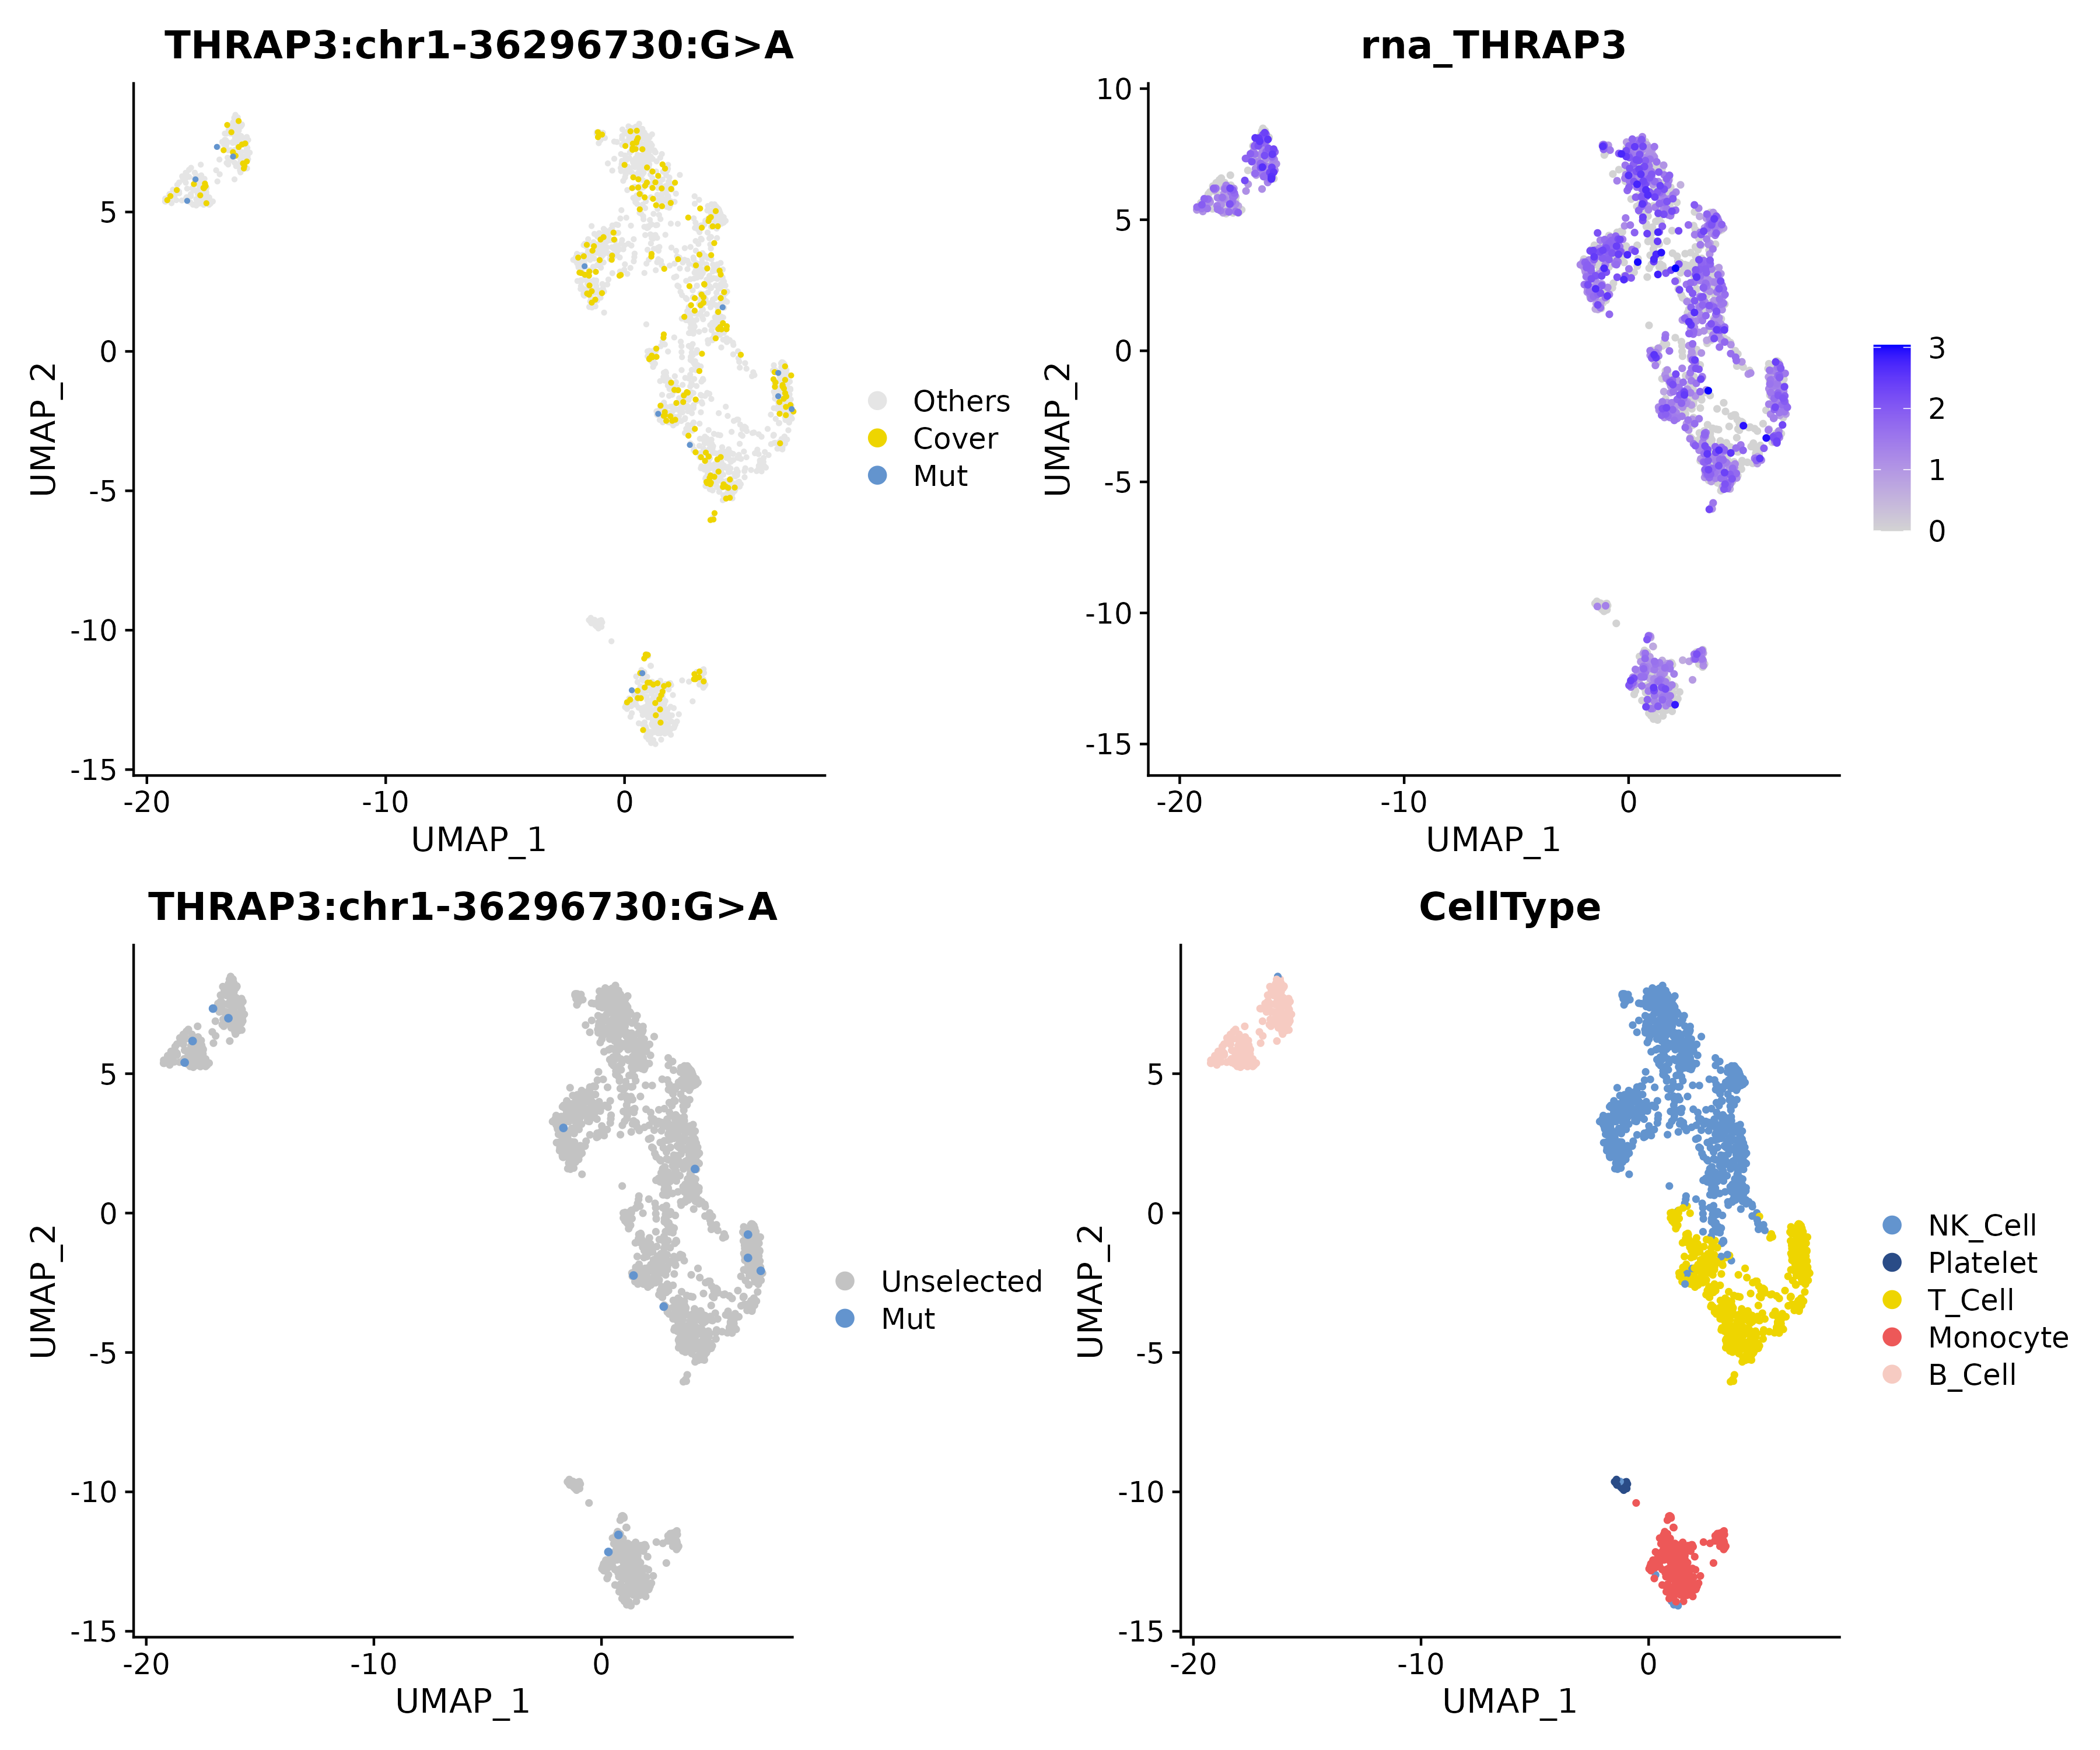
Shows significant sites filtered by Fisher test (Example:
THRAP3 chr1-36296730 G>Aupregulated in B cells of PBMC samples). Red dots represent mutant cells, gray dots represent covered but non-mutant cells.
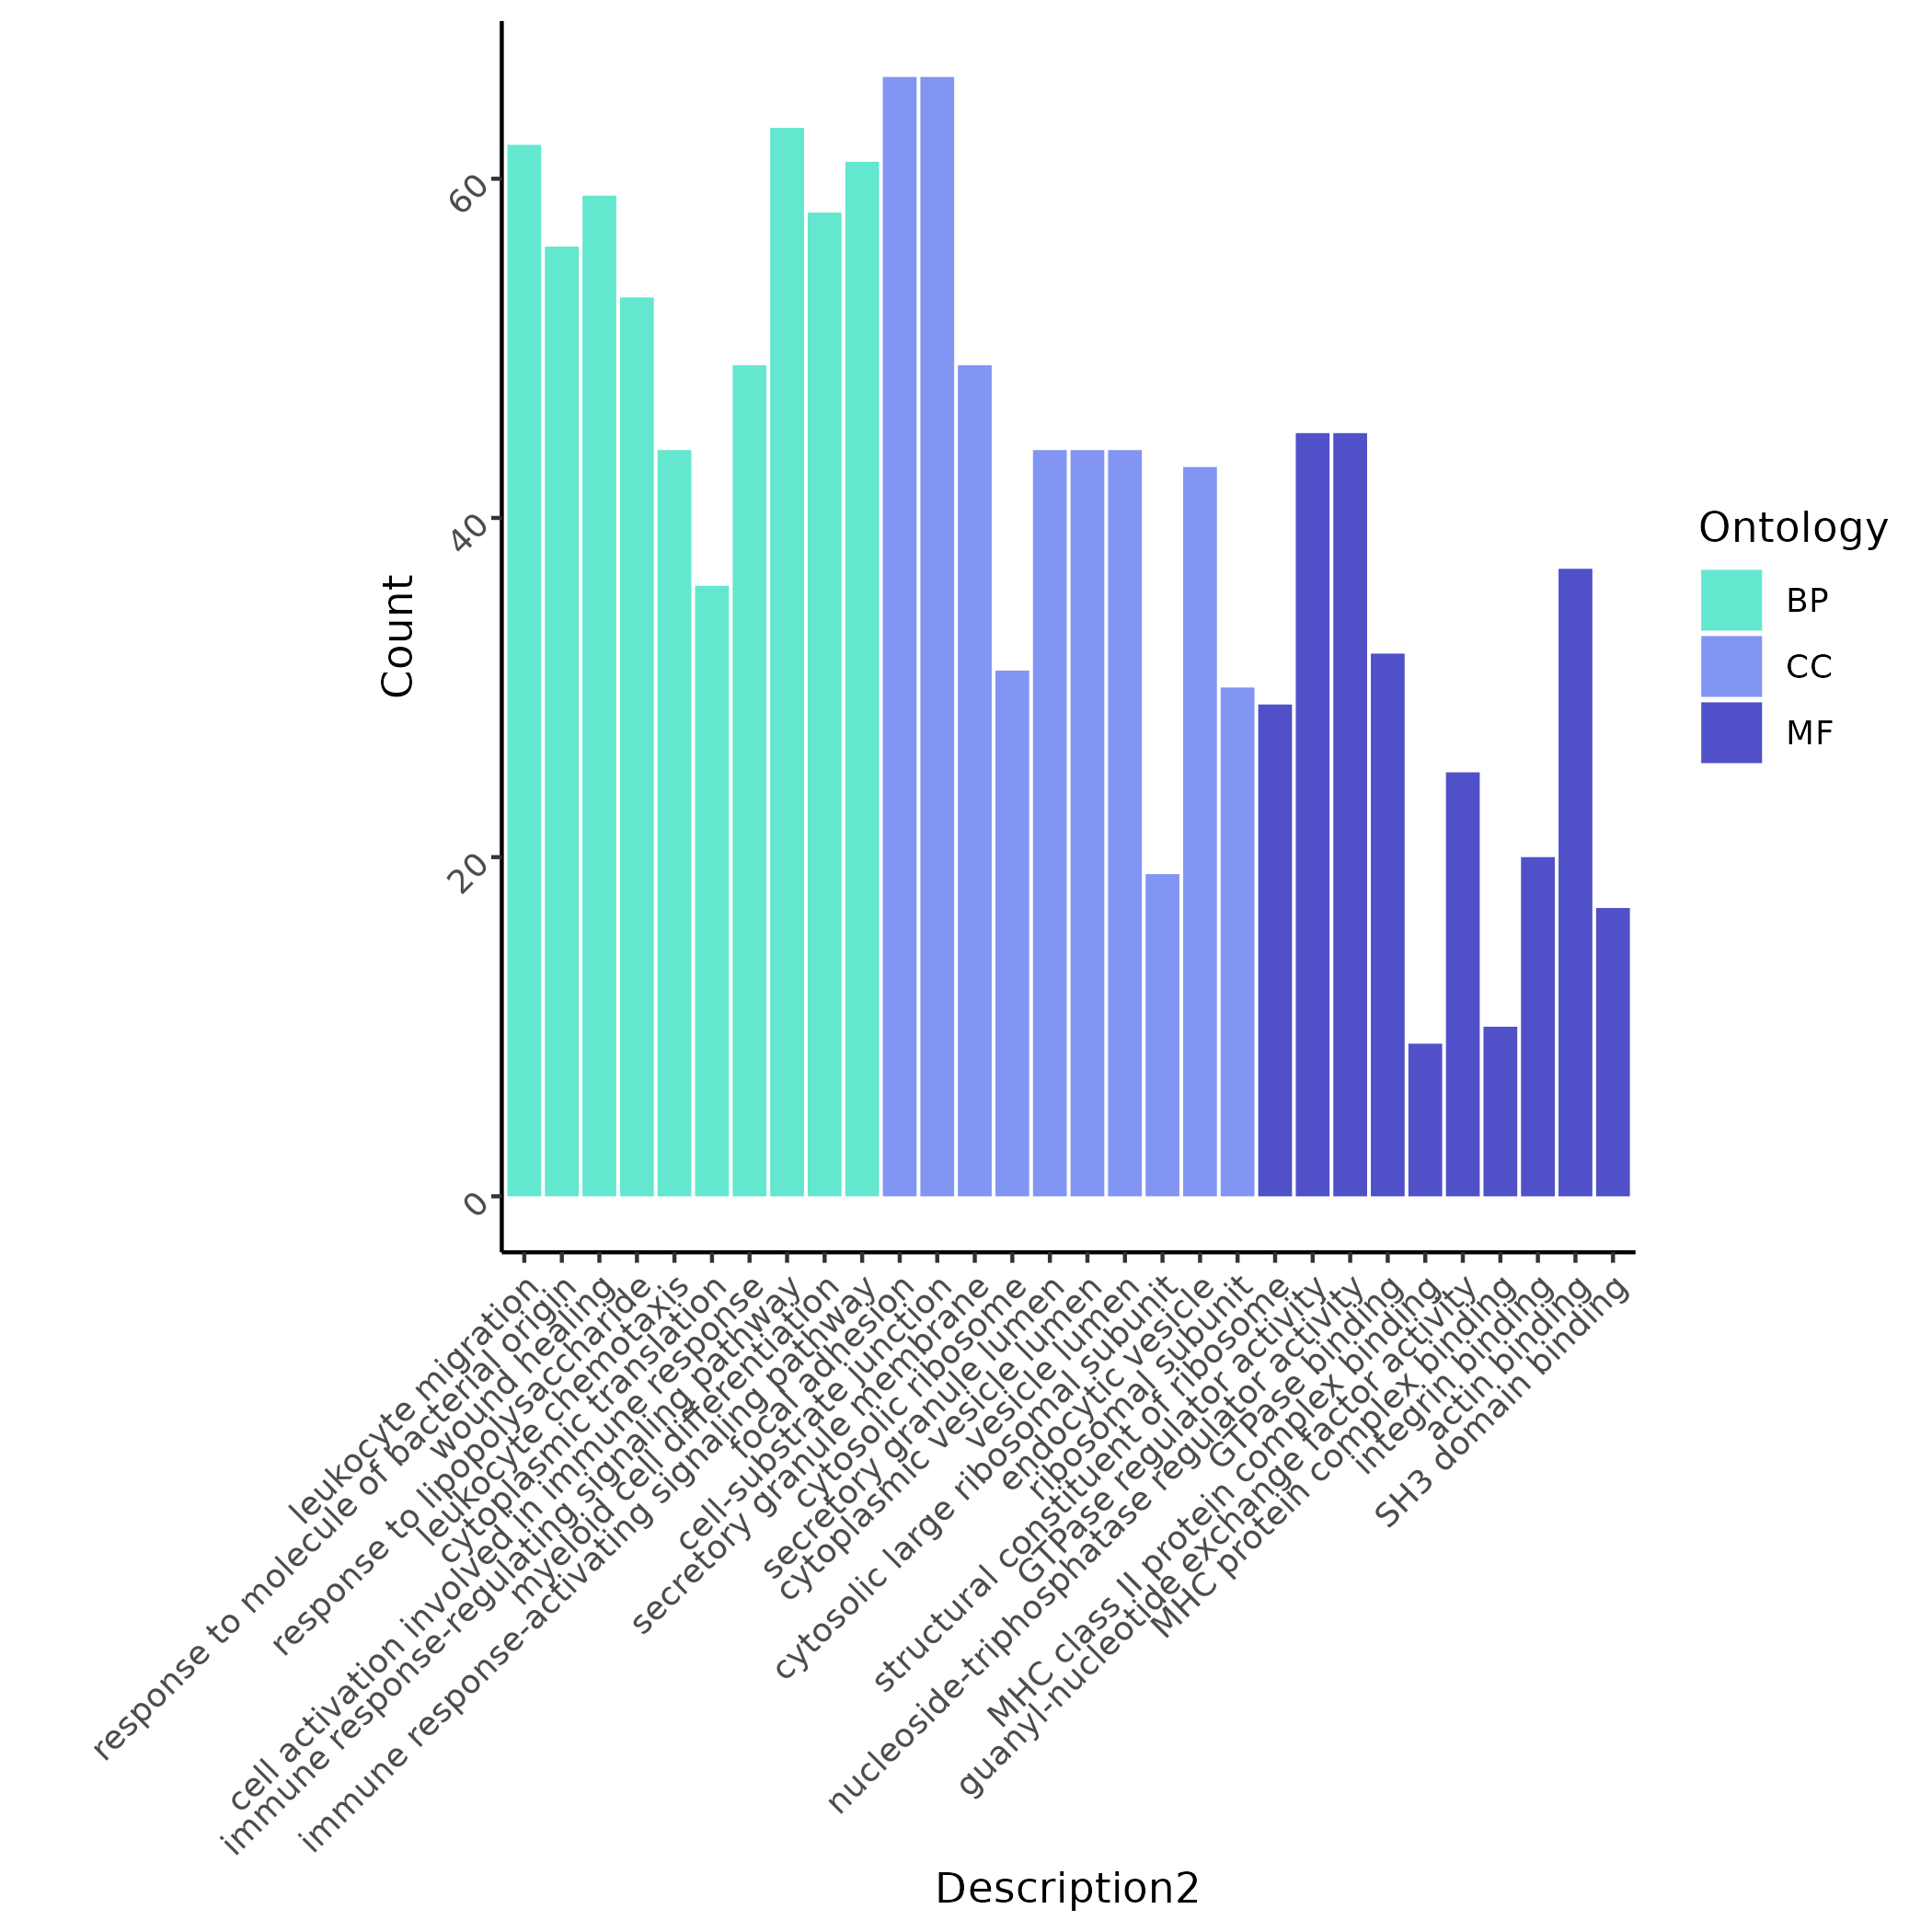
Based on differential analysis between mutant Monocytes and WT cells at the
pos0EGR1site, the system filters significant items and plots bar charts, allowing quick identification of themes such as "leukocyte migration" and "wound healing".
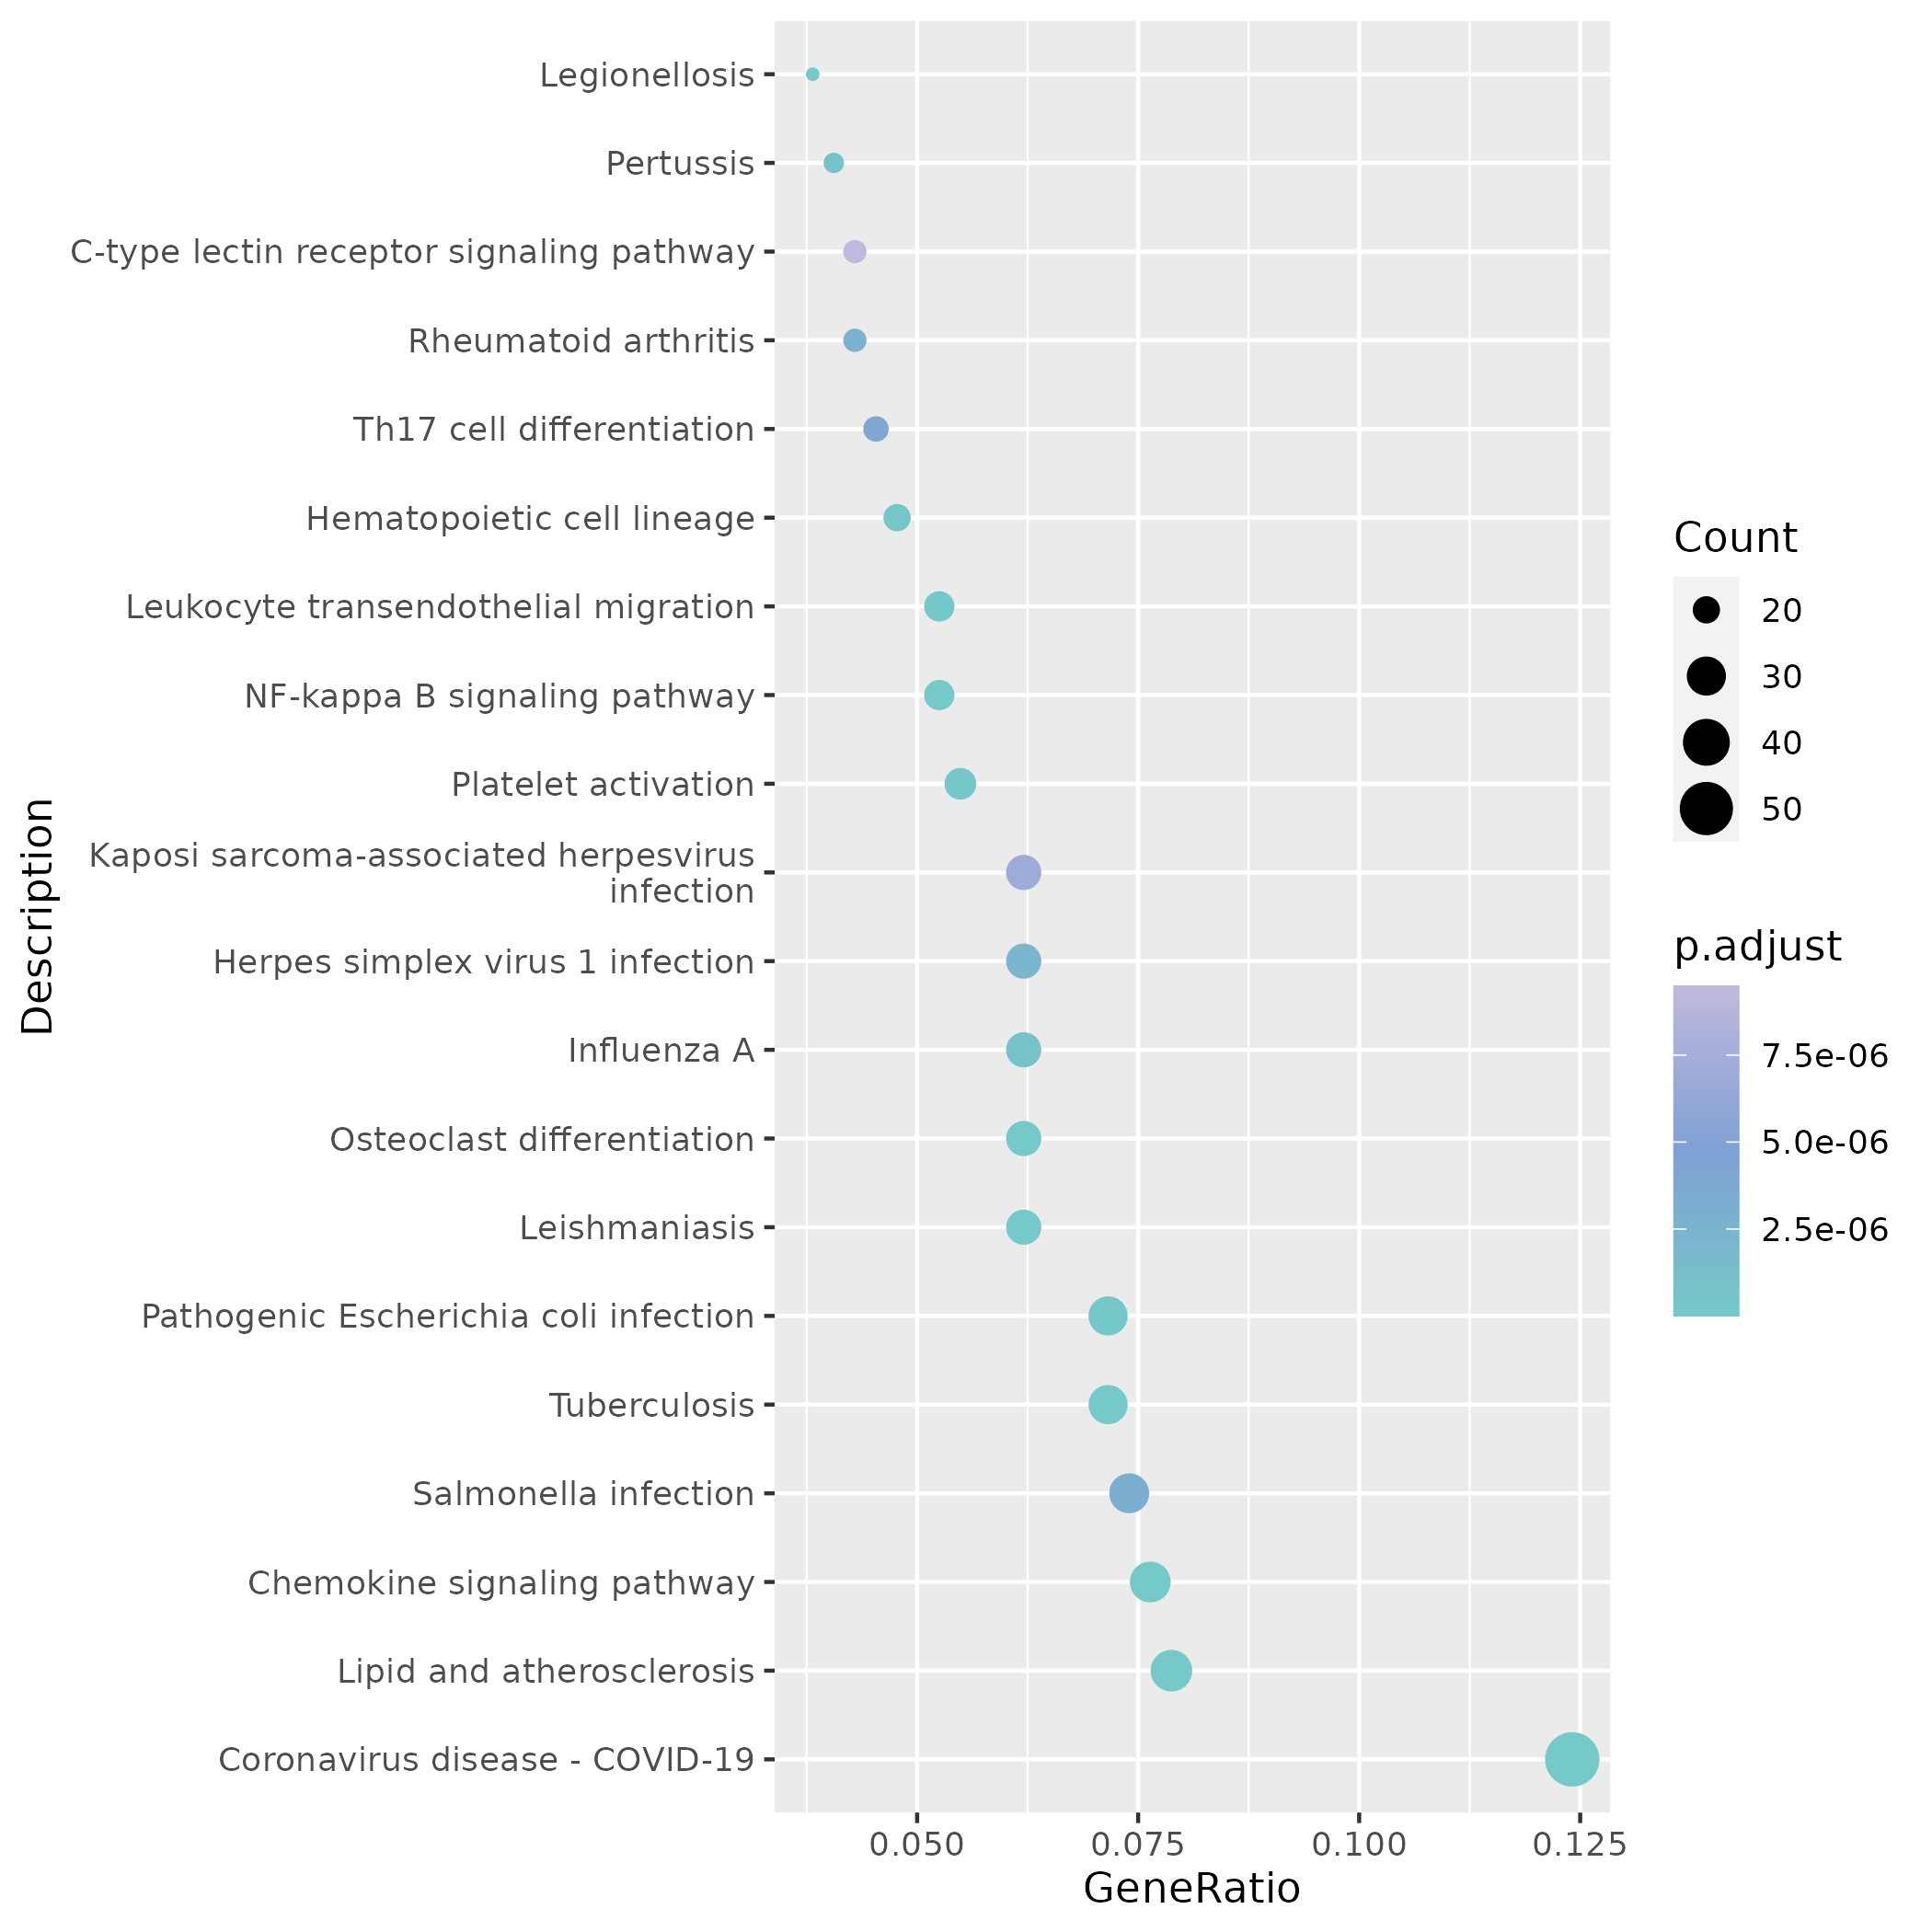
KEGG enrichment dot plots focus on immune/infection-related pathways (Chemokine signaling, NF-κB, Platelet activation, etc.), where dot color and size represent significance and number of enriched genes respectively.
Multi-Sample View
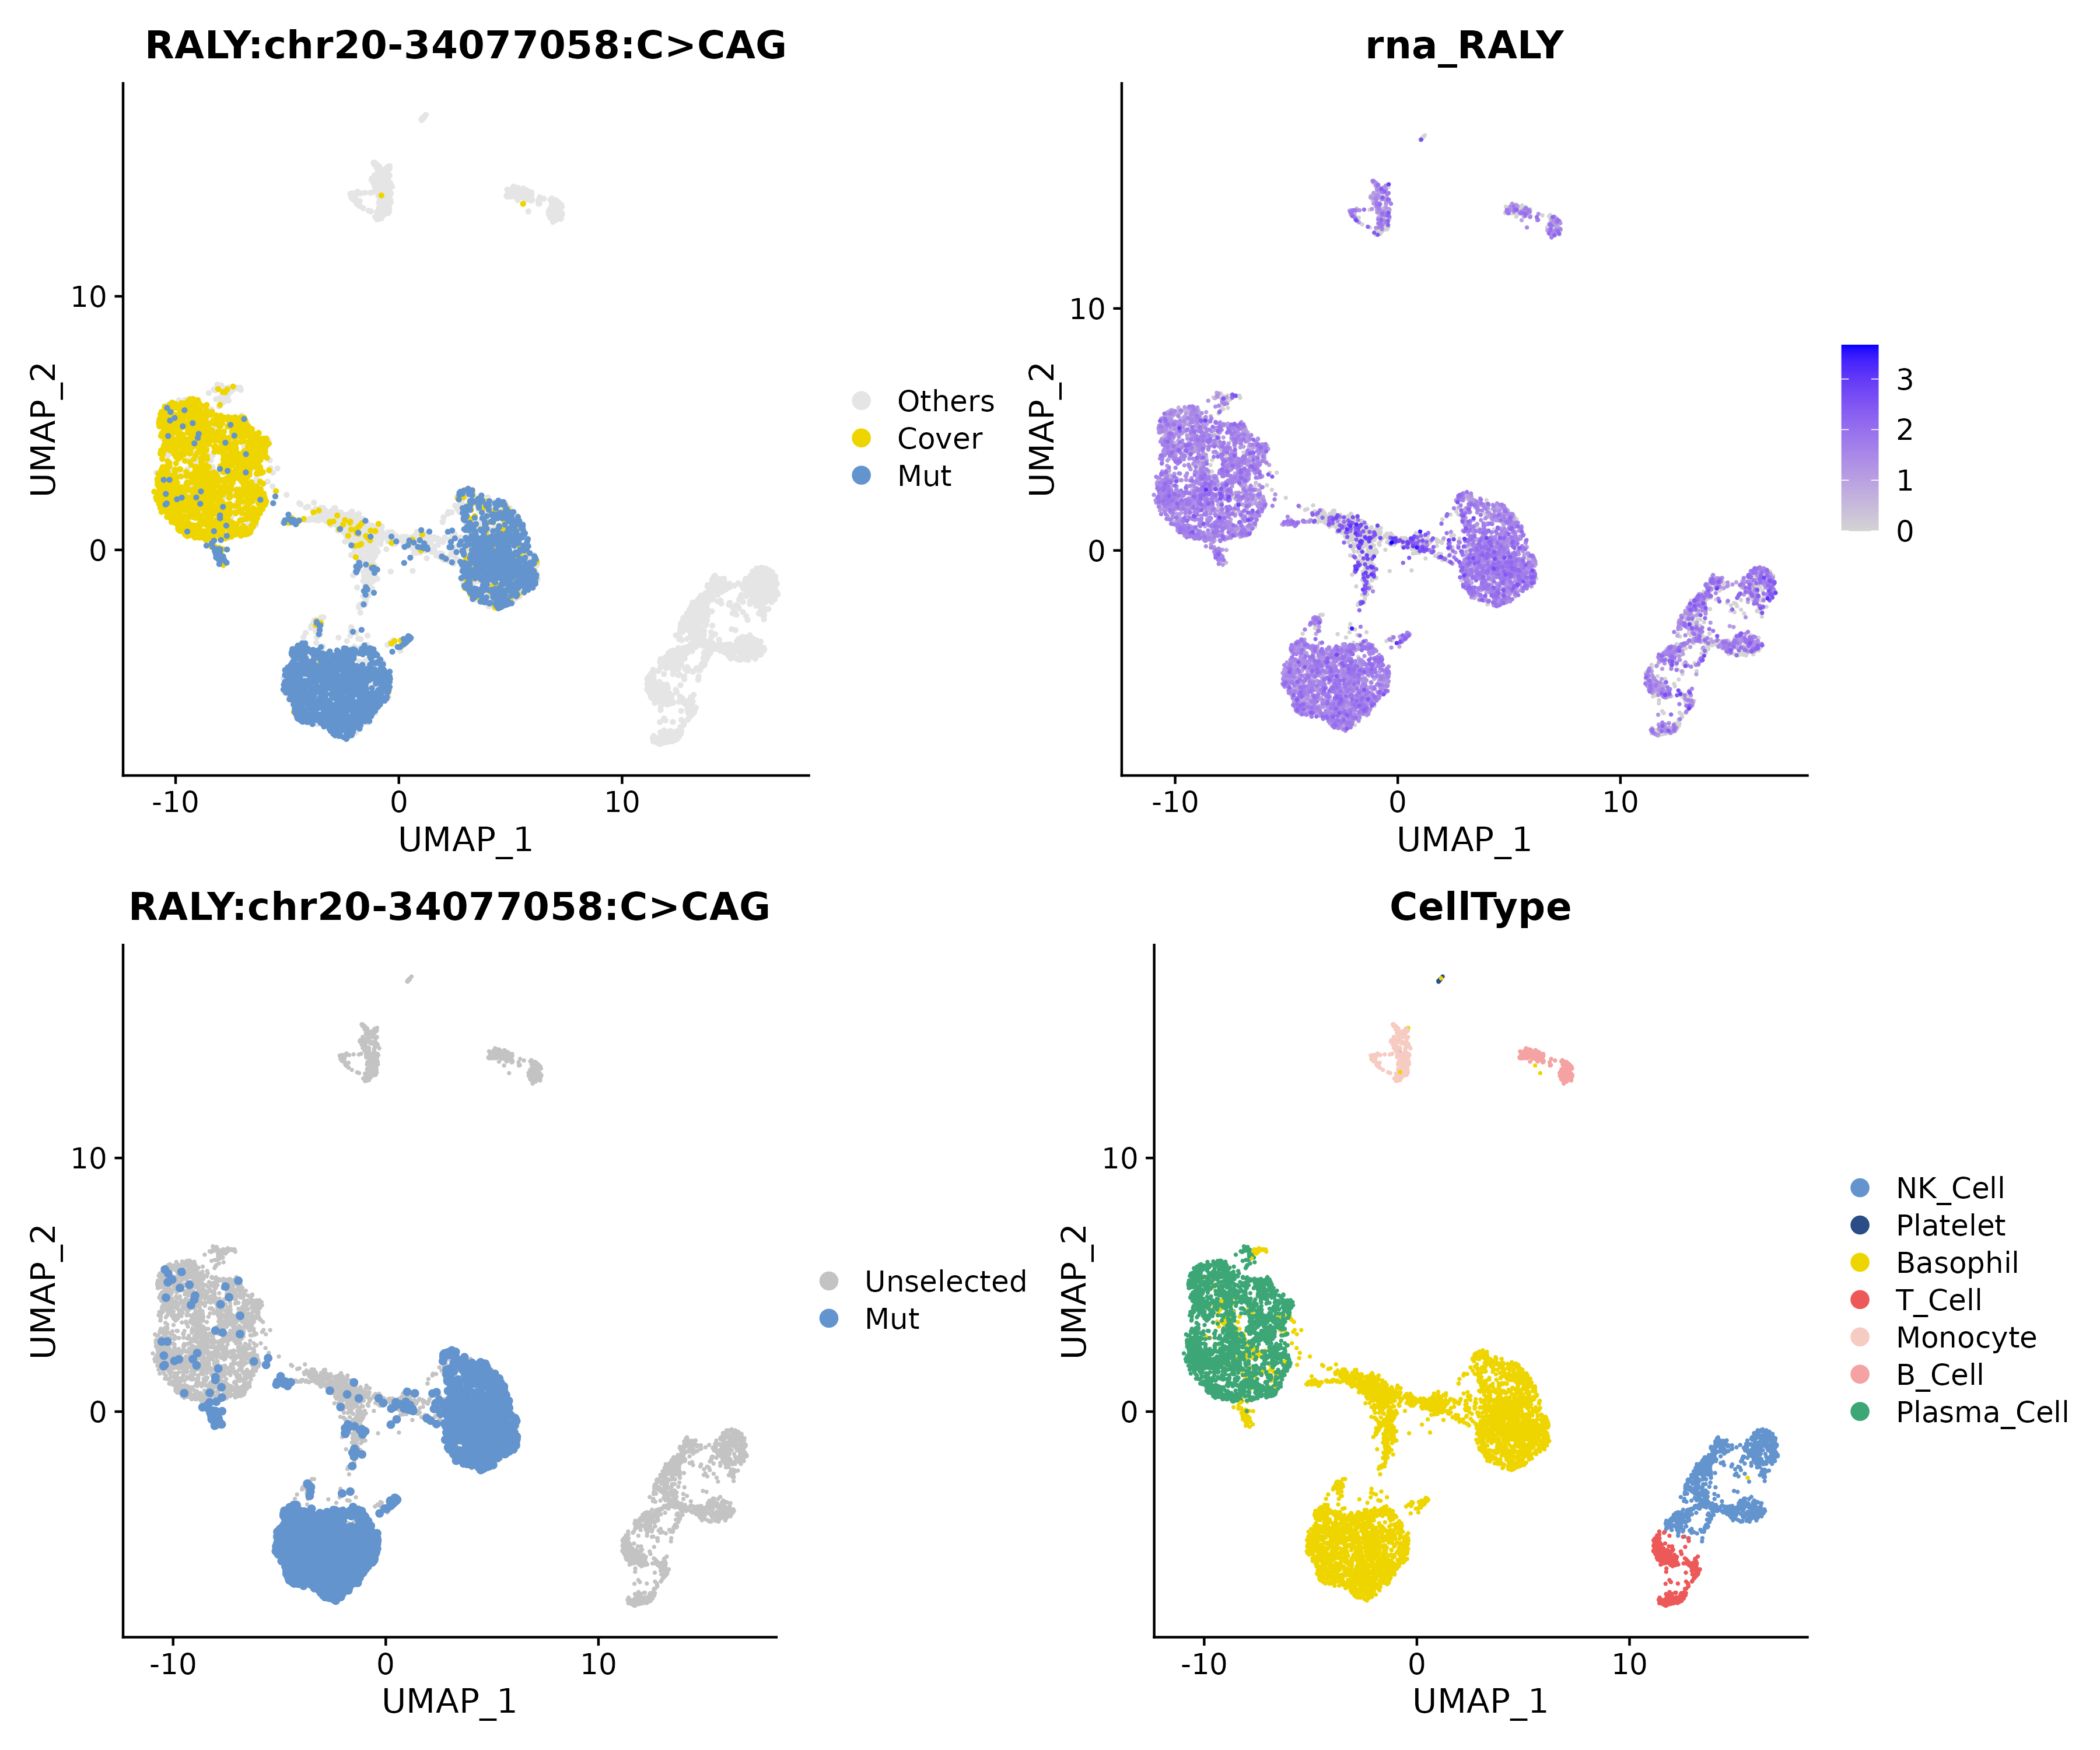
Under the
multimatrix,RALY chr20-34077058 C>CAGis significantly enriched in Basophil cells. In the figure, red dots represent mutant cells, and gray dots represent covered cells.
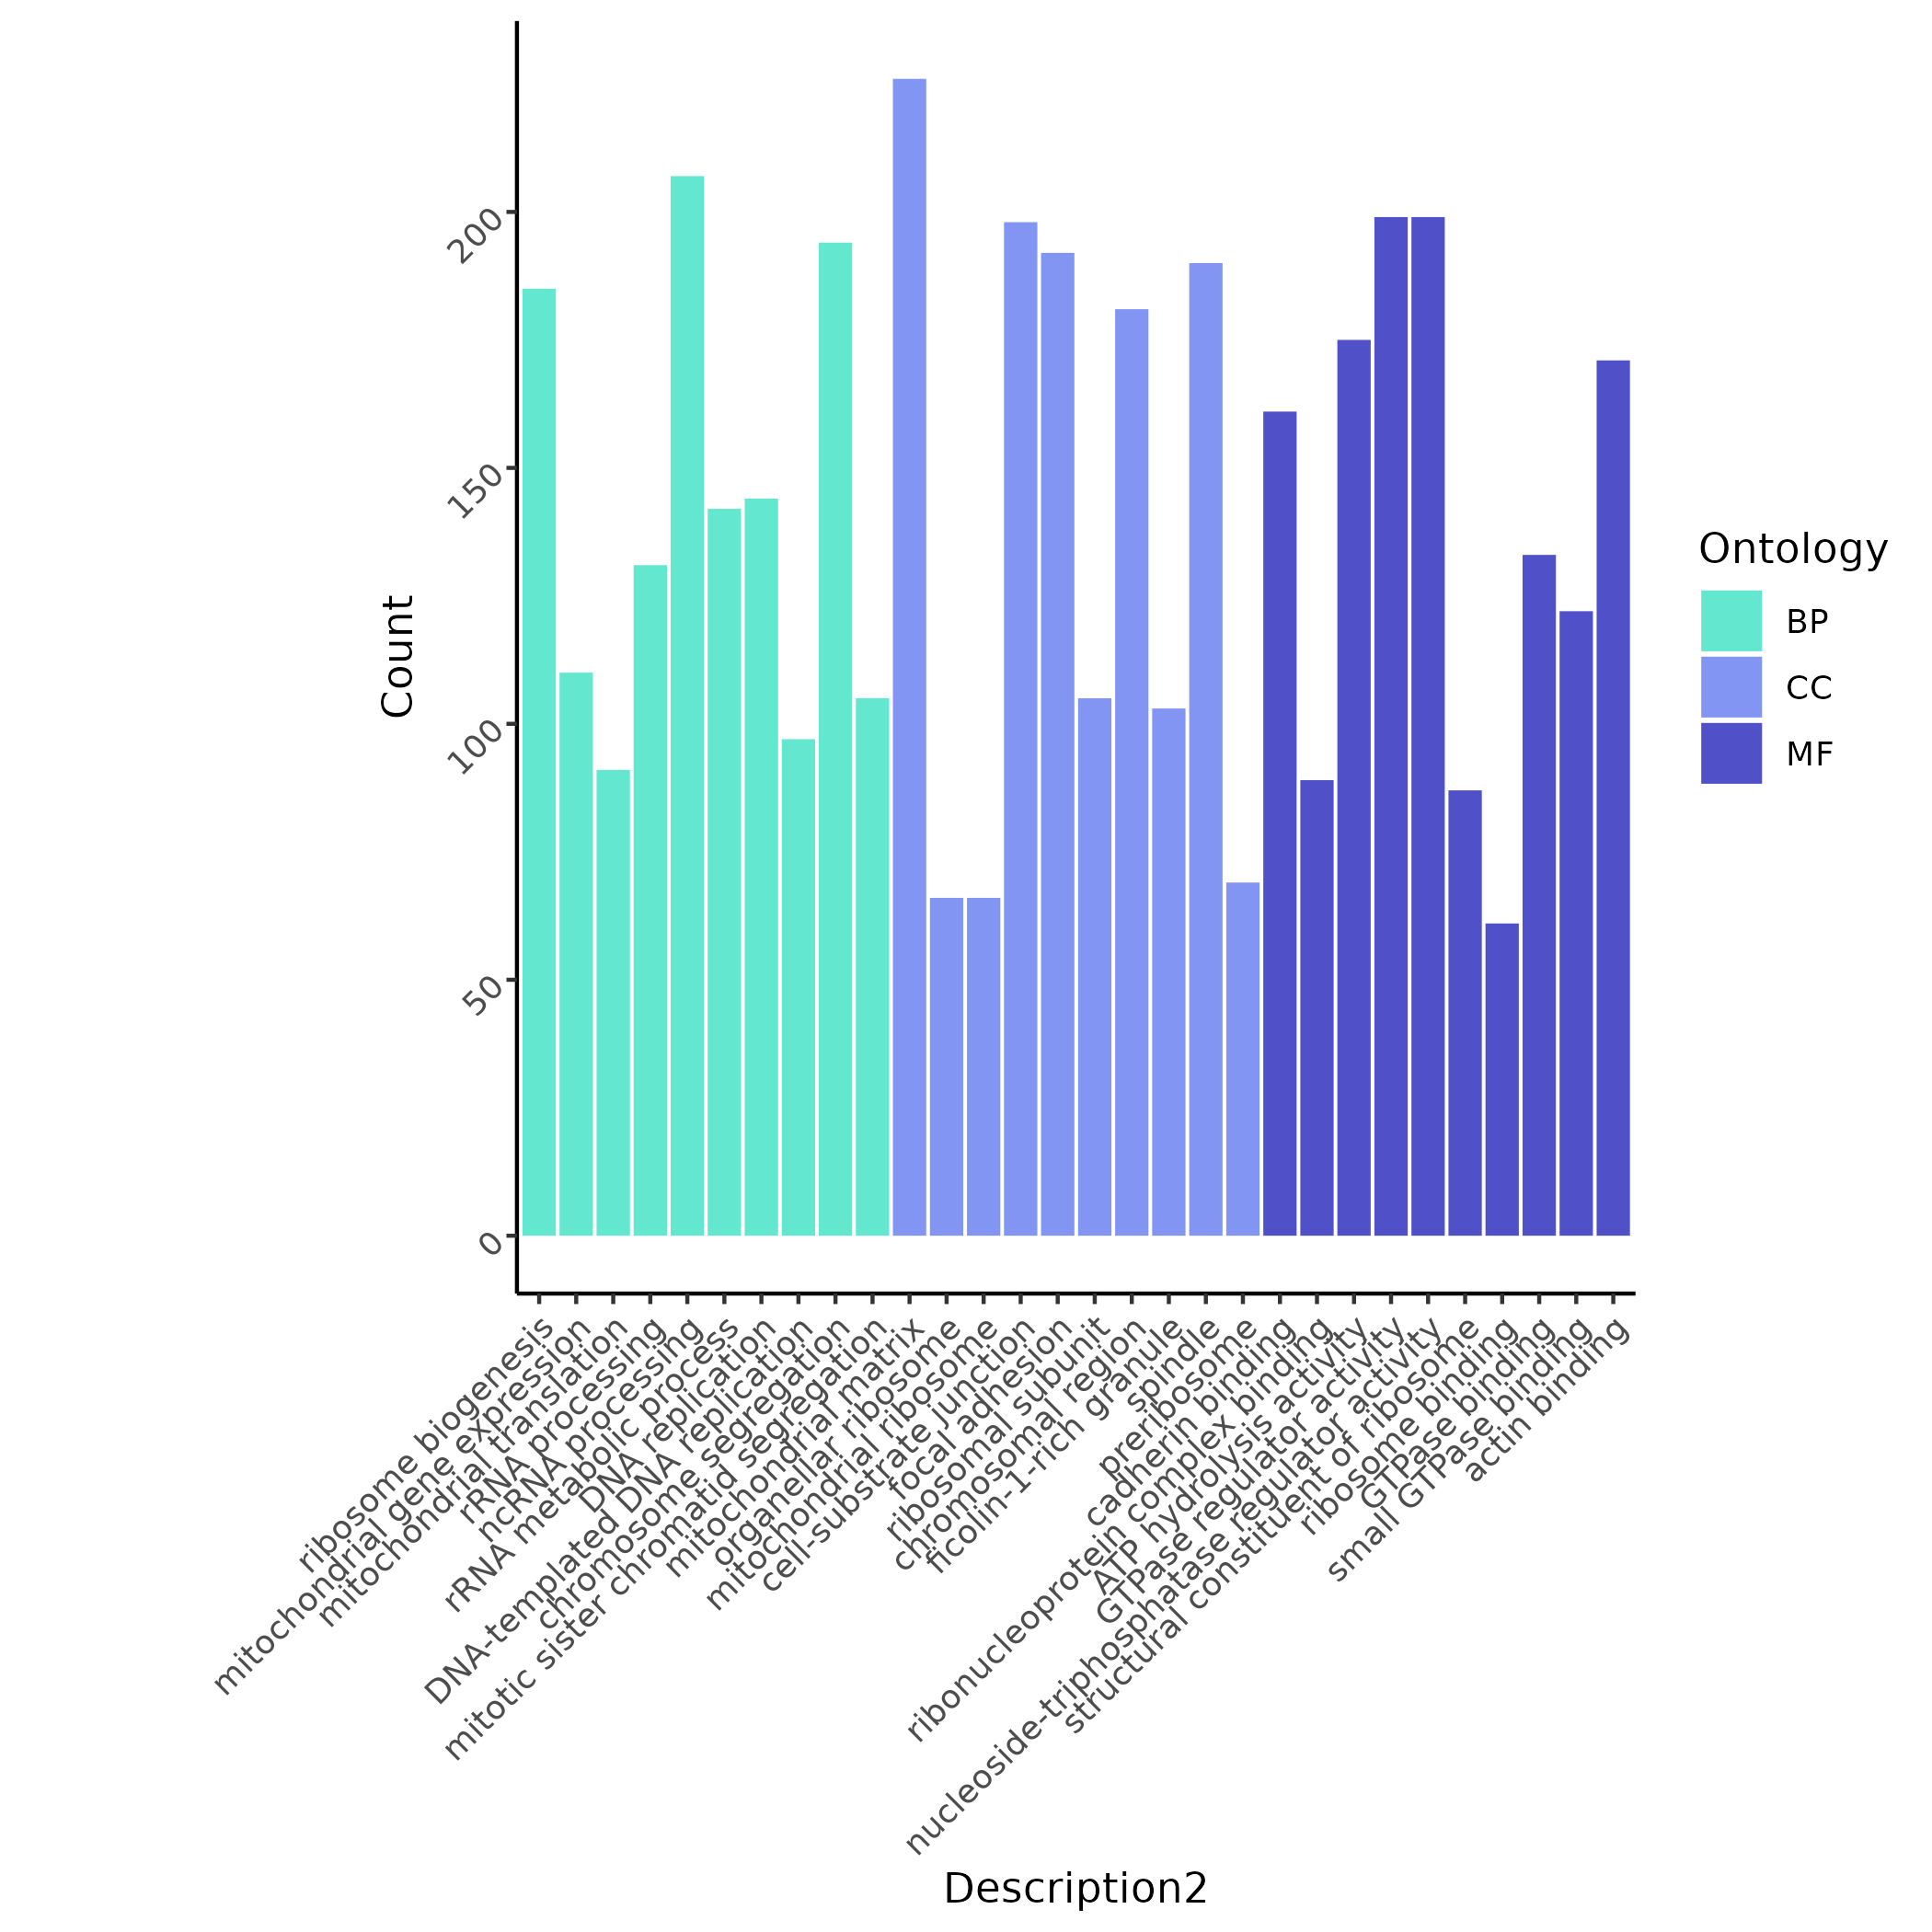
Multi-sample differential analysis shows that RALY-mutant Basophils are enriched in ribosomal/mitochondrial processes such as ribosome biogenesis and mitochondrial gene expression.
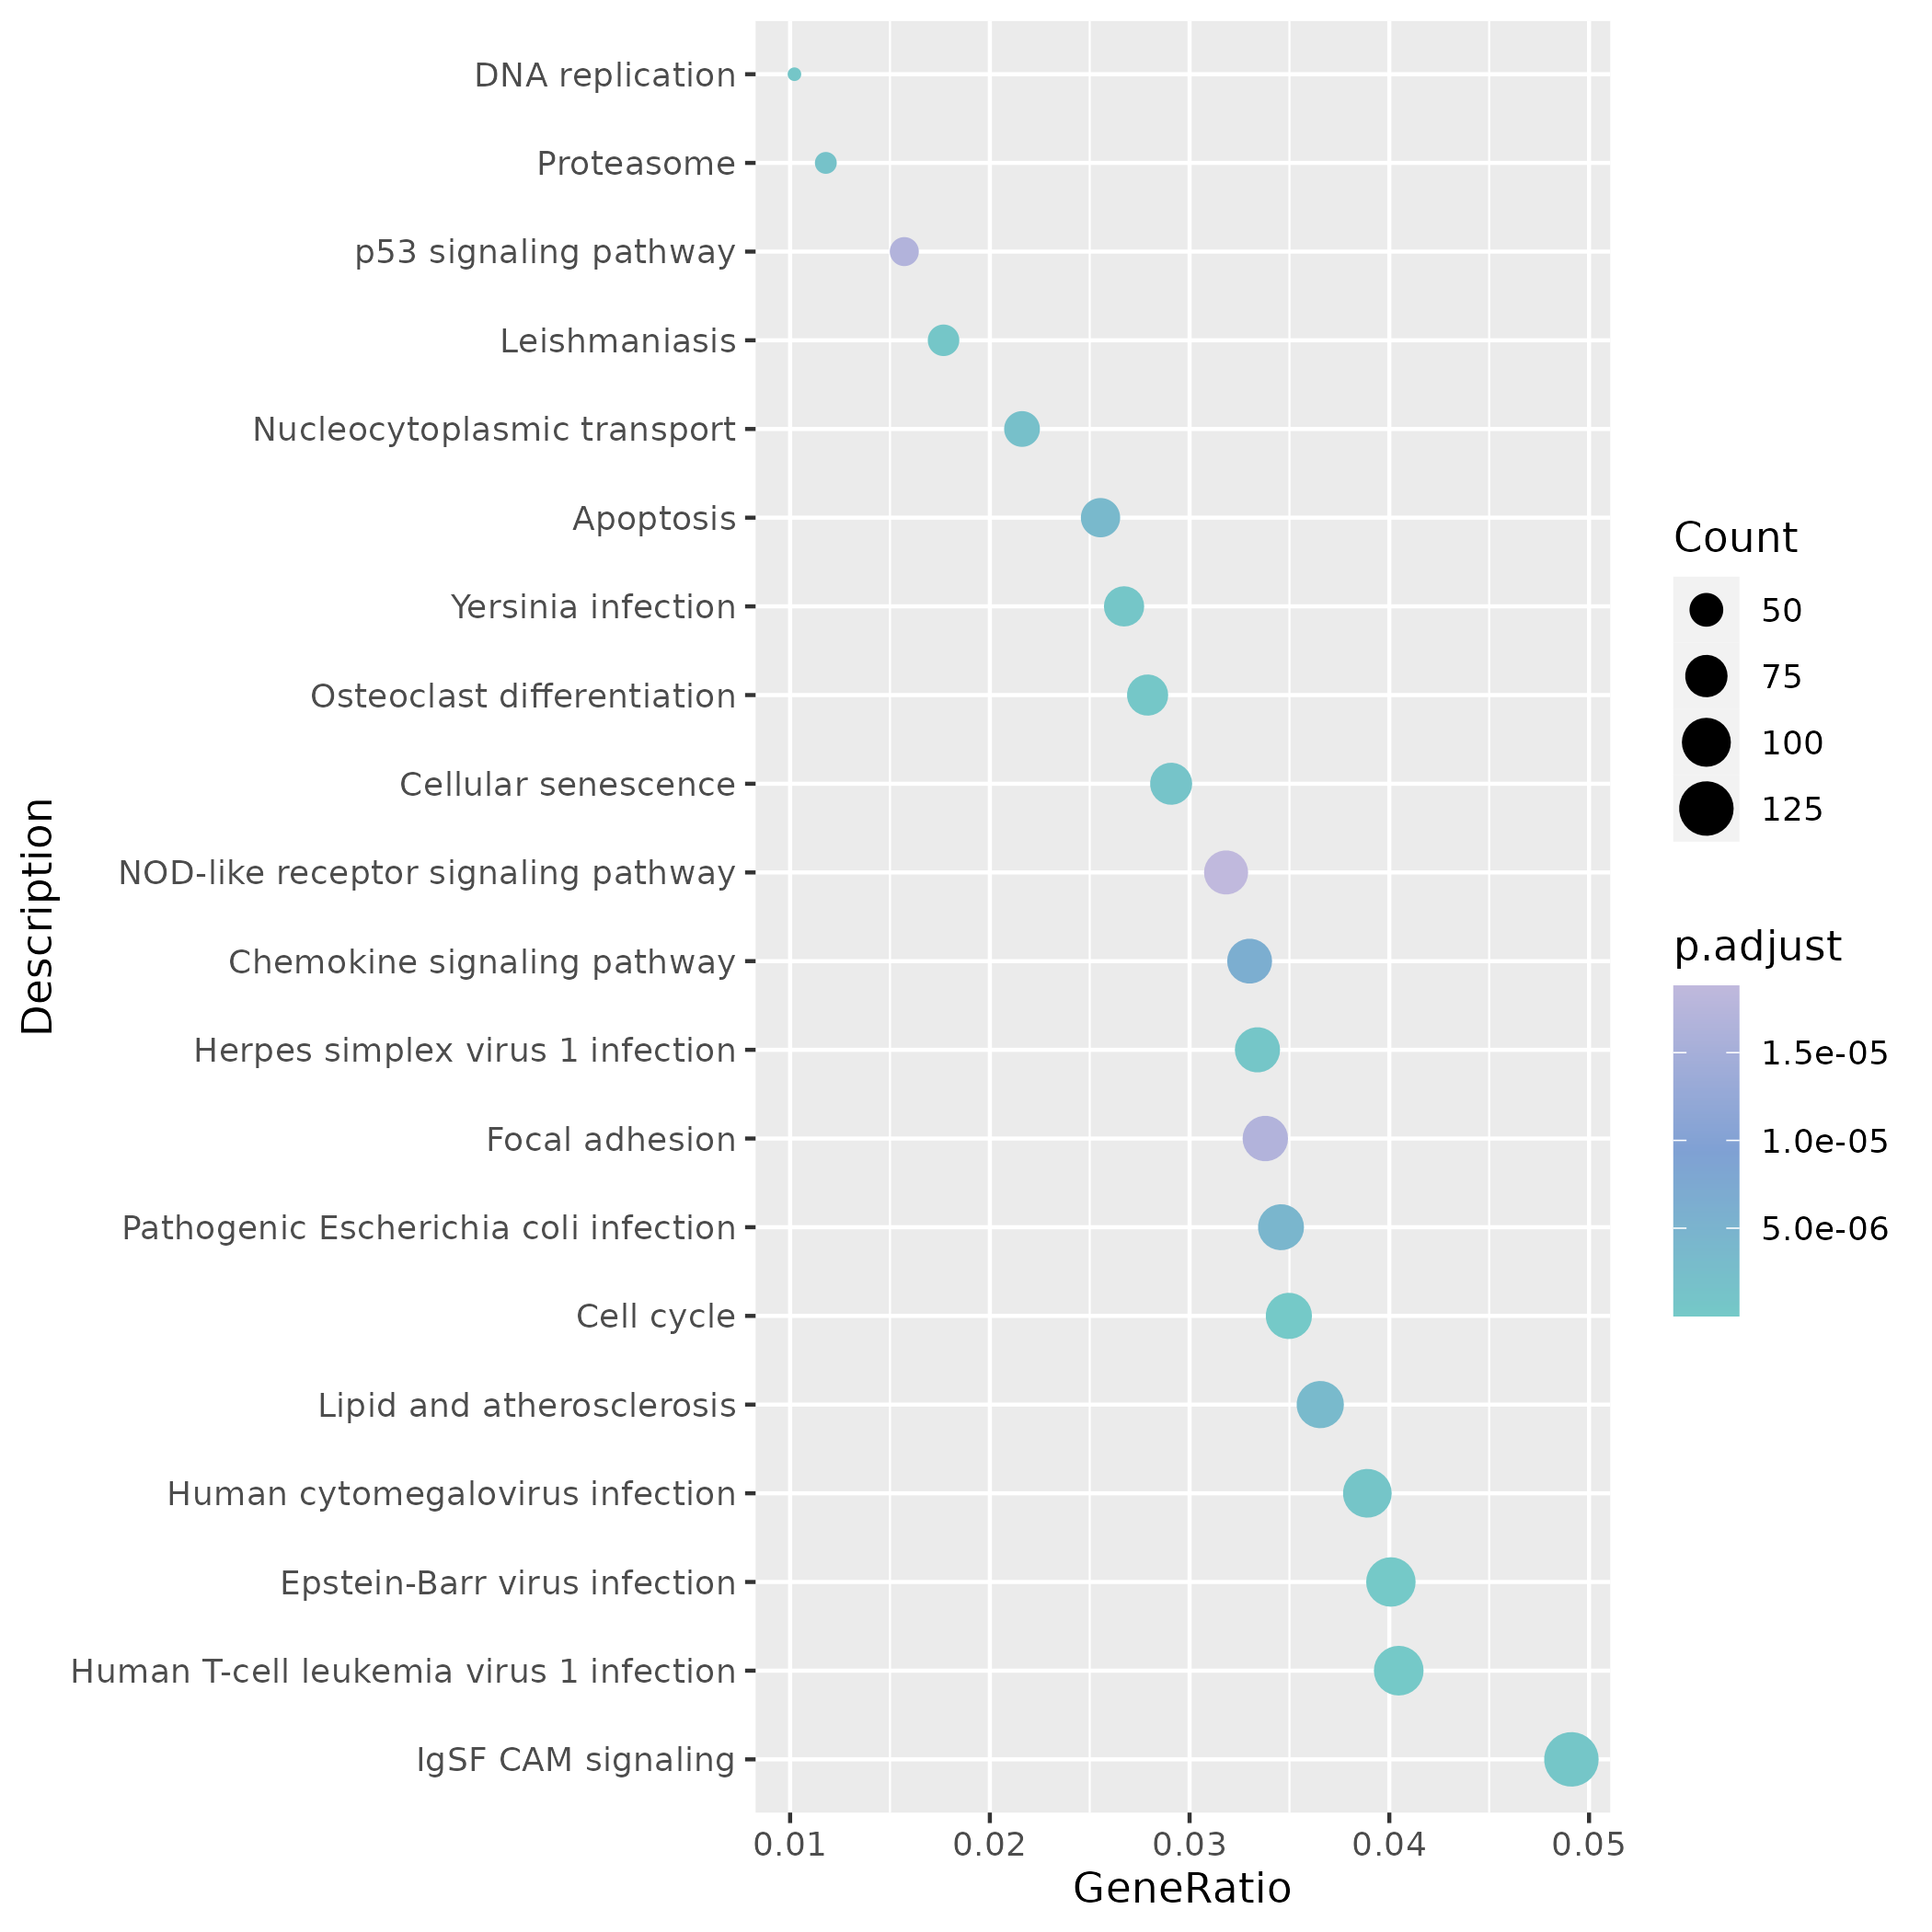
In terms of KEGG, the same site highlights proliferation-related pathways such as DNA replication and Cell cycle, suggesting that these mutant cells have high synthetic activity.
Common Variation View
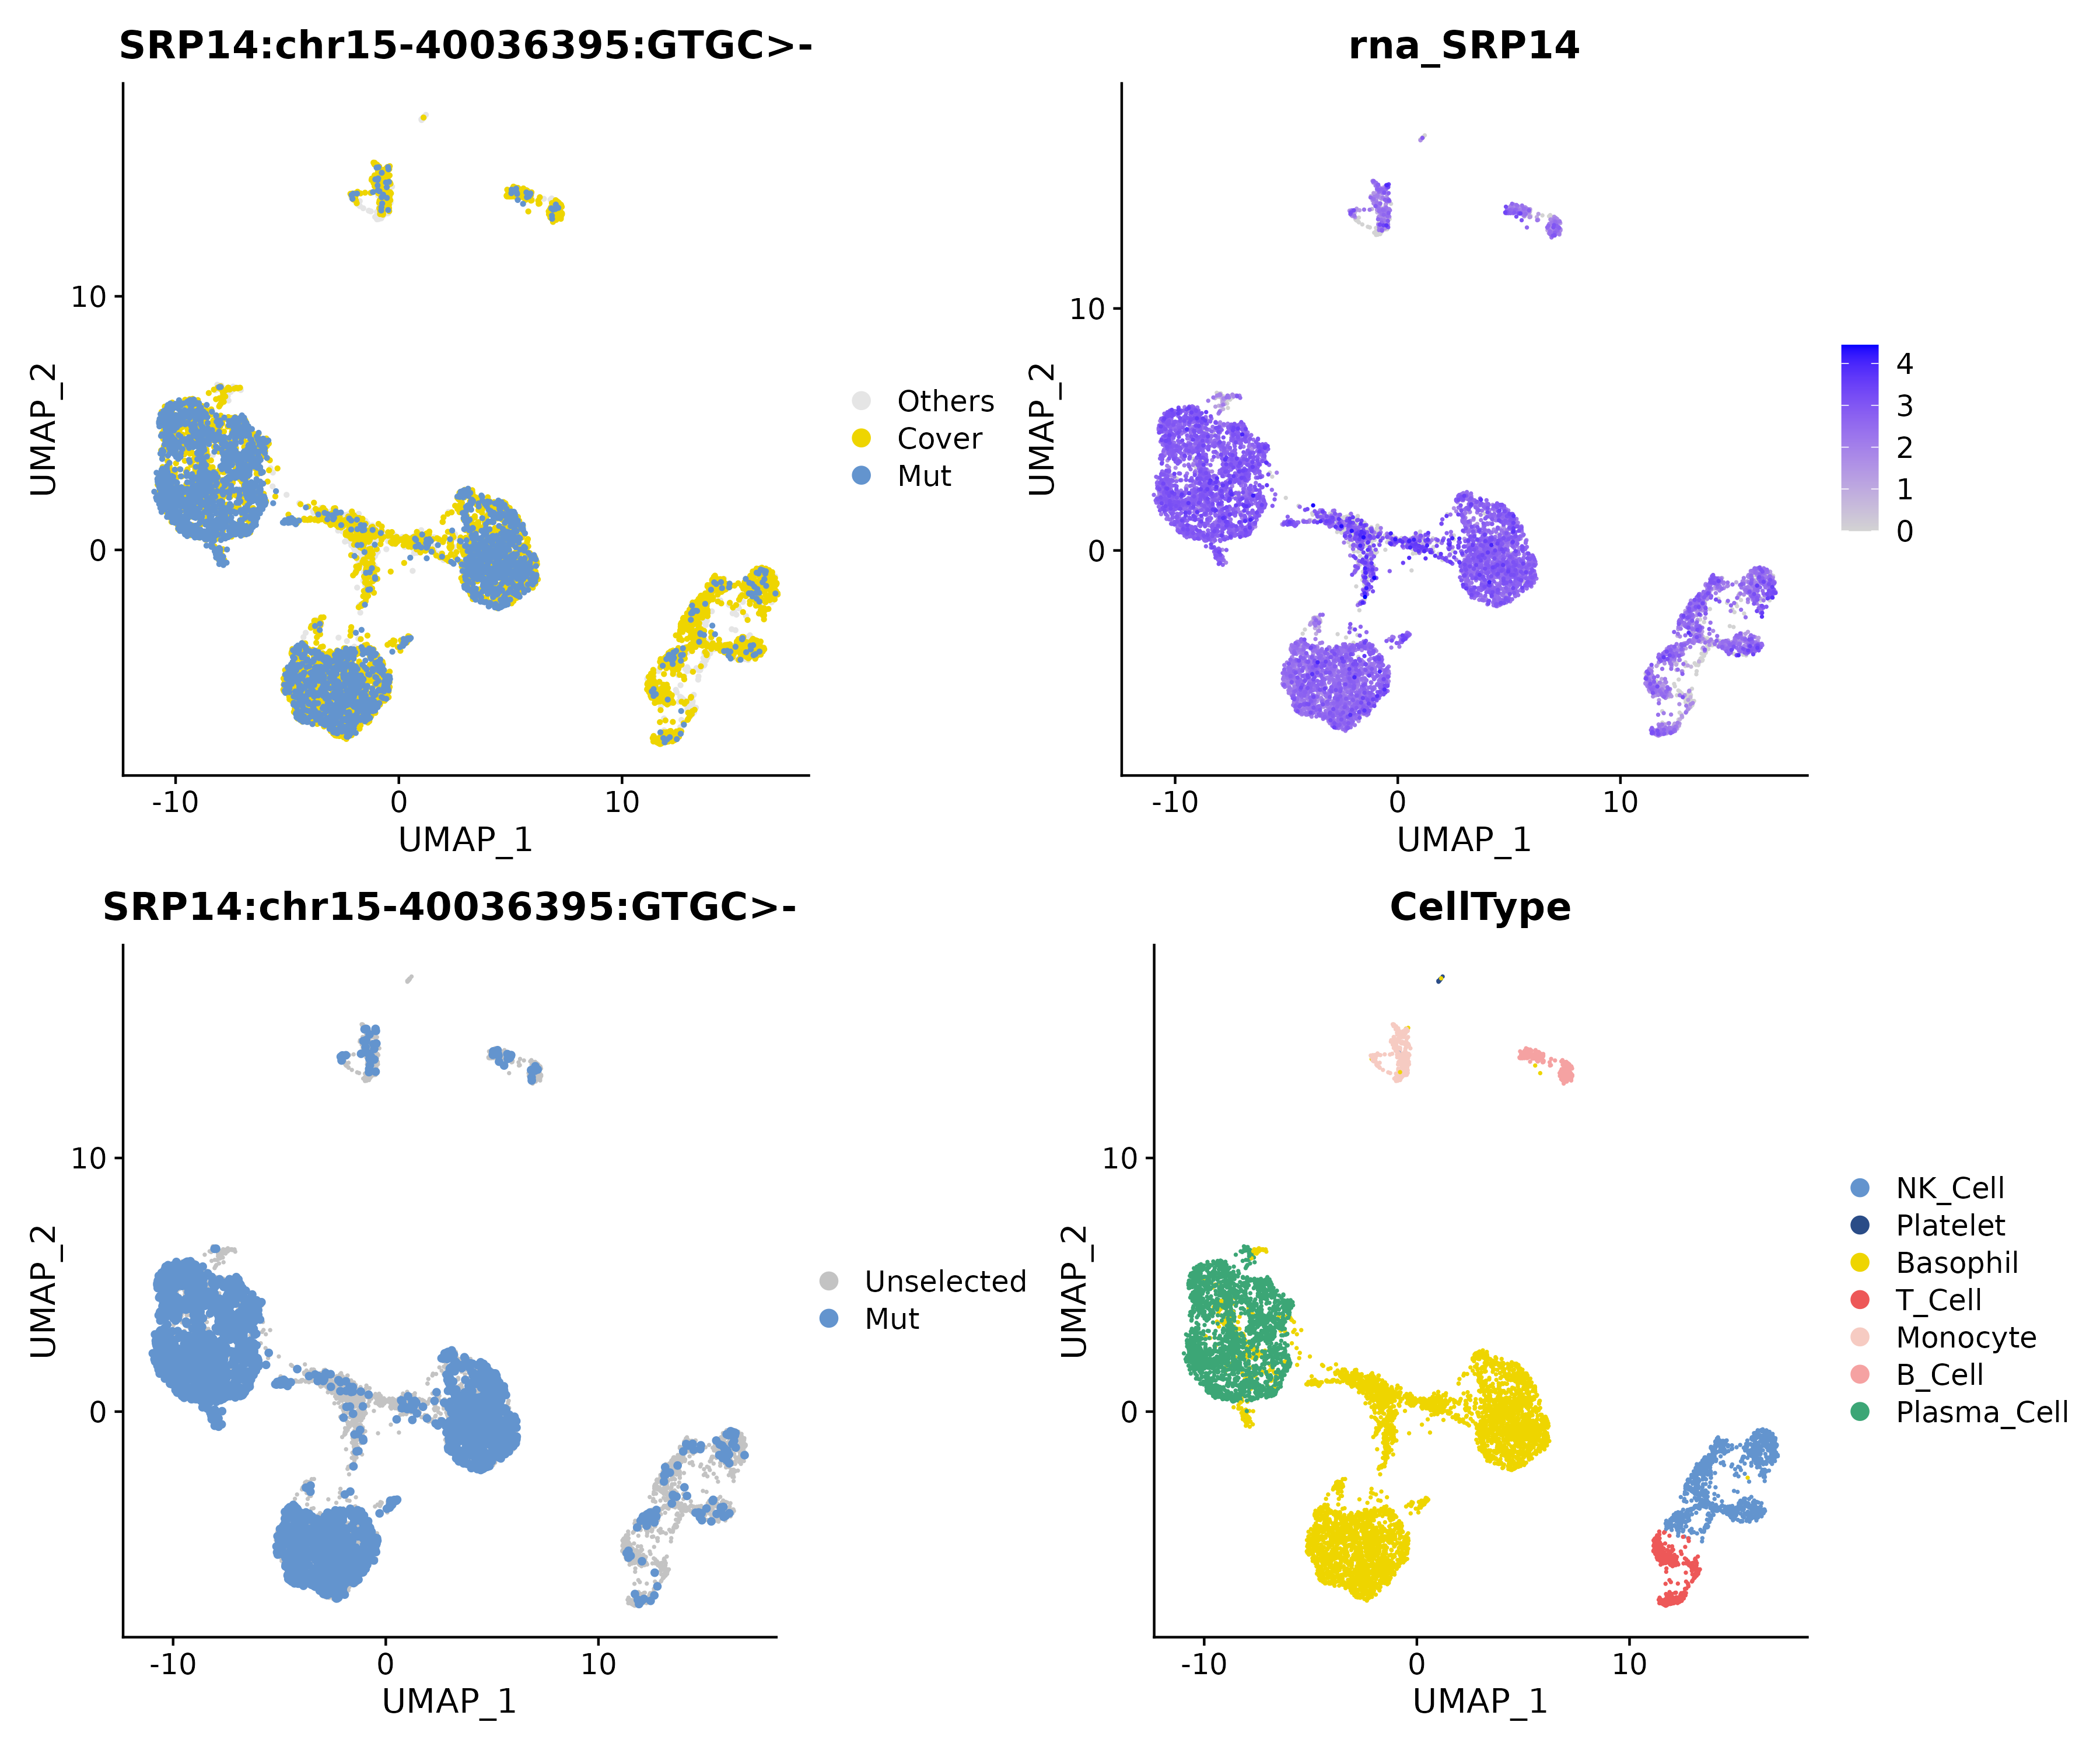
The
commonmatrix emphasizes the mutationSRP14 chr15-40036395 GTGC>-that exists in all samples, showing consistent enrichment in Plasma Cells.
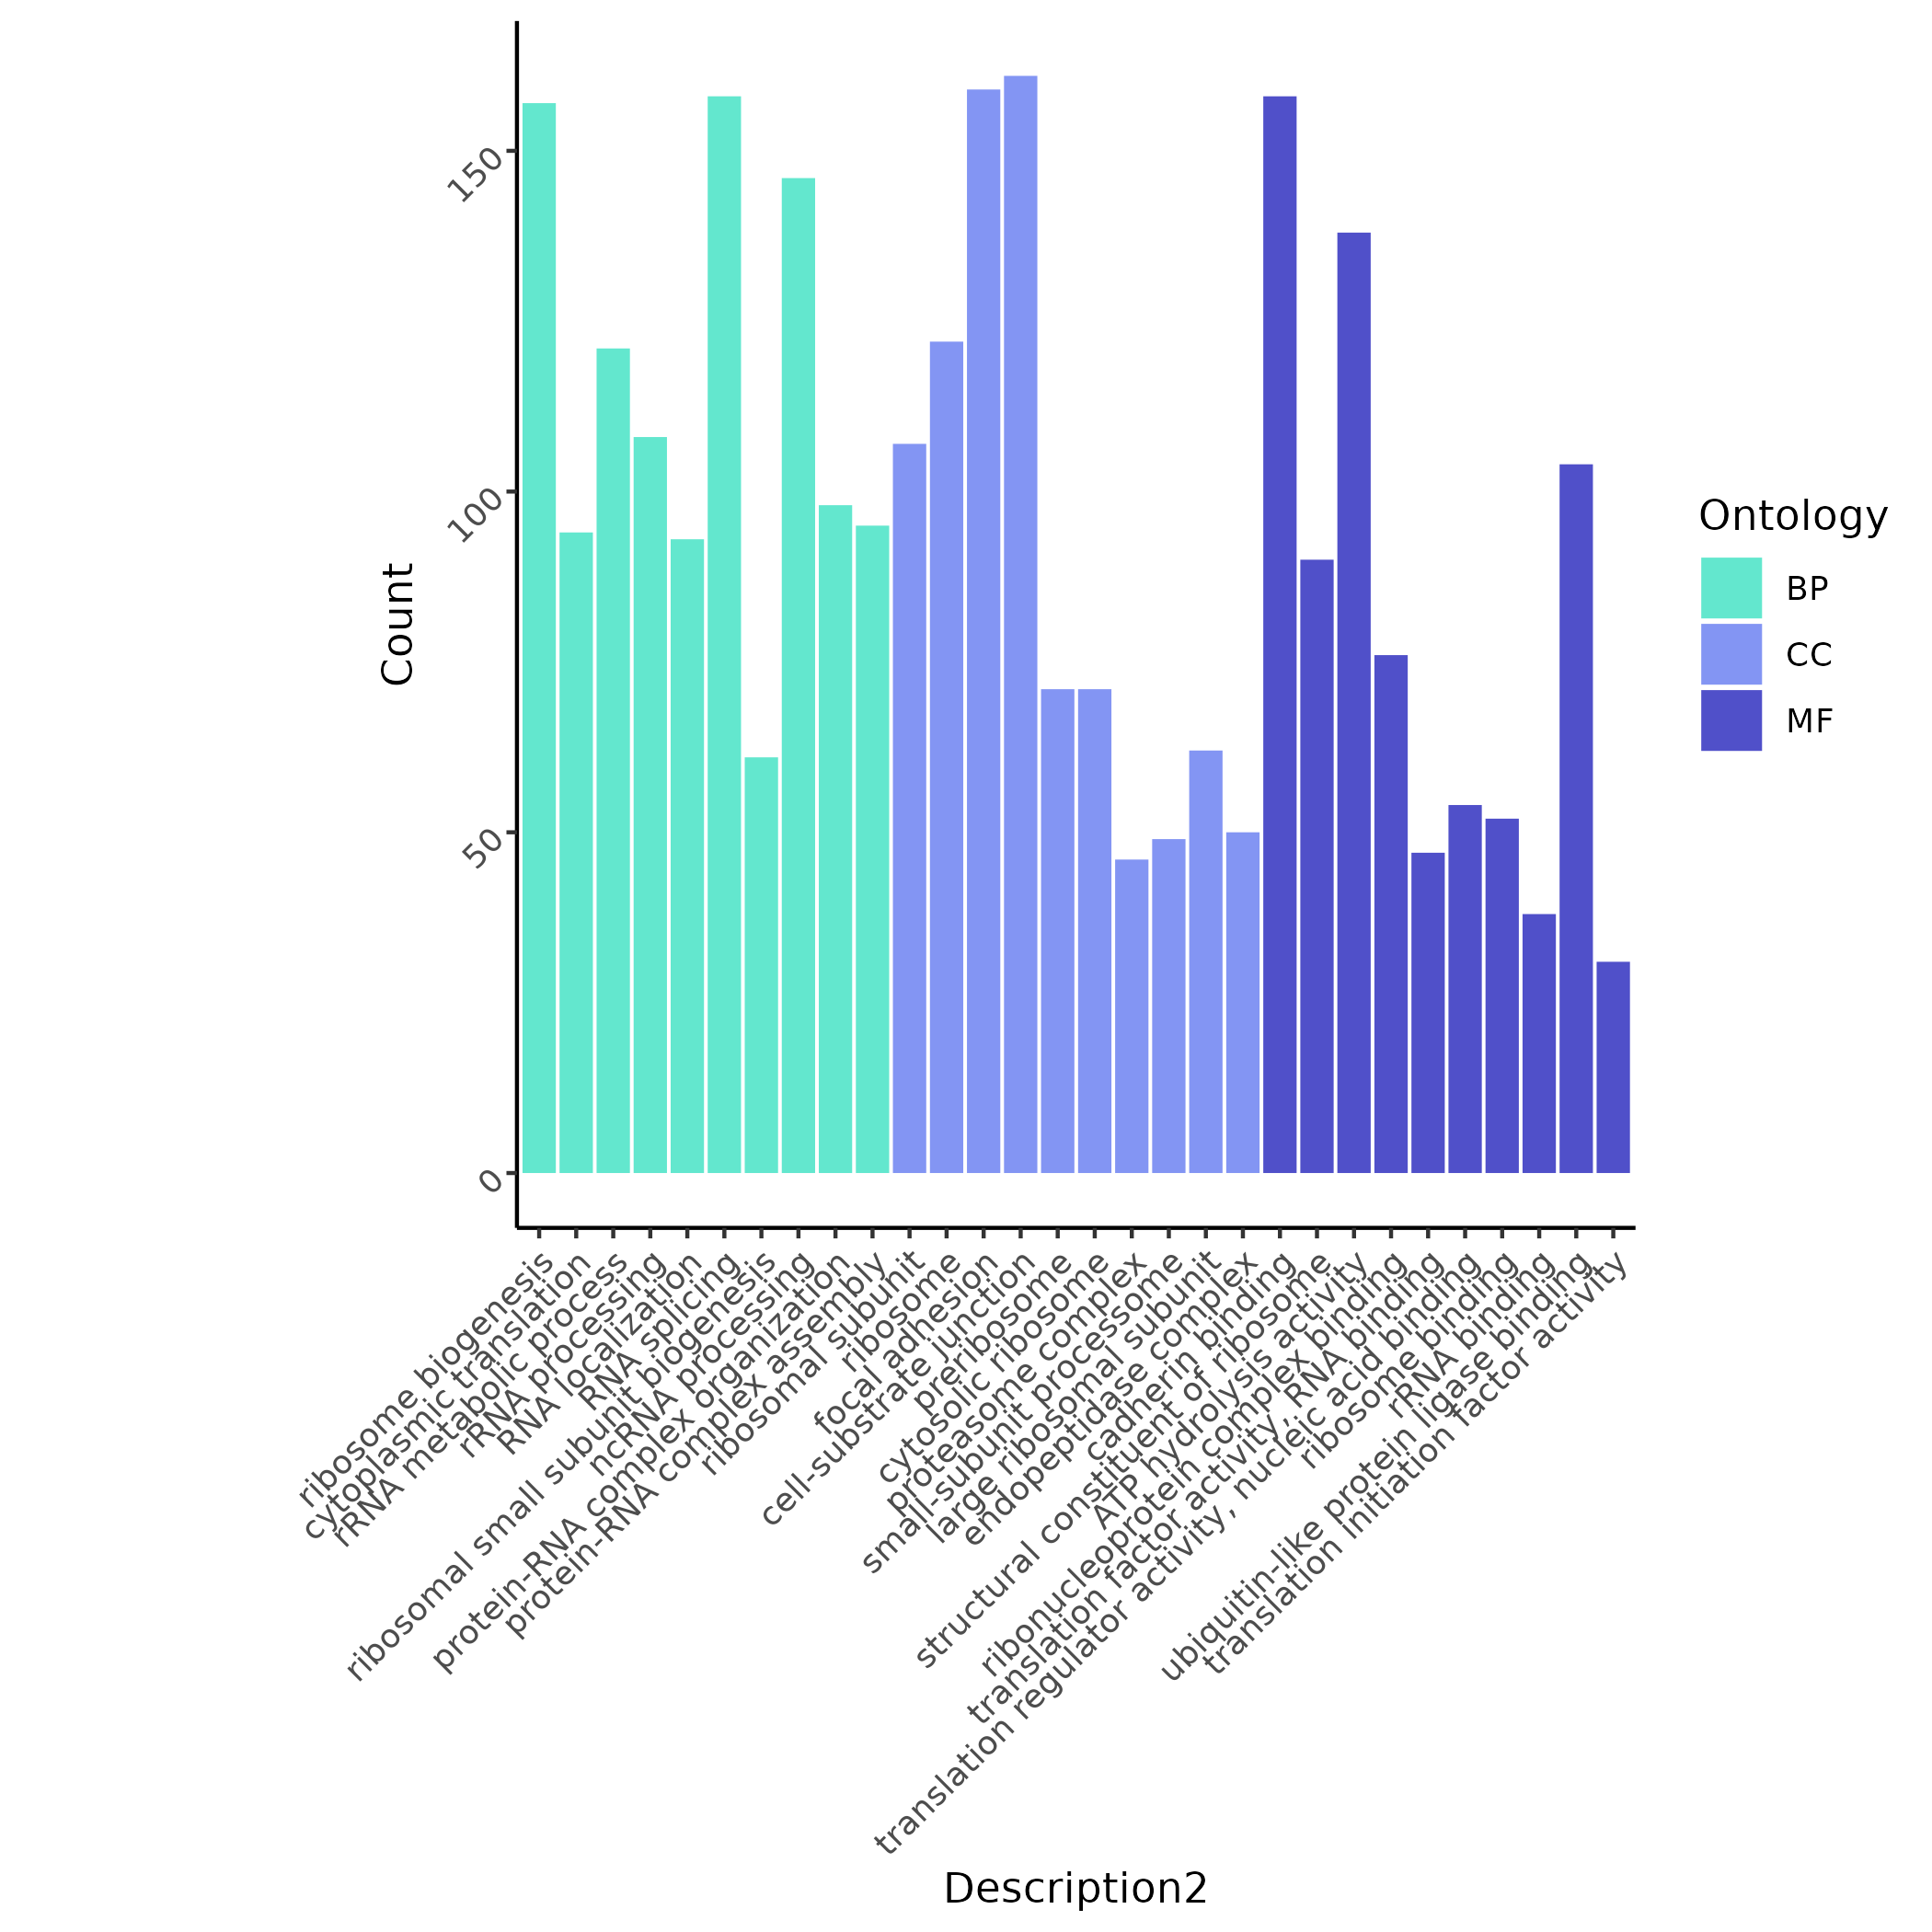
SRP14 mutation-related cells are mainly enriched in transcription/translation processes such as ribosome biogenesis and RNA processing.
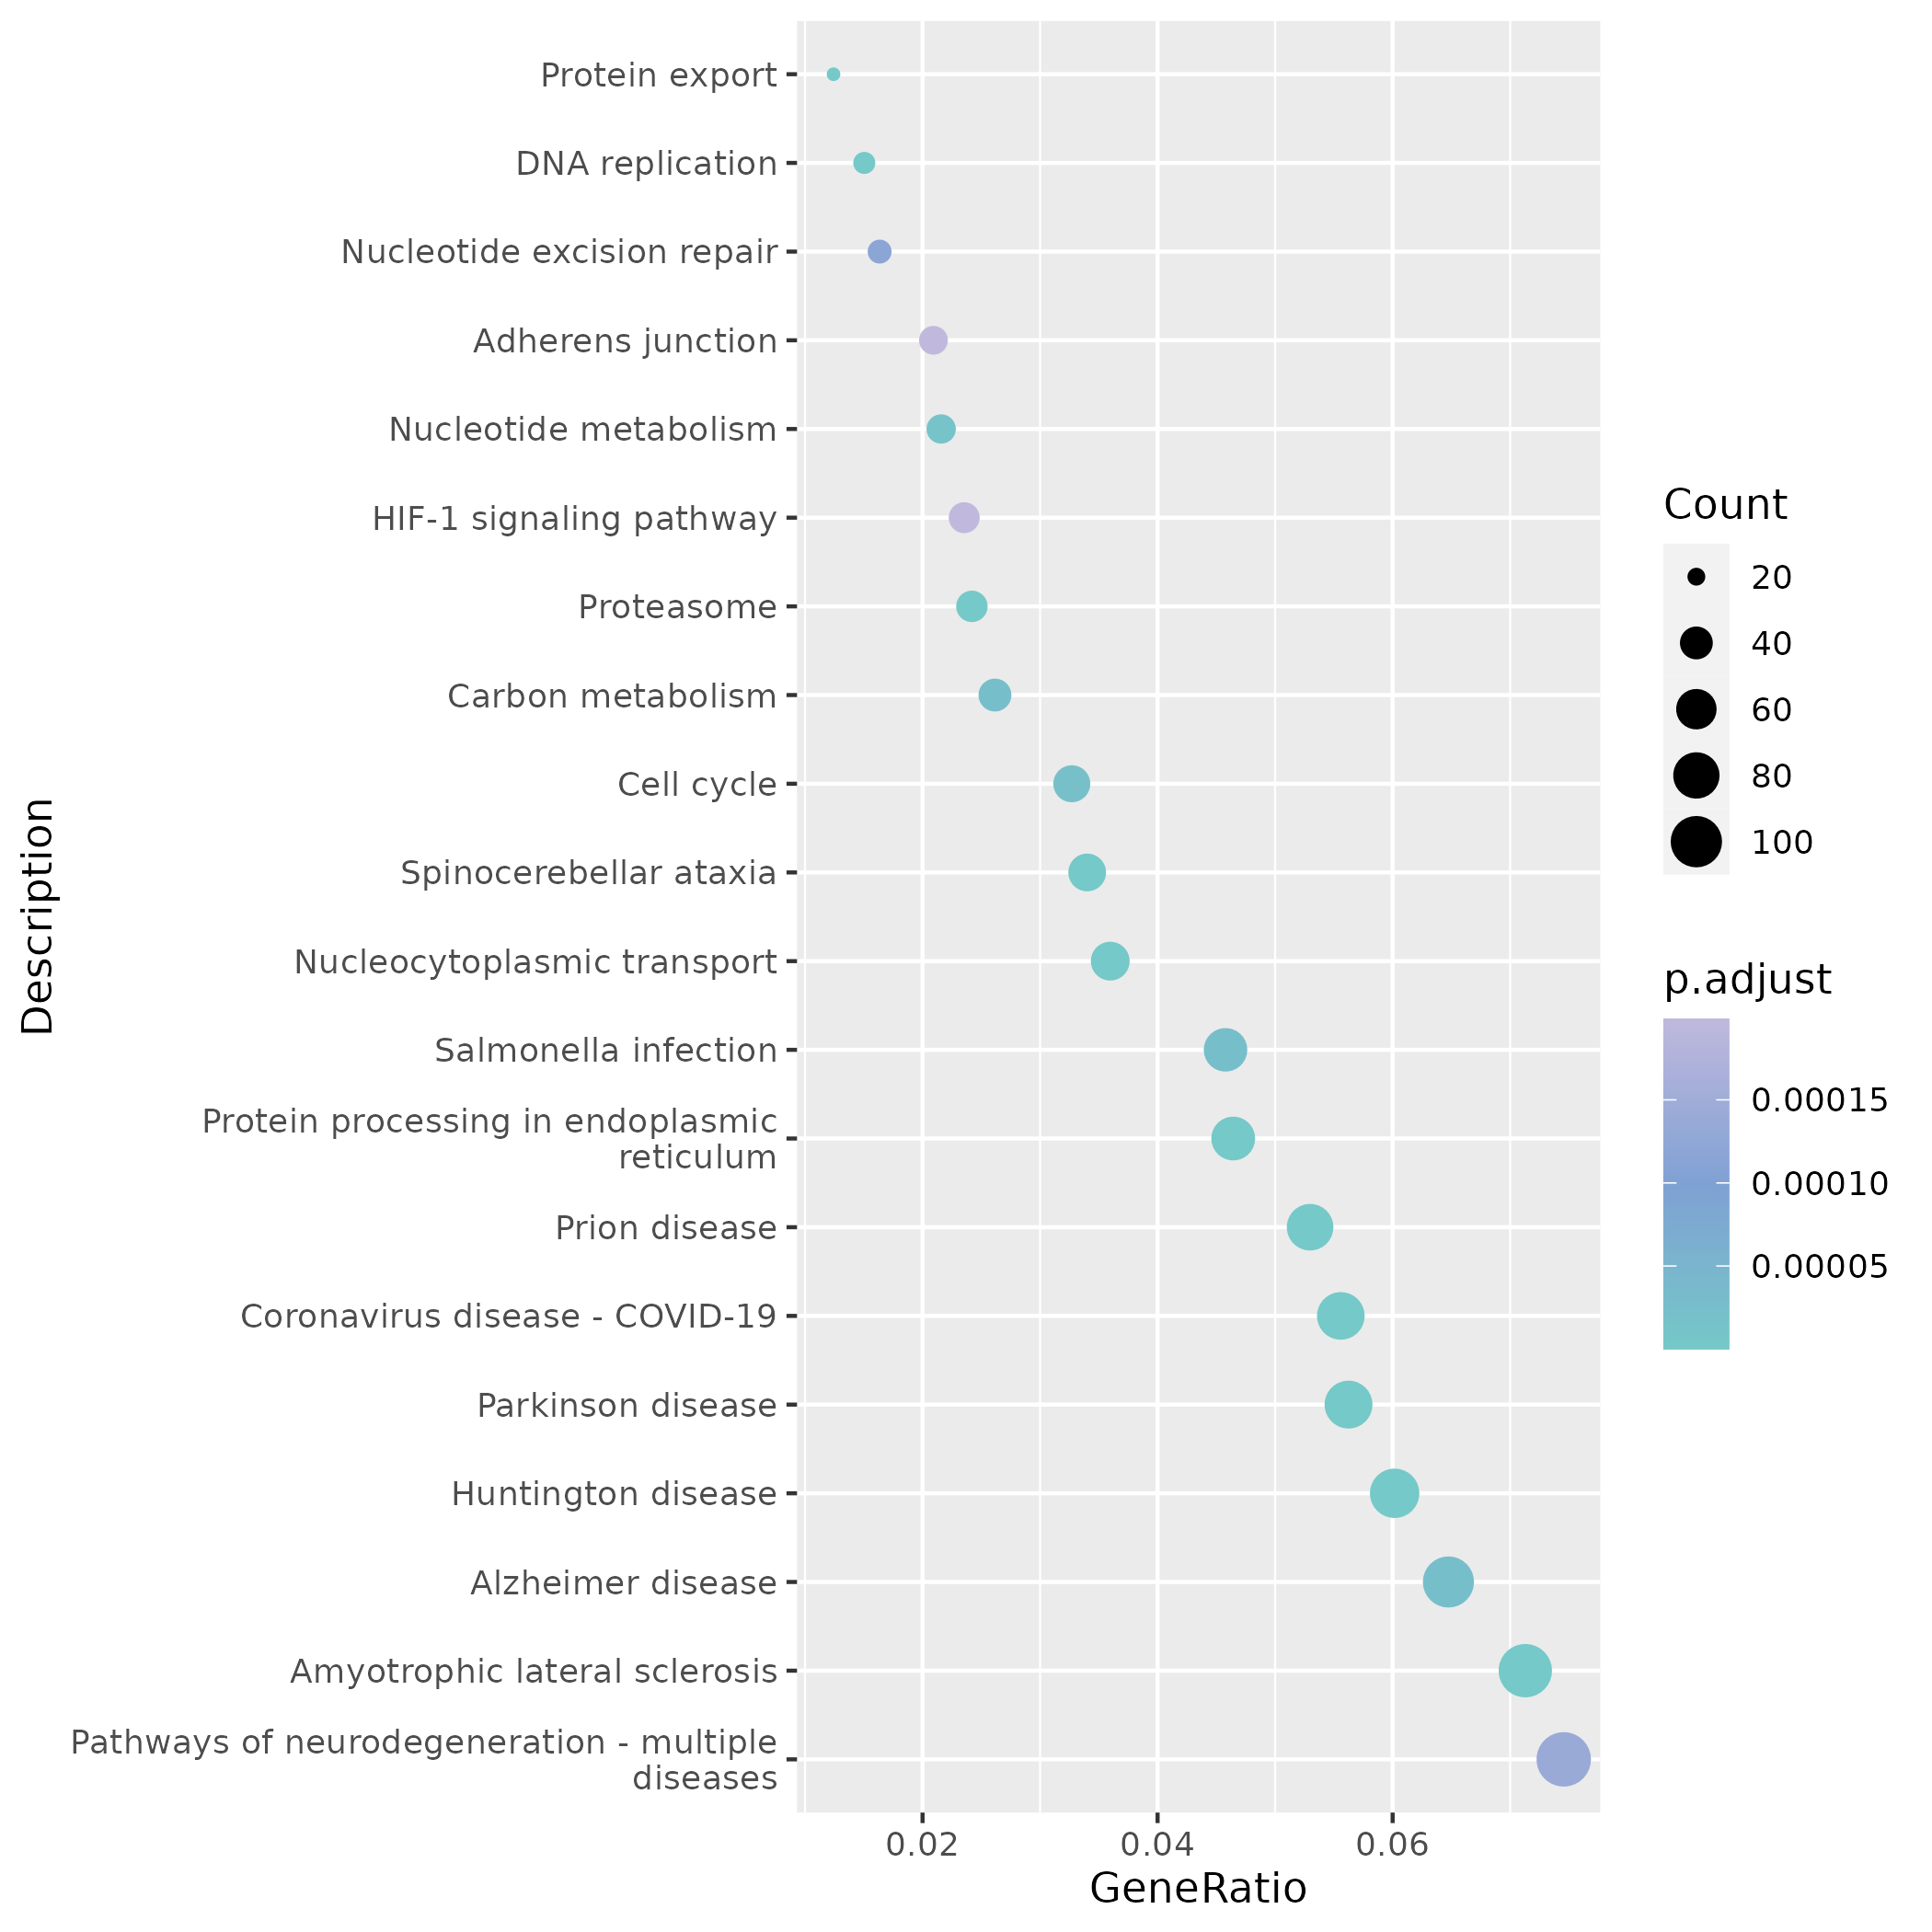
KEGG results emphasize basic molecular machinery such as Ribosome and Spliceosome, deepening the understanding of the functional background of common mutations.
Case Reference: Latest Single-cell Mutation Practices
The workflow of the mut module is consistent with high-impact research in recent years. Take the single-cell multi-omics study of hepatoblastoma (HB) published by Roehrig A et al. in Nature Communications (2024, 15:3031) as an example:
- Hepatoblastoma Clonal Evolution and Chemotherapy Response Study
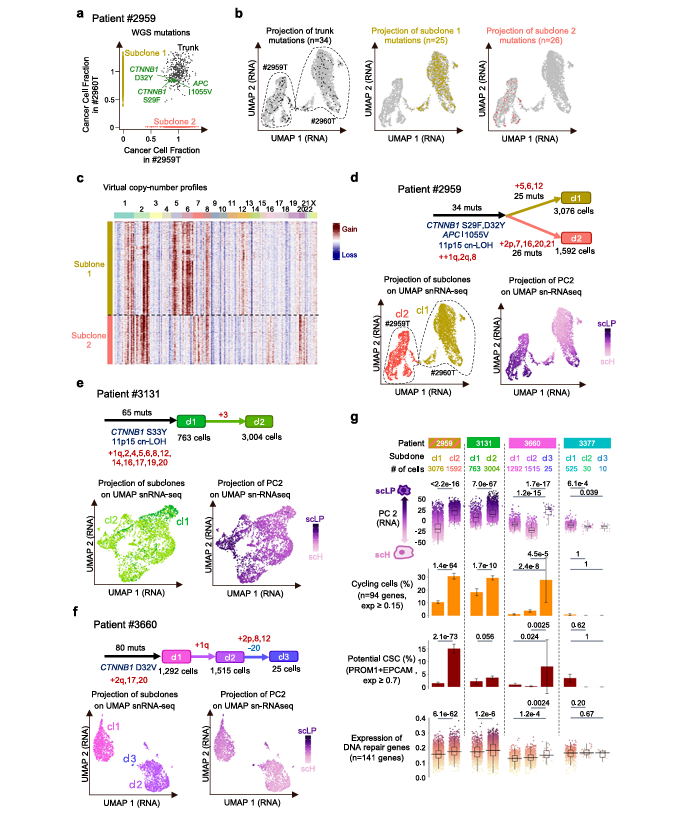
- In their research, Roehrig A et al. achieved reconstruction of HB tumor clonal architecture and mutation localization at the single-cell level through single-cell multi-omics (snRNA-seq + snATAC-seq) combined with whole-genome sequencing (WGS) —— this highly aligns with the mut module's analytical logic of "mutation - cell population - function". The study first used WGS to identify key driver mutations in HB (such as CTNNB1 activating mutations, copy-neutral loss of heterozygosity at 11p15.5, cnLOH), and then mapped these mutations to specific cell subsets through single-cell data to clarify the differentiation status range of each genetic subclone (such as scH hepatocyte-like, scLP liver progenitor-like, scM mesenchymal-like).
- Similarly, in mut module analysis, cell subsets significantly enriched for specific mutations can be located through Fisher's exact test (corresponding to "subclone differentiation status analysis" in the literature). For example, if CTNNB1 mutations are detected to be significantly enriched in the scLP subset in HB samples, differential expression analysis can be further performed between this mutant cell population and wild-type cells, usually observing the characteristics mentioned in the literature such as "high expression of stem cell markers (like PROM1) and DNA repair genes"; subsequent KEGG pathway enrichment can verify whether these mutations activate cell cycle, DNA repair-related pathways (such as the functional association of faster proliferation of scLP subclones after chemotherapy mentioned in the literature), thereby revealing the impact mechanism of mutations on tumor cell chemoresistance.
Recommended practice workflow is:
- Mutation Localization: Use
*_mut.infoandSNV_diffto identify SNVs significantly enriched within specific celltype/cluster. - Functional Evaluation: Perform differential analysis + GO/KEGG/Reactome enrichment on these sites to observe whether they are concentrated in cell cycle, immune pathways or metabolic pathways.
- Result Delivery: Export images and tables through the report module, connect the "mutation-cell type-functional pathway" chain, and incorporate it into project reports or papers.
In this way, we can understand tumor heterogeneity at single-cell resolution and provide deeper insights for precision medicine.
Precautions and Best Practices
WARNING
The mut workflow does not perform variant detection, only analyzes matrices output from upstream processes; if the matrix quality is poor or sample barcodes do not match, it will directly affect enrichment results.
- Reasonable Sample Screening: Single-cell samples vary greatly, it is recommended to prioritize projects with sufficient coverage (≥3k cells, UMI depth >20k) and accurate meta annotations.
- Multi-sample Interpretation: The results of multi and common have different meanings — the former displays all mutations, while the latter emphasizes "cross-sample consistent" hotspots; the report has presented them in separate chapters.
FAQ (Frequently Asked Questions)
Q: Why does it prompt "mutation matrix and RDS barcode do not match"?
A: This is usually because the upstream matrix retains suffixes like_1or-1. The mut process will attempt to match, but it will report an error if there is no overlap at all (setdiff=all). Please confirm whether the matrix column names are consistent with the Seurat object or can be matched by suffix.Q: No results for differential enrichment?
A: Two conditions need to be met:species ∈ {human, mouse}and there must be at least one site withp_val < 0.05inSNV_diff. You can confirm the species when uploading parameters or relaxgroup_input_nameto obtain more significant sites.Q: Why is the "common variation" section empty in the report?
A: In multi-sample projects, if there are no common sites between different samples (common_alt_posis empty), thecom_mutsection will only display prompt information. You can check whether all matrices share the sameposcolumn.
References
- Skinnider MA, et al. Cell type prioritization in single-cell data. Nat Biotechnol. 2021, 39(4):436-447.
- Courtine G, et al. The neurons that restore walking after paralysis. Nature. 2022, 607(7918):313-319.
- Roehrig A, et al. Single-cell multiomics reveals the interplay of clonal evolution and cellular plasticity in hepatoblastoma. Nature Communications. 2024, 15:3031.