SeekSpace 空间转录组可视化:基础绘图与参数配置
时长: 10 分钟
字数: 1.8k 字
更新: 2026-02-28
阅读: 0 次
R
# 加载R包
suppressMessages({
    library(Seurat)
    library(tidyverse)
    library(ggplot2)
})
R
# 读取数据
input <- readRDS("/home/demo-seekgene-com/workspace/data/AY1756127460073/input.rds")
meta <- read.table("/home/demo-seekgene-com/workspace/data/AY1756127460073/meta.tsv", header=TRUE, sep="\t", row.names = 1)
obj <- AddMetaData(input,meta)
head(obj@meta.data)
str(obj@misc$info)| orig.ident | nCount_RNA | nFeature_RNA | mito | Sample | raw_Sample | resolution.0.8_d30 | resolution.0.5_d30 | CellAnnotation | all | Sub_CellType | Main_CellType | SS | spatial_clustering | auto | |
|---|---|---|---|---|---|---|---|---|---|---|---|---|---|---|---|
| <chr> | <int> | <int> | <dbl> | <chr> | <chr> | <int> | <int> | <chr> | <chr> | <chr> | <chr> | <chr> | <chr> | <chr> | |
| AAGGAATGCTGATTCGTTTCTGCGCTC | XYRD_WTH1092_expression | 300 | 163 | 4.6667 | WTH1092_expression | XYRD_WTH1092_expression | 0 | 0 | Neurons | all | Unknown | Unknown | undefined | undefined | Neurons |
| ACCGTTCTACAGCCATGTAGTCATACG | XYRD_WTH1092_expression | 300 | 204 | 1.0000 | WTH1092_expression | XYRD_WTH1092_expression | 6 | 6 | Astrocytes | all | Endo | Endo | undefined | undefined | Astrocytes |
| ACTCTCGTACGTCGTCCAAGGCACTAT | XYRD_WTH1092_expression | 300 | 170 | 1.6667 | WTH1092_expression | XYRD_WTH1092_expression | 0 | 0 | Neurons | all | Unknown | Unknown | undefined | undefined | Neurons |
| AGCTACAATGGAAAGGTGGACTGTGGA | XYRD_WTH1092_expression | 300 | 179 | 3.3333 | WTH1092_expression | XYRD_WTH1092_expression | 19 | 19 | Neurons | all | Ext_Thal_Unk | Ext | undefined | undefined | Neurons |
| AGGACGACGAGATAAACTAGTCATACG | XYRD_WTH1092_expression | 300 | 166 | 4.6667 | WTH1092_expression | XYRD_WTH1092_expression | 19 | 19 | Neurons | all | Ext_Thal_Unk | Ext | undefined | undefined | Neurons |
| AGGCATTTACCGAACTGTTCTGCGCTC | XYRD_WTH1092_expression | 300 | 231 | 0.3333 | WTH1092_expression | XYRD_WTH1092_expression | 2 | 1 | Neurons | all | Inh | Inh | undefined | undefined | Neurons |
List of 1
 $ WTH1092_expression:List of 6
  ..$ img      : chr "data:;base64,iVBORw0KGgoAAAANSUhEUgAAD6AAAAWnCAAAAAByYdMoAAAgAElEQVR4AezBaa9l6WGe5/t537X22vOZ6lSdququrh5IdpMiRU"| __truncated__
  ..$ img_gg   :List of 12
  .. ..$ raster     : 'raster' chr [1:1447, 1:4000] "#000000" "#000000" "#000000" "#000000" ...
  .. ..$ x          : 'simpleUnit' num 0.5npc
  .. .. ..- attr(*, "unit")= int 0
  .. ..$ y          : 'simpleUnit' num 0.5npc
  .. .. ..- attr(*, "unit")= int 0
  .. ..$ width      : 'simpleUnit' num 1npc
  .. .. ..- attr(*, "unit")= int 0
  .. ..$ height     : 'simpleUnit' num 1npc
  .. .. ..- attr(*, "unit")= int 0
  .. ..$ just       : chr "centre"
  .. ..$ hjust      : NULL
  .. ..$ vjust      : NULL
  .. ..$ interpolate: logi FALSE
  .. ..$ name       : chr "GRID.rastergrob.708"
  .. ..$ gp         : list()
  .. .. ..- attr(*, "class")= chr "gpar"
  .. ..$ vp         : NULL
  .. ..- attr(*, "class")= chr [1:3] "rastergrob" "grob" "gDesc"
  ..$ size_x   : int 55128
  ..$ size_y   : int 19906
  ..$ img_he   : chr "data:;base64,iVBORw0KGgoAAAANSUhEUgAALuAAABD1CAIAAAB1YFaBAAAgAElEQVR4AezBwYHoxoJdybjJ8d8BreSnmEdA1SP7qzUGaIGIVT"| __truncated__
  ..$ img_he_gg:List of 12
  .. ..$ raster     : 'raster' chr [1:4341, 1:12000] "#FFFFFF" "#FFFFFF" "#9B9BA1" "#7A7B83" ...
  .. ..$ x          : 'simpleUnit' num 0.5npc
  .. .. ..- attr(*, "unit")= int 0
  .. ..$ y          : 'simpleUnit' num 0.5npc
  .. .. ..- attr(*, "unit")= int 0
  .. ..$ width      : 'simpleUnit' num 1npc
  .. .. ..- attr(*, "unit")= int 0
  .. ..$ height     : 'simpleUnit' num 1npc
  .. .. ..- attr(*, "unit")= int 0
  .. ..$ just       : chr "centre"
  .. ..$ hjust      : NULL
  .. ..$ vjust      : NULL
  .. ..$ interpolate: logi FALSE
  .. ..$ name       : chr "GRID.rastergrob.709"
  .. ..$ gp         : list()
  .. .. ..- attr(*, "class")= chr "gpar"
  .. ..$ vp         : NULL
  .. ..- attr(*, "class")= chr [1:3] "rastergrob" "grob" "gDesc"
R
######################base64转png图函数
Base64ToPng <- function(obj, width_px = 1000) {
  for (i in seq_along(obj@misc$info)) {
    for (j in c("img", "img_he")) {
      val <- obj@misc$info[[i]][[j]]
      if (is.null(val) || is.na(val)) next

      b64 <- stringr::str_remove(val, '^data:[^;]*;base64,')
      img_raw <- base64enc::base64decode(b64)

      grob <- magick::image_read(img_raw) %>%
        magick::image_resize(sprintf("%d>", width_px)) %>%
        grid::rasterGrob(x = 0, y = 0,
                         width = grid::unit(1, "npc"), height = grid::unit(1, "npc"),
                         just = c(0, 0), interpolate = TRUE)

      key <- if (j == "img") "img_gg" else "img_he_gg"
      obj@misc$info[[i]][[key]] <<- grob
    }
  }
  invisible(obj)
}

######################绘图细胞分群函数
ImageSpacePlot = function(obj, group_by, type="DAPI", sample=names(obj@misc$info)[1], size=1, alpha=1,color=MYCOLOR){
    MYCOLOR=c(
          "#6394ce", "#2a4c87", "#eed500", "#ed5858",
          "#f6cbc2", "#f5a2a2", "#3ca676", "#6cc9d8",
          "#ef4db0", "#992269", "#bcb34a", "#74acf3",
          "#3e275b", "#fbec7e", "#ec4d3d", "#ee807e",
          "#f7bdb5", "#dbdde6", "#f591e1", "#51678c",
          "#2fbcd3", "#80cfc3", "#fbefd1", "#edb8b5",
          "#5678a8", "#2fb290", "#a6b5cd", "#90d1c1",
          "#a4e0ea", "#837fd3", "#5dce8b", "#c5cdd9",
          "#f9e2d6", "#c64ea4", "#b2dfd6", "#dbdfe7",
          "#dff2ec", "#cce8f3", "#e74d51", "#f7c9c4",
          "#f29c81", "#c9e6e0", "#c1c5de", "#750000"
          )

        raster_type <- switch(type,
                          HE = "img_he_gg",
                          DAPI = "img_gg",
                          stop("Invalid type. Must be 'HE' or 'DAPI'.")
                             )

        spatial_coord1 <- as.data.frame(obj[[group_by]])
        colnames(spatial_coord1) <- group_by
        spatial_coord2 <- as.data.frame(obj@reductions$spatial@cell.embeddings)
        spatial_coord <-cbind(spatial_coord2,spatial_coord1)


        ImageSpacePlot <- ggplot2::ggplot() + ggplot2::annotation_custom(grob = obj@misc$info[[sample]][[raster_type]],
        xmin = 0, xmax = obj@misc$info[[sample]]$size_x,
        ymin = 0, ymax = obj@misc$info[[sample]]$size_y) +
        ggplot2::geom_point(data = spatial_coord, ggplot2::aes(x = spatial_1,y = spatial_2, color = !!sym(group_by),
                            fill = !!sym(group_by)), size=size, alpha=alpha)+
        labs(size = group_by) + guides(alpha = "none")+
        ggplot2::theme_classic()+
        scale_color_manual(values = color)+ coord_fixed()
    return(ImageSpacePlot)
}

###################绘图基因表达函数
FeatureSpacePlot = function(obj, feature, type="DAPI", sample=names(obj@misc$info)[1], size=1, alpha=c(1,1),color=c("lightgrey","blue")){
    raster_type <- switch(type,
                          HE = "img_he_gg",
                          DAPI = "img_gg",
                          stop("Invalid type. Must be 'HE' or 'DAPI'.")
                             )

    spatial_coord1 <- as.data.frame(obj@reductions$spatial@cell.embeddings)
    spatial_coord2 <- FetchData(obj,feature)
    colnames(spatial_coord2) <- feature
    spatial_coord <-cbind(spatial_coord1,spatial_coord2)

    FeatureSpacePlot <-ggplot2::ggplot() + ggplot2::annotation_custom(grob = obj@misc$info[[sample]][[raster_type]],
        xmin = 0, xmax = obj@misc$info[[sample]]$size_x, ymin = 0, ymax = obj@misc$info[[sample]]$size_y) +
        ggplot2::geom_point(data = spatial_coord, ggplot2::aes(x = spatial_1, y = spatial_2,color = !!sym(feature),alpha = !!sym(feature)), size=size)+
        labs(color = feature)+
        guides(alpha = "none")+
        ggplot2::theme_classic()+
        ggplot2::scale_alpha_continuous(range=alpha)+
        scale_color_gradient(low=color[1],high = color[2])+ coord_fixed()
    return(FeatureSpacePlot)
    }
R
# 将base64转成PNG图
Base64ToPng(obj)
str(obj@misc$info) # 增加了img_gg(DAPI png图)和img_he_gg(HE png图)
output
List of 1
$ WTH1092_expression:List of 6
..$ img : chr "data:;base64,iVBORw0KGgoAAAANSUhEUgAAD6AAAAWnCAAAAAByYdMoAAAgAElEQVR4AezBaa9l6WGe5/t537X22vOZ6lSdququrh5IdpMiRU"| __truncated__
..$ img_gg :List of 12
.. ..$ raster : 'raster' chr [1:362, 1:1000] "#000000ff" "#000000ff" "#000000ff" "#000000ff" ...n .. ..$ x : 'simpleUnit' num 0npc
.. .. ..- attr(*, "unit")= int 0
.. ..$ y : 'simpleUnit' num 0npc
.. .. ..- attr(*, "unit")= int 0
.. ..$ width : 'simpleUnit' num 1npc
.. .. ..- attr(*, "unit")= int 0
.. ..$ height : 'simpleUnit' num 1npc
.. .. ..- attr(*, "unit")= int 0
.. ..$ just : num [1:2] 0 0
.. ..$ hjust : NULL
.. ..$ vjust : NULL
.. ..$ interpolate: logi TRUE
.. ..$ name : chr "GRID.rastergrob.11"
.. ..$ gp : list()
.. .. ..- attr(*, "class")= chr "gpar"
.. ..$ vp : NULL
.. ..- attr(*, "class")= chr [1:3] "rastergrob" "grob" "gDesc"
..$ size_x : int 55128
..$ size_y : int 19906
..$ img_he : chr "data:;base64,iVBORw0KGgoAAAANSUhEUgAALuAAABD1CAIAAAB1YFaBAAAgAElEQVR4AezBwYHoxoJdybjJ8d8BreSnmEdA1SP7qzUGaIGIVT"| __truncated__
..$ img_he_gg:List of 12
.. ..$ raster : 'raster' chr [1:362, 1:1000] "#888890ff" "#63636bff" "#575659ff" "#393832ff" ...n .. ..$ x : 'simpleUnit' num 0npc
.. .. ..- attr(*, "unit")= int 0
.. ..$ y : 'simpleUnit' num 0npc
.. .. ..- attr(*, "unit")= int 0
.. ..$ width : 'simpleUnit' num 1npc
.. .. ..- attr(*, "unit")= int 0
.. ..$ height : 'simpleUnit' num 1npc
.. .. ..- attr(*, "unit")= int 0
.. ..$ just : num [1:2] 0 0
.. ..$ hjust : NULL
.. ..$ vjust : NULL
.. ..$ interpolate: logi TRUE
.. ..$ name : chr "GRID.rastergrob.12"
.. ..$ gp : list()
.. .. ..- attr(*, "class")= chr "gpar"
.. ..$ vp : NULL
.. ..- attr(*, "class")= chr [1:3] "rastergrob" "grob" "gDesc"
R
# DAPI背景的细胞分群图
options(repr.plot.height=7, repr.plot.width=15)
ImageSpacePlot(obj=obj, group_by = "Sub_CellType",type="DAPI",size=0.7)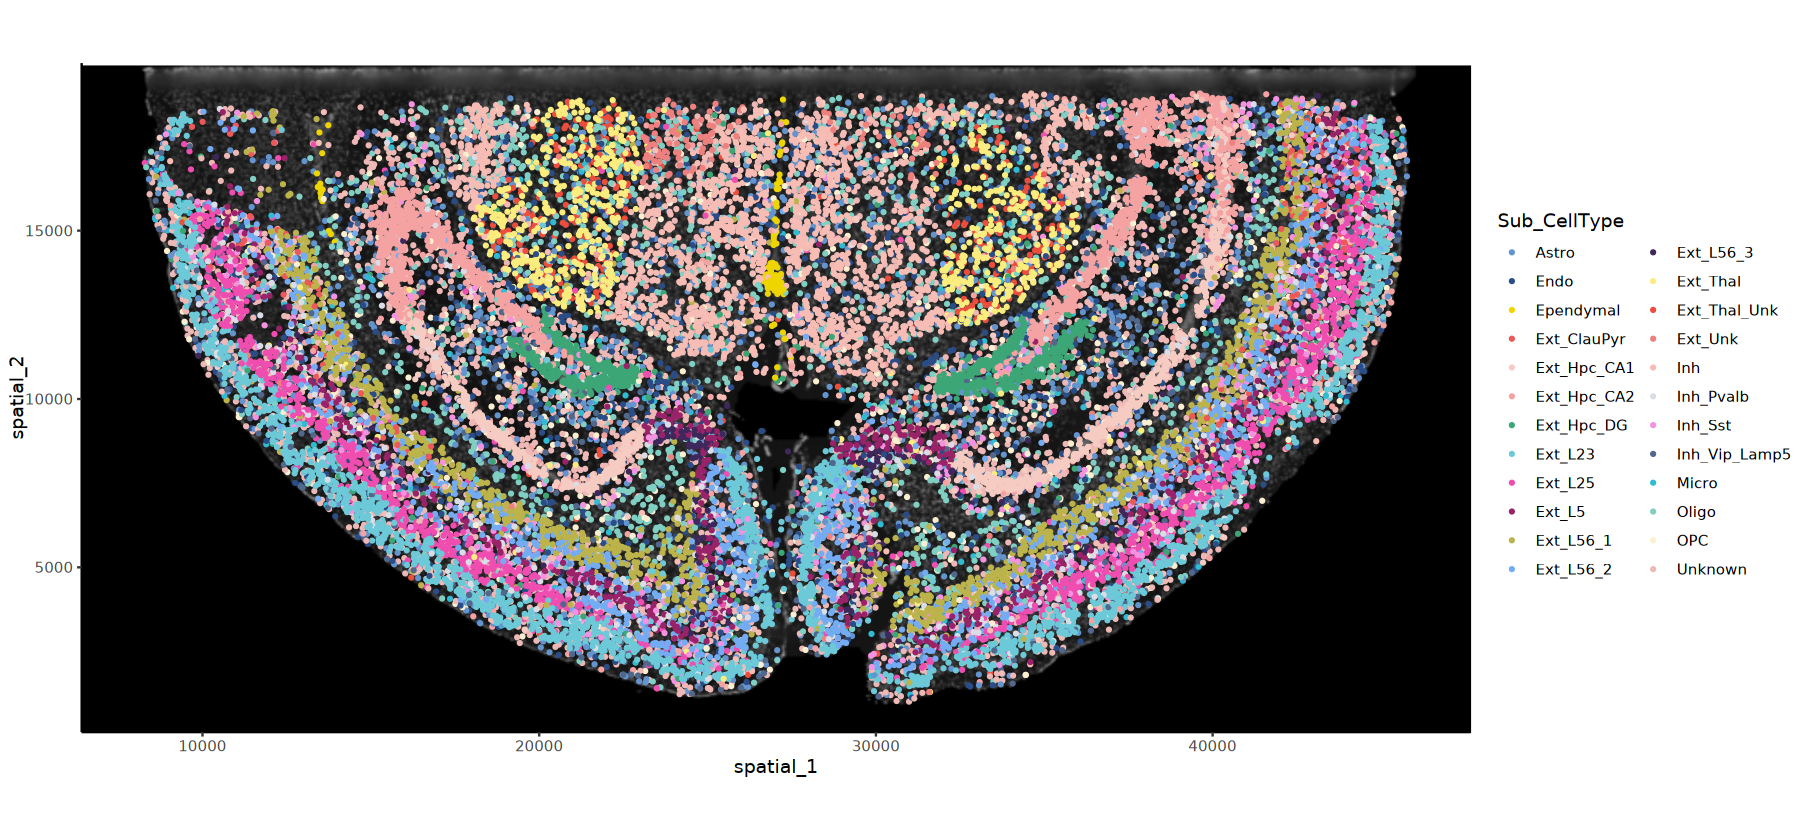
R
# HE背景的细胞分群图
options(repr.plot.height=7.5, repr.plot.width=13)
ImageSpacePlot(obj=obj, group_by = "Sub_CellType",type="HE",size = 0.5)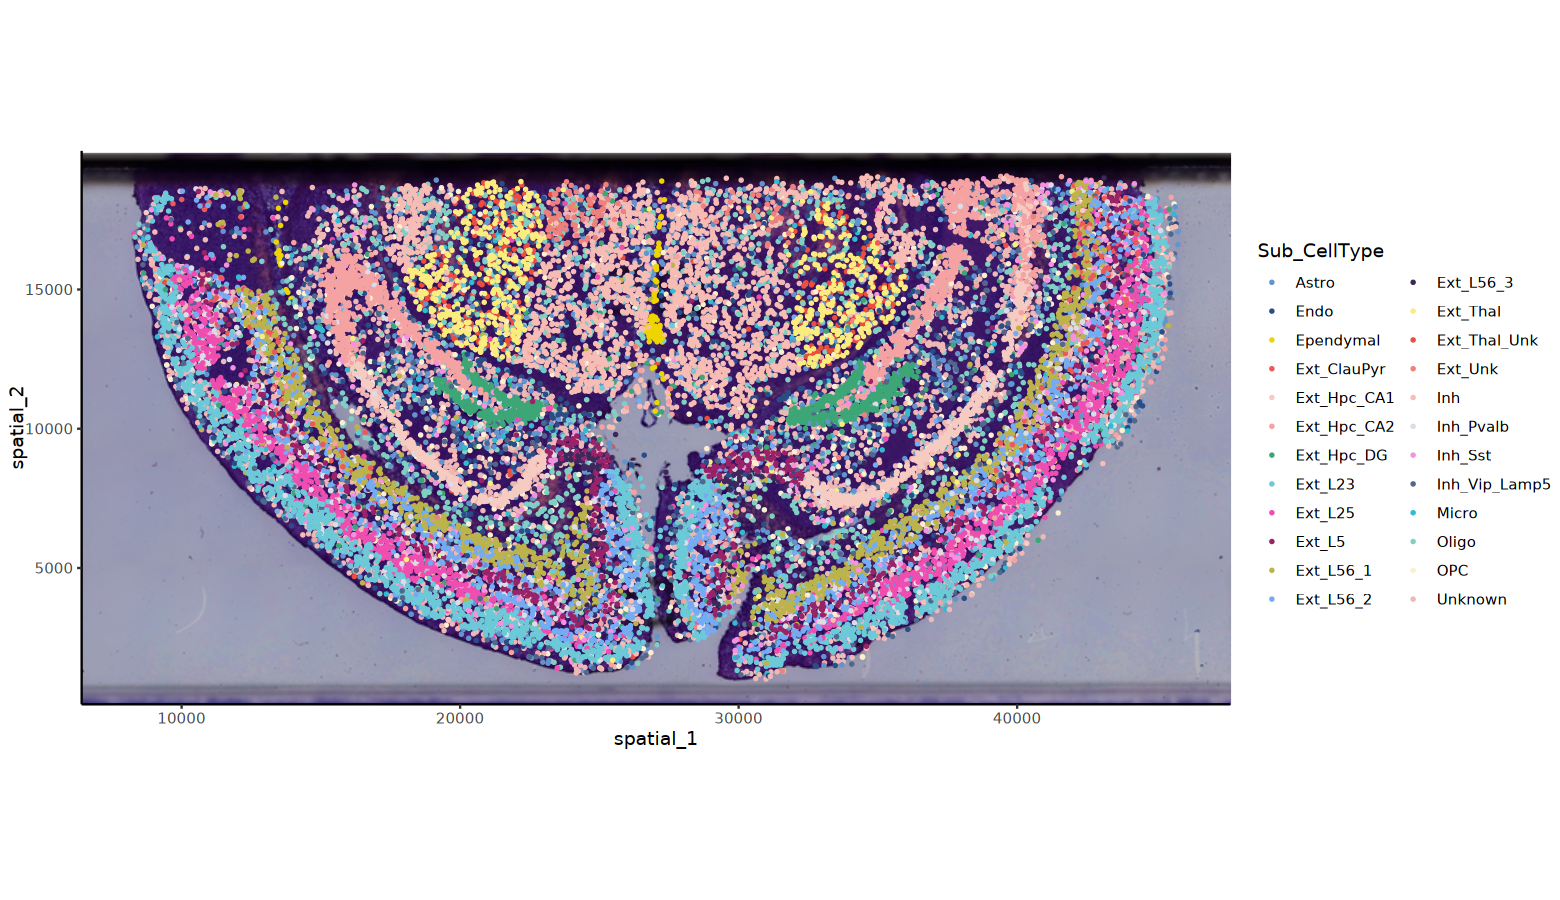
R
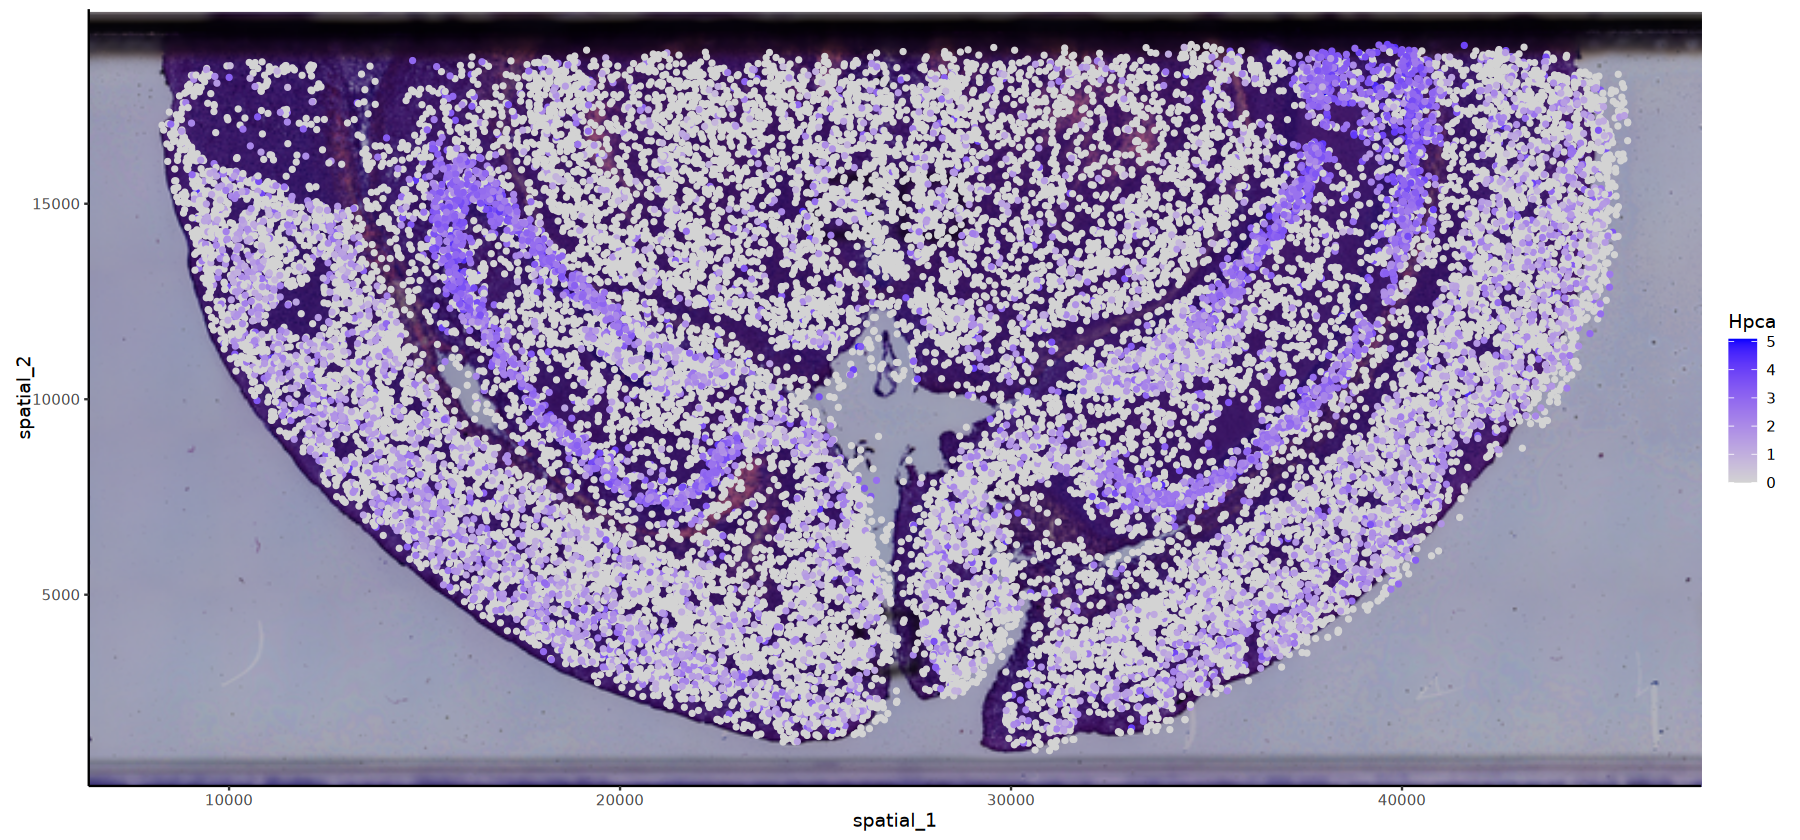
# DAPI背景的基因表达图
options(repr.plot.height=7, repr.plot.width=15)
FeatureSpacePlot(obj=obj, feature="Hpca",type="DAPI")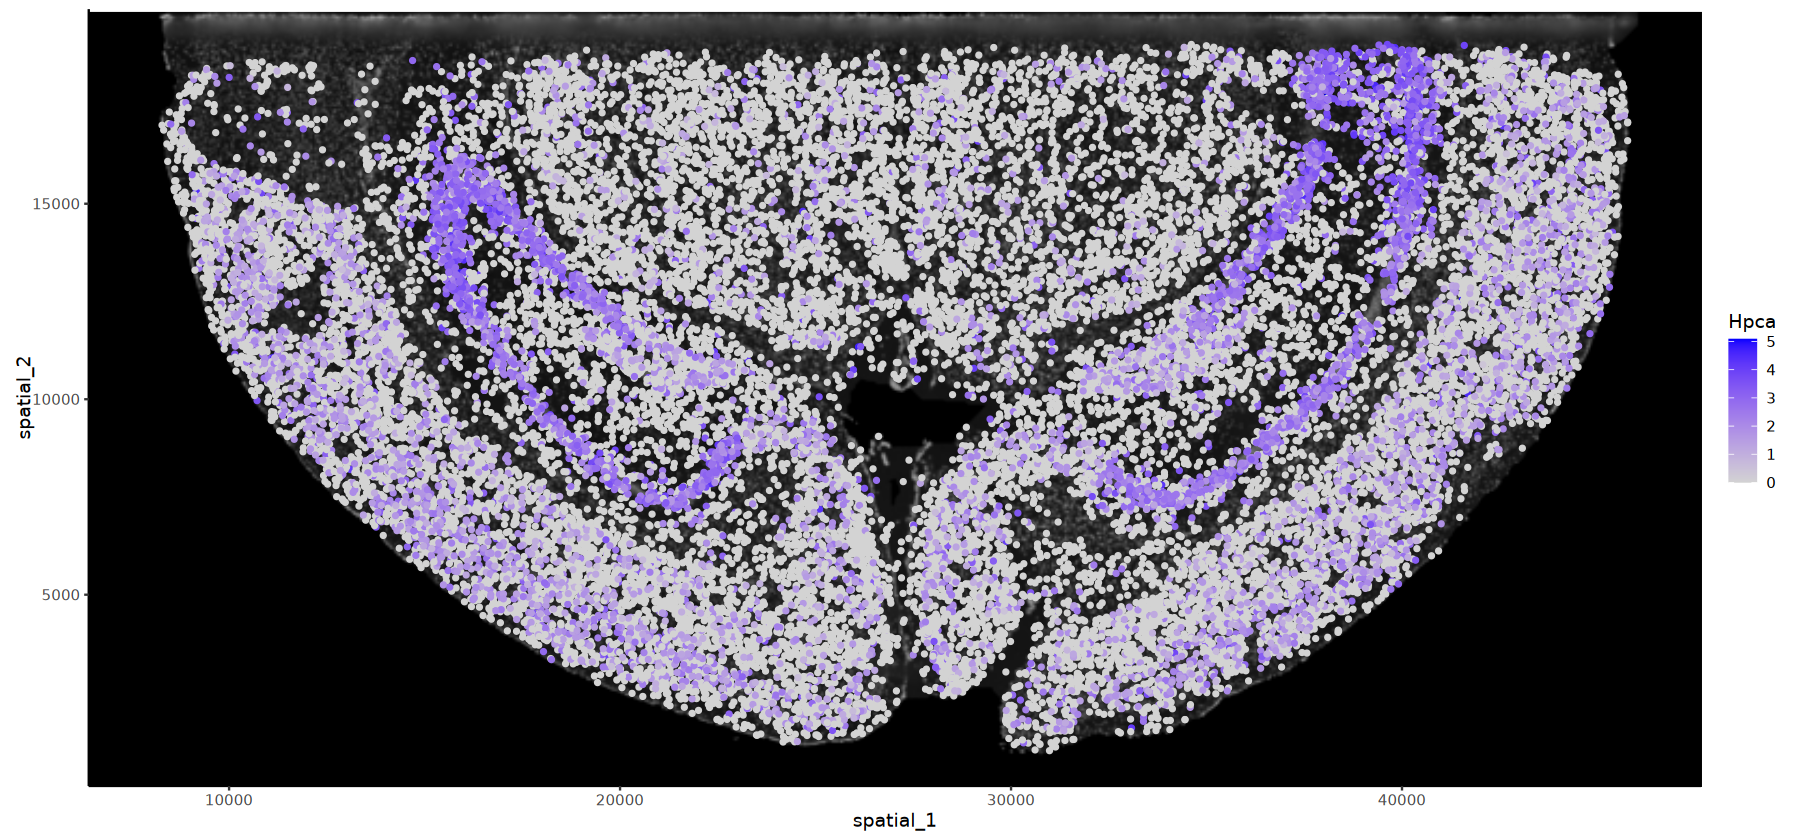
R
# HE背景的基因表达图
options(repr.plot.height=7, repr.plot.width=15)
FeatureSpacePlot(obj=obj, feature="Hpca",type="HE")