Standard Analysis for Single-cell scATAC-seq & scRNA-seq Multi-omics: Data Quality Control
I. Purpose of Quality Control
To remove abnormal barcodes such as cell debris, doublets (multiple cells in one droplet), and dead cells, ensuring that the analysis includes only high-quality, true single cells.
Proper Encapsulation of Single Cells by Droplets
The figure below shows the ideal situation: one droplet contains only one intact cell. However, in actual experiments, droplets may also encapsulate multiple cells (doublets) or free cell debris. Both scenarios should be filtered out during the quality control process.

II. Key Quality Control Metrics and Recommendations
1) RNA Quality Control
Key metrics (thresholds should be flexibly adjusted based on your data):
Number of genes detected per cell (
nFeature_RNA):
A very low value suggests the barcode may represent cell debris rather than a true cell. Very high values may indicate doublets rather than single, individual cells.
Common recommended threshold: 200~6000 (adjust according to violin plot or data characteristics as needed).Total UMI count per cell (
nCount_RNA):
Reflects the total number of transcript molecules captured in each cell and is usually correlated with the number of detected genes.
Typical screening range: 500–10,000 (thresholds should be fine-tuned according to violin plot or data characteristics).Mitochondrial gene proportion (
percent.mt):
This metric is used to filter potential dead or stressed cells. A high mitochondrial proportion (e.g., above 20% or 25%) often indicates cellular stress, damage, or death.
Common recommended threshold: ≤10%–20%.
# Calculate the percentage of mitochondrial genes (for human genes, mitochondrial genes usually start with "MT-")
data[["percent.mt"]] <- PercentageFeatureSet(
  object = data,
  pattern = "^MT-"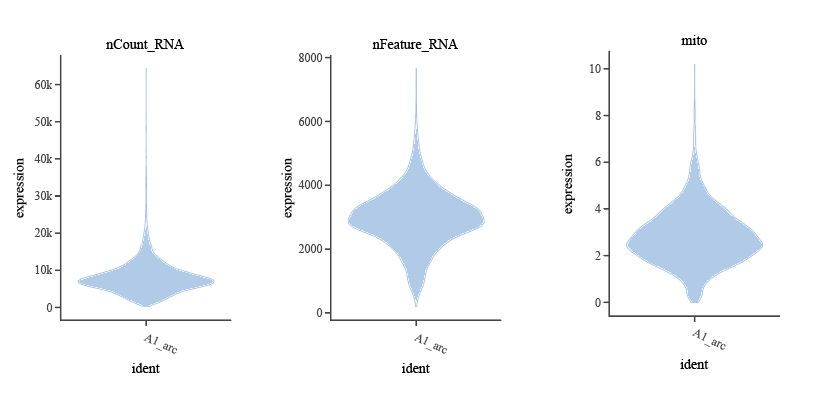
)# Plot RNA Quality Control Violin Plots (nFeature_RNA, nCount_RNA, percent.mt)
VlnPlot(
object = data,
features = c("nFeature_RNA", "nCount_RNA", "percent.mt"),
ncol = 3,
pt.size = 0
)Outliers in the violin plots (such as extremely low or high nFeature_RNA, or abnormally high percent.mt) often indicate poor-quality cells. These regions are suitable as filtering thresholds. It is recommended to flexibly adjust threshold values based on both recommended ranges and the appearance of the violin plots, in order to maximize retention of high-quality cells while removing noise.
2) ATAC Quality Control
It is recommended to evaluate the following metrics:
- TSS enrichment score (
TSS.enrichment): An indicator of the chromatin state in cells. High TSS enrichment suggests good chromatin accessibility, which generally corresponds to healthy, viable cells in a proper transcriptional state. Low TSS enrichment is commonly seen in chromatin degradation, cell death, or technical noise. This can be calculated usingTSSEnrichment(). Common threshold recommendation: ≥1–2 (recommended as a lower limit; adjust according to violin plot and data characteristics).
# Run TSS enrichment score calculation
data <- TSSEnrichment(
 object = data,
 assay = "ATAC"
)

# The results will be added to the meta.data column named TSS.enrichment- Nucleosome signal (
nucleosome_signal): Describes the ratio of mononucleosomal fragments (~147bp) to nucleosome-free fragments (<100bp). High-quality cells, due to intact chromatin structure, display a periodic oscillating pattern in the fragment length distribution (with peaks approximately every 200bp), which reflects physiological nucleosome arrangement and chromatin packaging within the cell. Abnormally elevated nucleosome signal indicates non-physiological states such as apoptosis, degradation, or excessive doublets. Common recommended threshold: ≤2. It is advised to remove cells with values above this threshold.
# Calculate nucleosome signal (nucleosome_signal)
data <- NucleosomeSignal(
  object = data,
  assay = "ATAC"
)

# The results will be added to the nucleosome_signal column in meta.data- Total ATAC fragments (
nCount_ATAC): This metric is similar to thenCount_RNAdescribed above and is used to filter out debris or doublets from the ATAC layer. The commonly recommended range is 1,000–80,000 (the exact threshold should be adjusted based on the appearance of the violin plot).
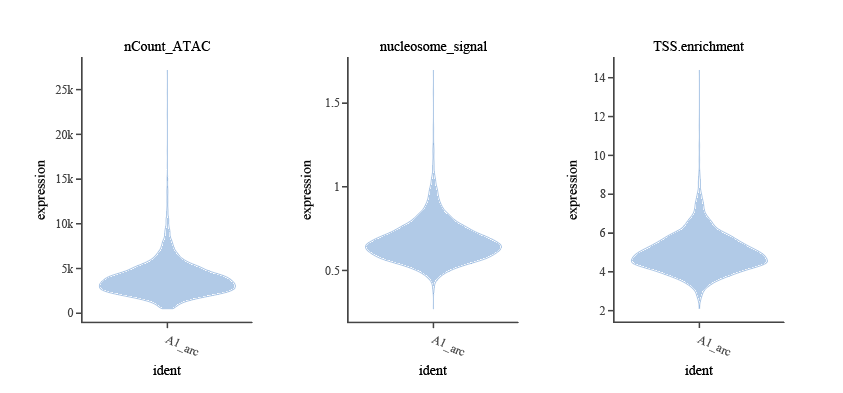
# Plot ATAC Quality Control Violin Plots (TSS.enrichment, nucleosome_signal, nCount_ATAC)
VlnPlot(
  object = data,
  features = c("TSS.enrichment", "nucleosome_signal", "nCount_ATAC"),
  ncol = 3,
  pt.size = 0
)
Similarly, violin plots can be used to visually display the distribution of various ATAC QC metrics, helping to determine appropriate filtering thresholds and identify abnormal or low-quality cells.
3. Frequently Asked Questions
Q1: I followed the Signac official tutorial to process seekARC data, but the tutorial uses a singlecell.csv file that you haven't provided. Why is that?A: The instructor probably used the single-modality scATAC-seq analysis tutorial. In the single-modality workflow, the singlecell.csv file is used to calculate the pct_reads_in_peaks metric for cell filtering. Signac has a dedicated multiome (ATAC+RNA) analysis tutorial (https://stuartlab.org/signac/articles/pbmc_multiomic), and in this workflow, filtering does not require this metric, so we have not provided the file.
Q2: Why don't we use the pct_reads_in_peaks metric to filter cells in Signac's multimodal (ATAC+RNA) analysis?A: The pct_reads_in_peaks value (fraction of reads in peaks) is mainly used for quality control in single-modality ATAC analysis, as it reflects the signal-to-noise ratio. Because there is no other data support in single-modality experiments, it is important to use this metric to strictly filter out low-quality cells. In multiome datasets, however, RNA information provides complementary quality control for ATAC data. If a cell’s RNA data is of good quality, a slightly lower pct_reads_in_peaks may still indicate a biologically meaningful and valuable cell. Some cell subtypes naturally have lower pct_reads_in_peaks, and strict filtering may result in the loss of important information. Therefore, Signac recommends focusing on more robust metrics such as TSS.enrichment and nucleosome_signal for multiome datasets and performing general quality control by cross-validating ATAC with RNA, without the need to strictly filter with pct_reads_in_peaks.
Q3: How do neutrophils affect the quality control (QC) metrics in multi-omics data?A:
- When neutrophils become activated (such as in response to inflammatory stimuli), their chromatin decondenses and is released extracellularly, forming Neutrophil Extracellular Traps (NETs) bound to histones, which help clear pathogens. This process generates a large number of small, randomly distributed DNA fragments, which are reflected in sequencing data as:
- Significant decrease in TSS enrichment, overlap peaks, and similar metrics;
- Up to 60% of chromosomal fragments may come from these sources, most of which cannot be assigned to ATAC-called peak regions;
- Samples containing large numbers of neutrophils in this activated state are not suitable for scATAC-seq.
- In contrast, neutrophils that are not activated and in a resting (terminally differentiated) state, despite having low overall transcriptional activity, maintain intact chromatin structure. Typical QC metrics (such as TSS.enrichment, overlap peaks, etc.) are usually within the normal range; however, the median gene expression values (nFeature_RNA, nCount_RNA) and total ATAC fragment counts (nCount_ATAC) may be relatively low. This is a physiological phenomenon and is commonly observed in practice.