Mixed-species scRNA-seq analysis guide: principles interpretation and common issues
NOTE
Important Prerequisites
- SeekSoul™ Tools does not have species-specific algorithms for mixed species samples. Mixed species samples should be converted to 10x whitelist format and analyzed using Cell Ranger
- Multi-omics ATAC does not support mixed species analysis: 10x software
cellranger arcandcellranger ATACdo not support mixed species. This guide applies only to standard RNA libraries - Barcode conversion tool: Refer to the
Barcode-Converterutility in the bioinformatics external resources on DingTalk
Building Mixed Species Reference Genome
Data Preparation
NOTE
File Format Requirements
- Recommended: Use GTF and FASTA files from the Ensembl database (includes optional tags for subsequent filtering)
- If not available in Ensembl, GTF and FASTA files from other sources can be used
- GTF format is required; GFF format is not supported
- For GTF/GFF format specifications, refer to: Ensembl GFF/GTF Format Documentation
Filtering Non-coding Genes (Recommended)
GTF files may contain entries related to non-polyA transcripts that overlap with protein-coding genes. Due to these overlapping annotations, reads may be marked as mapping to multiple genes (multi-mapped) and will not be used for subsequent gene quantification.
It is recommended to use the cellranger mkgtf command to filter non-coding genes:
cellranger mkgtf input.gtf output.gtf --attribute=gene_biotype:protein_codingBuilding Mixed Species Index
Use the cellranger mkref command to build a mixed species reference genome. You need to specify --genome, --fasta, and --genes parameters for each species:
cellranger mkref \
  --genome=GRCh38 \
  --fasta=/human/refdata-gex-GRCh38-2020-A/fasta/genome.fa \
  --genes=/human/refdata-gex-GRCh38-2020-A/genes/genes.gtf \
  --genome=Macaca_fascicularis \
  --fasta=/Macaca_fascicularis_GCF_037993035.1/fasta/genome.fa \
  --genes=/Macaca_fascicularis_GCF_037993035.1/genes/genes.gtf \
  --maxjobs 50 \
  --localmem 60 \
  --localcores 12
Verifying Index Construction
After construction, check the reference.json file to ensure it contains 2 genome entries. Cell Ranger will only recognize it as a mixed species reference if this condition is met:
{
    "fasta_hash": "6a2ba19a695f279ec863f521fb1d834d01905c19",
    "genomes": [
        "GRCh38",
        "Macaca_fascicularis"
    ],
    "gtf_hash.gz": "24cb2b8556e5c3740b0816f965c7912f679b17f5",
    "input_fasta_files": [
        "genome.fa",
        "genome.fa"
    ],
    "input_gtf_files": [
        "genes.gtf",
        "genes.gtf"
    ],
    "mem_gb": 16,
    "mkref_version": "8.0.0",
    "threads": 2,
    "version": null
}
NOTE
Handling Exogenous Inserted Genes
If you have exogenous inserted genes, you can first add these genes to the genome and annotation files of any species, then build the mixed species index.
Analysis Workflow and Principles
Core Principle Overview
Cell Ranger classifies species based on UMI counts mapped to different species for each barcode:
- Initial Classification: Barcodes are initially classified to the species with higher UMI counts
- Multiplet Identification: If a barcode has UMI counts exceeding the 10th percentile of each species' distribution, it is identified as a multiplet (multiple cells mixed together)
NOTE
Algorithm Applicability
This identification algorithm is more accurate when the mixed species cell ratio is close to 1:1 (e.g., 50:50). Accuracy decreases as the ratio deviates further from this balance.
Detailed Algorithm Steps
Step 1: Collect and Analyze UMI Counts
For each cell barcode, Cell Ranger counts:
- Species A UMI Count: Number of UMIs mapped to Species A reference genome
- Species B UMI Count: Number of UMIs mapped to Species B reference genome
Based on this, each barcode can be classified into one of three categories:
- Species A Dominant (A > B): More UMIs mapped to Species A than Species B
- Species B Dominant (B > A): More UMIs mapped to Species B than Species A
- Comparable or Mixed (A ≈ B): Possibly a dual-species mixture
Step 2: Setting Classification Threshold
To distinguish "true single cells" from "possible multiple cells", Cell Ranger uses the 10th percentile as the classification threshold:
Setting Species A Cell Threshold:
- From all barcodes where "Species A UMI > Species B UMI"
- Find the 10th percentile of Species A UMI counts for these barcodes, denoted as
A_threshold - Any barcode with Species A UMI count >
A_thresholdis initially considered a Species A singlet
Setting Species B Cell Threshold:
- From all barcodes where "Species B UMI > Species A UMI"
- Find the 10th percentile of Species B UMI counts for these barcodes, denoted as
B_threshold - Any barcode with Species B UMI count >
B_thresholdis initially considered a Species B singlet
Step 3: Identifying Multiplets
A barcode is identified as a multiplet if it simultaneously satisfies both conditions:
- Species A UMI count >
A_thresholdAND - Species B UMI count >
B_threshold
Algorithm Workflow Summary
For each barcode:
    Count speciesA_UMI_count and speciesB_UMI_count

    If speciesA_UMI > speciesB_UMI:
        Classify as "Species A Dominant"
        → Use all "Species A Dominant" barcodes, take 10th percentile of speciesA_UMI → A_threshold

    If speciesB_UMI > speciesA_UMI:
        Classify as "Species B Dominant"
        → Use all "Species B Dominant" barcodes, take 10th percentile of speciesB_UMI → B_threshold

Judgment Logic:
    If speciesA_UMI > A_threshold AND speciesB_UMI > B_threshold:
        → Identified as multiplet (dual-species mixture)
    If only speciesA_UMI is high → Possibly Species A singlet
    If only speciesB_UMI is high → Possibly Species B singlet
    (Note: Cannot distinguish dual cells of the same species)
Interpreting Results
Summary Report
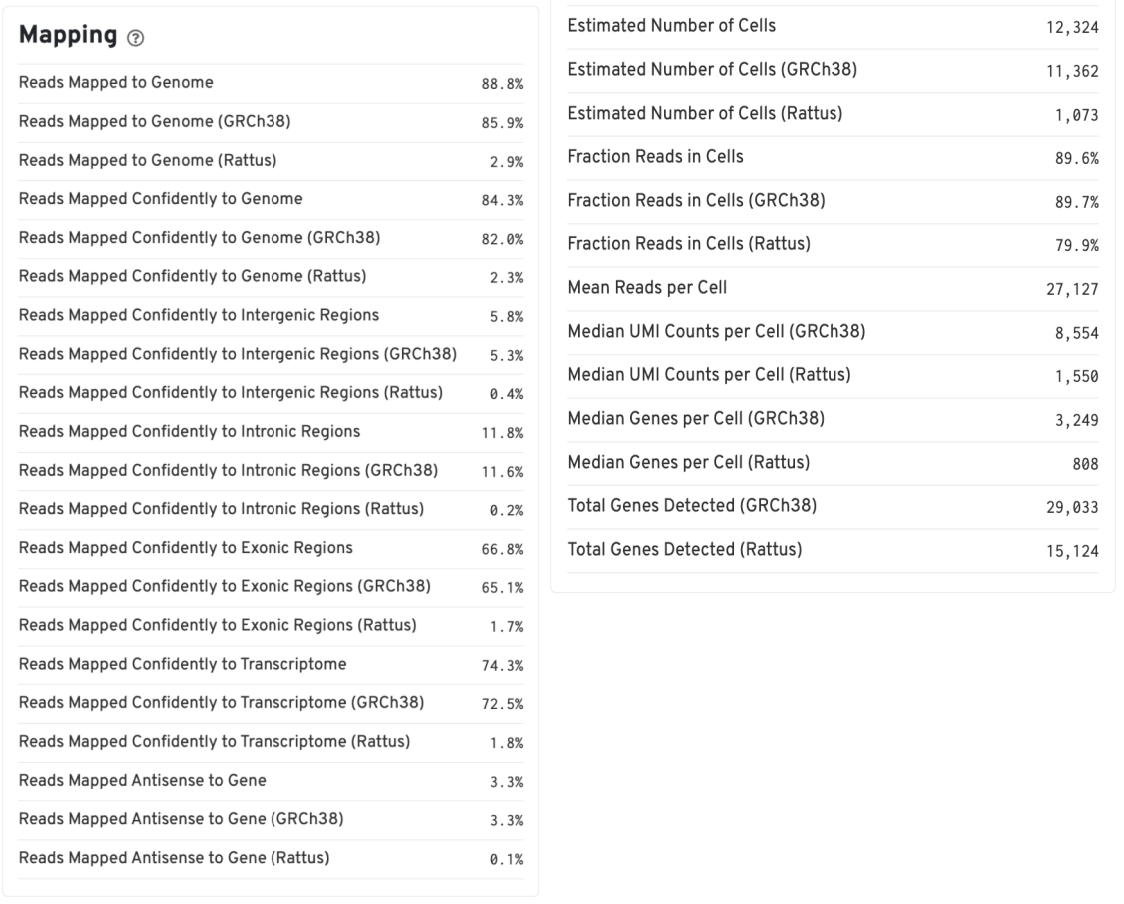
The Summary report provides the following key information:
- Mapping rates for each species: Reflects data quality
- Number of cells identified by software: Number of cells detected for each species
- Median genes: Median gene expression per cell
Gene Expression Report
Key Metrics Explanation
| Metric | Definition | Interpretation |
|---|---|---|
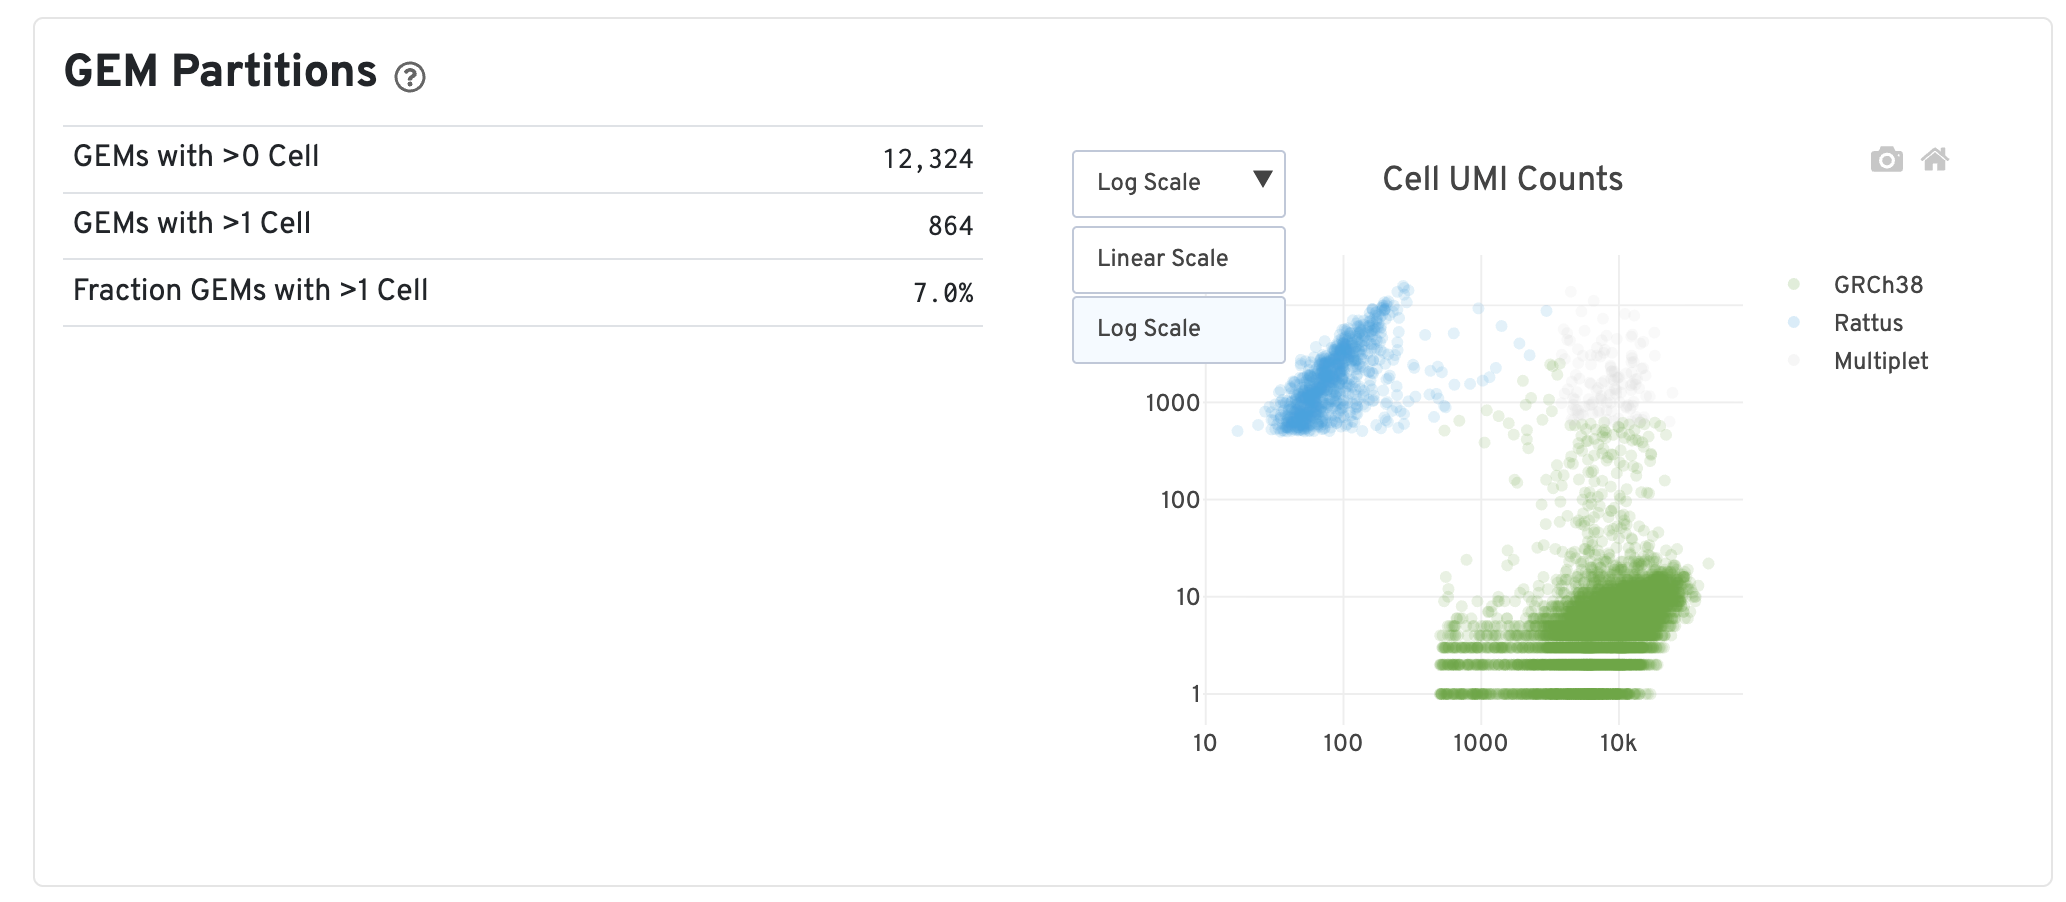
| GEMs with >0 Cell | Number of barcodes with at least one cell after identification | Represents the number of valid cells detected |
| GEMs with >1 Cell | Number of barcodes with at least 2 cells after identification | Represents the number of multiplets. A high proportion indicates that some barcodes may contain RNA from multiple cells |
| Fraction GEMs with >1 Cell | Estimated average proportion of barcodes associated with multiple cells | Calculated through bootstrap sampling and adjusted for the ratio of two cell types. Reflects the proportion of barcodes inferred to be associated with multiple cells among all barcodes |
| Cell UMI Counts Plot | Each point represents a barcode, with axes measuring total UMI counts mapped to each species | Point colors indicate the inferred number of cells associated with each barcode, providing a visual representation of which barcodes may be multiplets |
Output Files
Standard Output Files
Consistent with standard RNA analysis results, including:
filtered_feature_bc_matrix/: Filtered expression matrixraw_feature_bc_matrix/: Raw expression matrixanalysis/: Analysis results directorymetrics_summary.csv: Quality control metrics summary
Special File: gem_classification.csv
This file records the UMI counts for each species detected for each barcode and the final species classification determined by the software:
- Column Descriptions:
barcode: Cell barcode[Species A Name]: UMI count mapped to Species A[Species B Name]: UMI count mapped to Species Bcall: Species classification determined by software (Species A name, Species B name, orMultiplet)
Example:
barcode,GRCh38,Rattus,call
AAACCCAAGAAACACT-1,44666,22,GRCh38
AAACCCAAGAAACCAT-1,5856,8,GRCh38
AAACCCAAGAAACCCA-1,35589,10,GRCh38
AAACCCAAGAAACCCG-1,37726,13,GRCh38
AAACCCAAGCGATCTC-1,296,14235,Rattus
AAACCCAAGCGCACTT-1,271,15742,Rattus
AAACCCAAGGCGGACT-1,276,12822,Rattus
AAACCCAAGGCTCACC-1,246,13719,Rattus
AAACCCACAATCCCTC-1,2978,8727,Rattus
AAACGAAAGTGAGTGC-1,4600,839,Multiplet
AAACGAAAGTGATGGC-1,3827,983,Multiplet
AAACGAAAGTGCGATA-1,5605,907,Multiplet
AAACGAACAAACCCGC-1,4674,940,Multiplet
Downstream Analysis: Species Cell Identification
There are two analytical approaches for species cell identification and separation:
Method 1: Using Cell Ranger Classification Results
Directly use the species classification determined by Cell Ranger software in gem_classification.csv:
# Read Cell Ranger classification results
cellranger <- read_csv("gem_classification.csv") %>%
  select(barcode, call) %>%
  rename("cellranger" = "call")

cellranger$barcode <- as.character(cellranger$barcode)

# Merge into Seurat object
ob@meta.data <- ob@meta.data %>%
  tibble::rownames_to_column(var = "barcode") %>%
  left_join(cellranger, by = "barcode") %>%
  tibble::column_to_rownames(var = "barcode")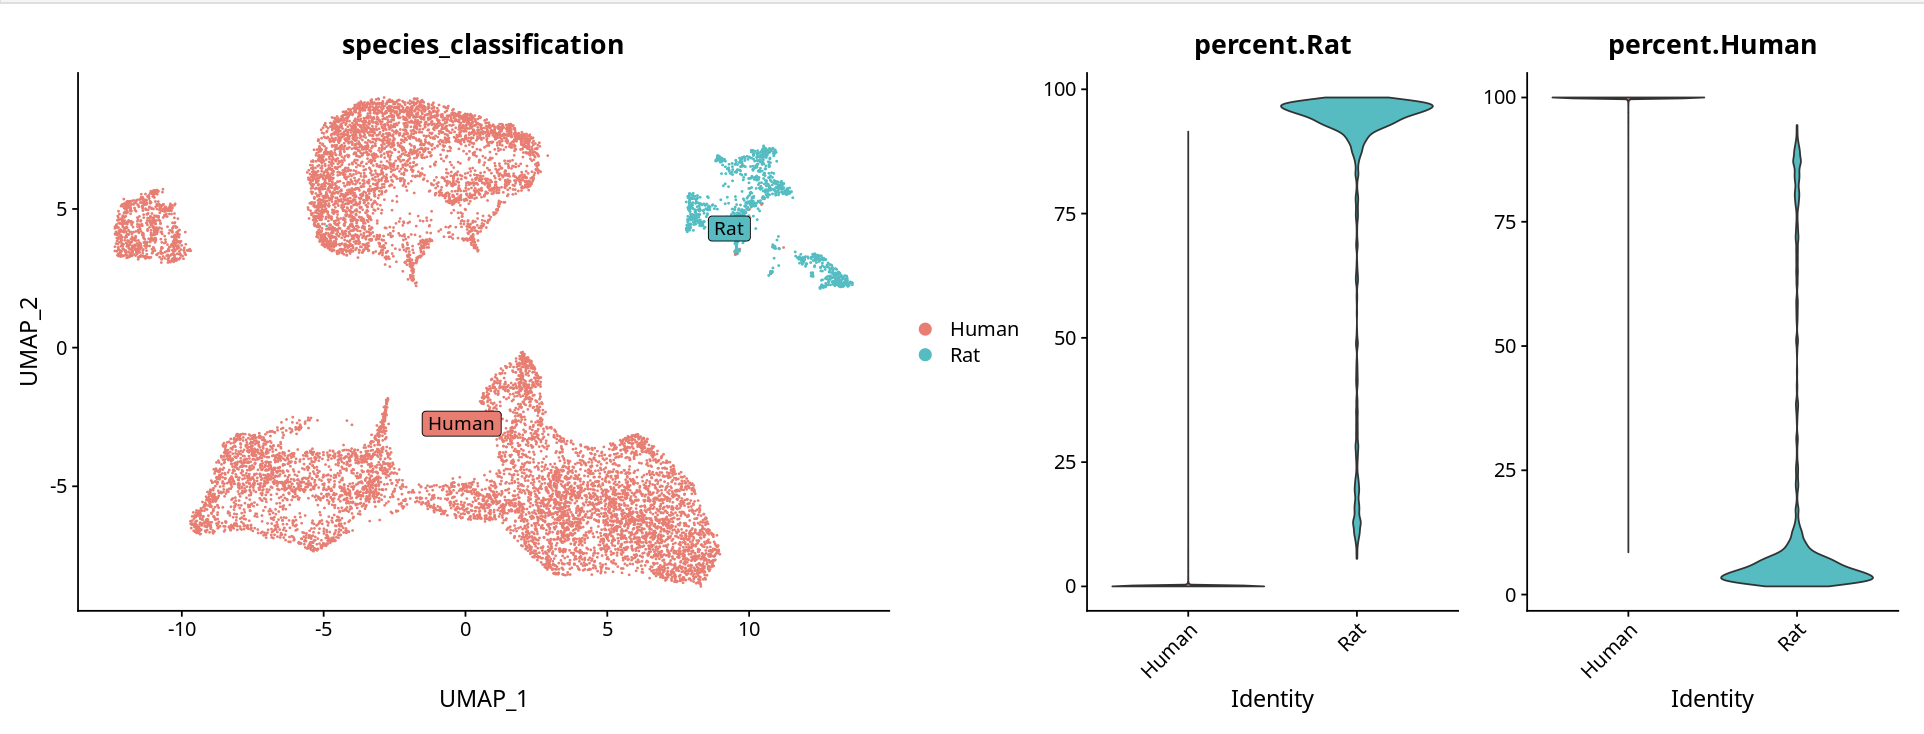
Method 2: Judging Based on Gene Expression Percentage
Determine species based on the percentage of genes from each species expressed in each cluster:
# Calculate gene expression percentage for each species
ob[['percent.Rat']] <- PercentageFeatureSet(object = ob, pattern = '^Rattus')
ob[['percent.Human']] <- PercentageFeatureSet(object = ob, pattern = '^GRCh38')

# Visualization
p <- DimPlot(ob, label = T, repel = T, label.box = T)
p1 <- VlnPlot(ob, features = c("percent.Rat", "percent.Human"), pt.size = 0)
options(repr.plot.height = 6, repr.plot.width = 16)
p + p1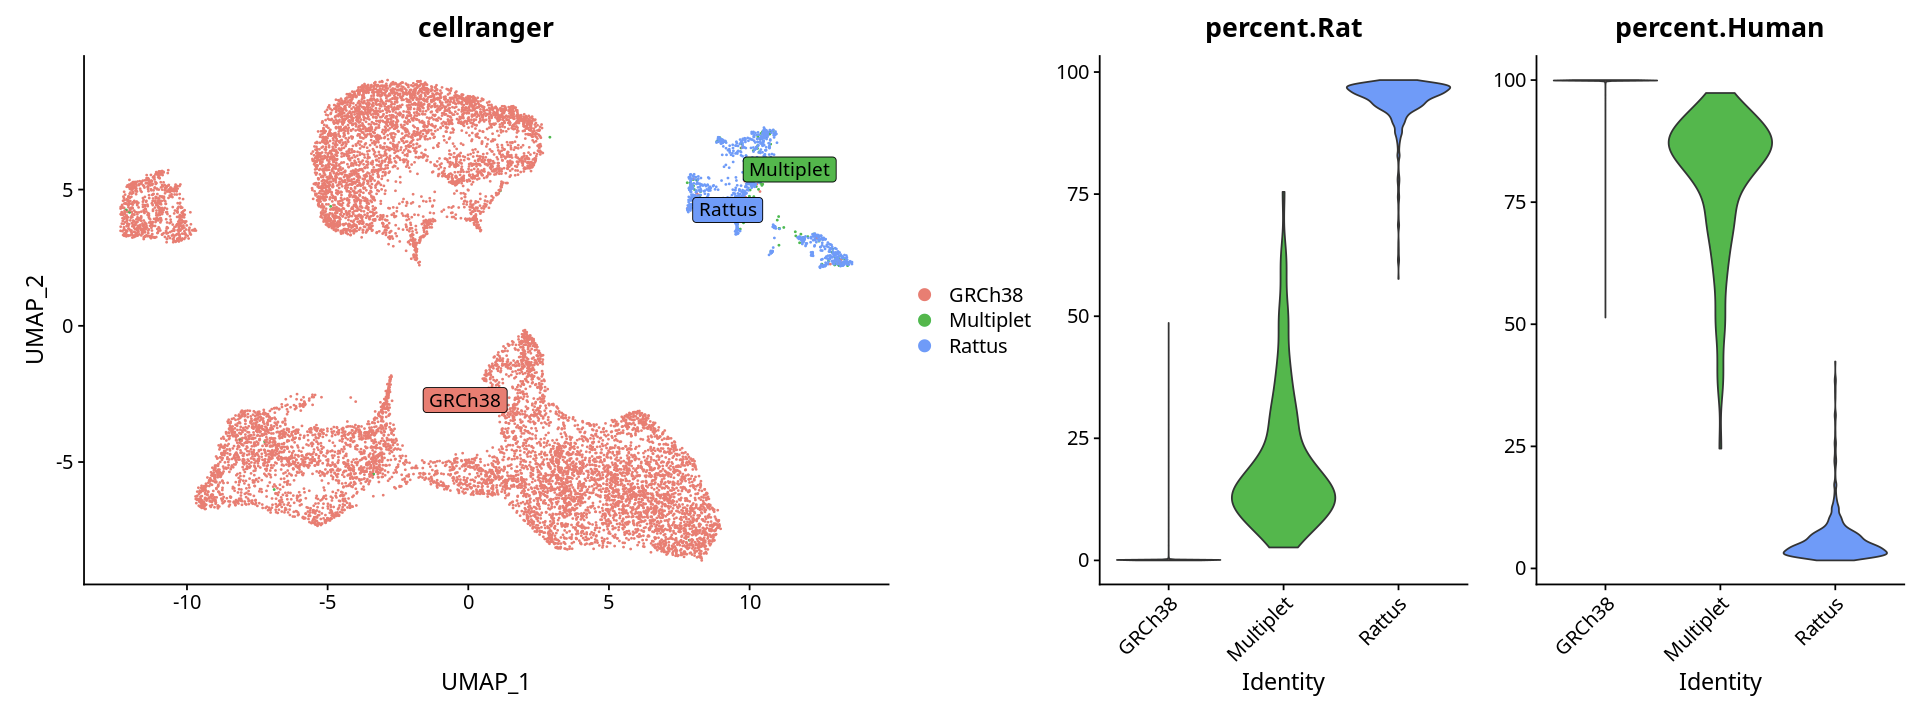
NOTE
Cloud Platform Tool Support
The cloud platform's "My Tools" includes a SpeciesSplit module that can assist with species separation analysis.
Common Issues and Troubleshooting
Q1: How to determine if the analysis results contain cells from the corresponding species
Methods for Determination:
Check mapping rates in the quality control report:
- Examine the mapping rate (Mapping Rate) for each species
- If a species' mapping rate is very low (e.g., < 5%), it suggests that cells from that species may not have been captured
Check UMI and gene counts:
- If a species' mapping rate is low, the detected UMI and gene counts will be very low
- The final identified cell count for that species is unreliable, indicating that cells from the corresponding species may not have been captured in the sample
Examine
gem_classification.csv:- Check the UMI count distribution for each species
- If a species' UMI counts are generally very low, it suggests that cells from that species may not exist
Troubleshooting Steps:
# Read classification results and check
classification <- read_csv("gem_classification.csv")

# Count cells for each species
table(classification$call)

# Check UMI count distribution for each species
summary(classification$GRCh38)  # Replace with actual species name
summary(classification$Rattus)  # Replace with actual species name
Q2: How to understand Multiplet identification in the sample
Key Points:
Algorithm Limitations:
- Cell Ranger provides a fixed algorithm based on the 10th percentile threshold
- Accuracy is higher when cell ratios are close to 1:1, and decreases as the ratio deviates further
Comprehensive Judgment Methods:
- Combine with overall clustering results of the sample
- Check gene expression patterns of these cells
- Calculate the expression percentage of corresponding species genes
- Examine overall gene and UMI counts for these cells
- Can be combined with downstream doublet prediction software (such as
DoubletFinder,scDblFinder, etc.) for verification
Verification Code Example:
# Extract multiplet cells
multiplet_cells <- rownames(ob@meta.data)[ob@meta.data$cellranger == "Multiplet"]

# Check gene expression characteristics of multiplet cells
multiplet_data <- ob@meta.data[multiplet_cells, ]
summary(multiplet_data$nFeature_RNA)
summary(multiplet_data$nCount_RNA)

# Check species gene expression percentage
if ("percent.Human" %in% colnames(ob@meta.data)) {
  summary(multiplet_data$percent.Human)
  summary(multiplet_data$percent.Rat)
}
Q3: Can sample data analyzed using a mixed species reference genome be integrated with samples analyzed using a single species reference genome
Answer: Yes, but preprocessing is required.
Reason:
When using a mixed species reference genome, both species' genomes are tagged. For example, species prefixes are added to all gene names:
- Human genes:
GRCh38_CD79A - Mouse genes:
mm10_Actb
Integration Steps:
Split Expression Matrix:
- Split the expression matrix based on species prefixes
- Separate mixed species data into two single-species expression matrices
Rename Genes:
- Remove species prefixes to restore original gene names
- For example:
GRCh38_CD79A→CD79A
Integrate Separately:
- Integrate human cells with single-species human data
- Integrate mouse cells with single-species mouse data
Example Code:
# Read mixed species data
mixed_seurat <- Read10X("mixed_species_output/")

# Split human and mouse data
human_genes <- grep("^GRCh38_", rownames(mixed_seurat), value = TRUE)
mouse_genes <- grep("^mm10_", rownames(mixed_seurat), value = TRUE)

# Extract human cells (based on gem_classification.csv)
human_cells <- classification$barcode[classification$call == "GRCh38"]
human_matrix <- mixed_seurat[human_genes, human_cells]

# Rename genes (remove prefix)
rownames(human_matrix) <- gsub("^GRCh38_", "", rownames(human_matrix))

# Create Seurat object and integrate with single-species data
human_seurat <- CreateSeuratObject(human_matrix)
# ... subsequent integration analysis
Last updated: November 2025