scATAC-seq Variation Analysis: SNP Enrichment in Chromatin Open Regions
Background
Genome-Wide Association Studies (GWAS) are key tools for resolving the genetic basis of complex traits. Many significant Single Nucleotide Polymorphisms (SNPs) identified often reside in non-coding regulatory regions of the genome. This suggests these SNPs likely influence traits by affecting gene expression regulation rather than directly altering protein coding sequences, often with cell type or state specificity. Understanding how these non-coding variants function in specific cellular contexts is a core challenge in revealing molecular mechanisms of complex traits. scATAC-seq can characterize chromatin accessibility genome-wide at single-cell resolution, precisely defining specific regulatory elements (e.g., enhancers, promoters) and their activity profiles across different cell types and activation states. This analysis aims to establish functional links between specific traits and key cell types/states. The core strategy is to calculate the enrichment of GWAS-identified trait-associated SNPs (or tag SNPs in their linkage regions) within cell state-specific open chromatin regions.
First, define cell state-specific open regions based on scATAC-seq; second, for each GWAS trait of interest (e.g., disease risk, blood biochemical indices, neuropsychiatric phenotypes), calculate the frequency of its GWAS significant SNP set and closely linked regions (e.g., LD blocks) appearing within each specific cell state's open regions. Assess whether this frequency is significantly higher than random expectation via statistical tests (e.g., hypergeometric test, permutation test). This reveals which cell types or activation states might be the primary "target cells" for the genetic variants influencing that trait.
Pre-analysis Data Preparation
Before SNP enrichment analysis, prepare the following two types of files
(1) Trait-associated SNP Information
Taking azoospermia_with_SNP.csv as an example,
Information for SNPs associated with the trait 'azoospermia' must include the following:
trait_name index_snps index_chrom index_pos SNP_id tagged_r2 POS
azoospermia rs7192 6 32443869 rs9268686 0.929192 32447745
azoospermia rs7192 6 32443869 rs9268670 0.937897 32446510
azoospermia rs7192 6 32443869 rs7195 1.000000 32444762
azoospermia rs7192 6 32443869 rs2213585 1.000000 32445373
azoospermia rs7192 6 32443869 rs567082101 0.937897 32453552
azoospermia rs7192 6 32443869 rs7775108 0.937897 32452461
azoospermia rs7192 6 32443869 rs9268783 0.937897 32452938
azoospermia rs7192 6 32443869 rs4935354 1.000000 32444621
azoospermia rs7192 6 32443869 rs78456540 0.914852 32586949
Where the trait_name column is the name of the trait to be analyzed; the index_snps column represents all SNP information associated with this trait, which could be a few or hundreds/thousands, derived from GWAS analysis results or downloaded from the EBI website; the index_chrom column represents the chromosome number of the SNP; the index_pos column represents the specific position of the SNP on the chromosome; SNP_id represents SNPs in linkage disequilibrium with the index_snps; tagged_r2 represents the r2 coefficient of linkage disequilibrium; POS represents the position of the SNP in linkage disequilibrium.
├── index_snps_with_LD_with_pos This path stores SNP information for all traits to be analyzed, with each trait in a separate csv file
│ ├── azoospermia_with_SNP.csv
│ ├── cardiomyopathy_with_SNP.csv
│ ├── chronic.lymphocytic.leukemia_with_SNP.csv
│ ├── chronic.myelogenous.leukemia_with_SNP.csv
│ ├── chronic.pancreatitis_with_SNP.csv
│ ├── diffuse.gastric.adenocarcinoma_with_SNP.csv
│ ├── endocarditis_with_SNP.csv
│ ├── ewing.sarcoma_with_SNP.csv
│ ├── gastric.adenocarcinoma_with_SNP.csv
│ ├── gastritis_with_SNP.csv
│ ├── head.and.neck.squamous.cell.carcinoma_with_SNP.csv
│ ├── hyperplasia_with_SNP.csv
│ ├── infectious.meningitis_with_SNP.csv
│ ├── invasive.lobular.carcinoma_with_SNP.csv
│ ├── leukemia_with_SNP.csv
│ ├── myelodysplastic.syndrome_with_SNP.csv
│ ├── neoplasm.of.mature.bcells_with_SNP.csv
│ ├── neoplasm_with_SNP.csv
│ ├── nervous.system.disease_with_SNP.csv
│ ├── pancreatitis_with_SNP.csv
│ ├── papillary.renal.cell.carcinoma_with_SNP.csv
│ ├── polyp_with_SNP.csv
│ └── portal.hypertension_with_SNP.csv
(2) celltype-by-peak Matrix
The row names of the celltype-by-peak matrix are celltypes, column names are peaks information, and values represent the proportion of cells in a given celltype where that peak position is open relative to the total number of cells.
└── peaks This path stores the celltype-by-peaks matrix file
│ └── celltype_by_peaks.csv
SNPenrichment Analysis
import numpy as np
import pandas as pd
import scanpy as sc
import matplotlib.pyplot as plt
import seaborn as sns
from matplotlib.pyplot import rc_context
import bbknn
import re
import json
import os
import rpy2
import anndata
from datetime import date
import scipy.stats
from datetime import datetime
import requests
import logging

# YYYY-MM-DD
today = date.today()
today = today.strftime("%Y-%m-%d")

import warnings
warnings.filterwarnings('ignore')warnings.warn(
Parameter Description
peaks_path: Path storing the celltype_by_peaks.csv file;
SNP_path: Path storing trait-associated SNP information files;
n_permutations: Number of permutation tests;
output_path: Result file output path;
threshold: Threshold to determine if a peak is open in a celltype;
pval_sig_threshold: Enrichment significance threshold.
peaks_path='/PROJ2/FLOAT/shumeng/project/scATAC_learn/Signac/example_data/joint.14/joint14.22/'
SNP_path='/PROJ2/FLOAT/advanced-analysis/Seek_module_dev/ATAC_SNPenrichment/demo/index_snps_with_LD_with_pos/'
n_permutations=1000
output_path="../result/"
threshold=0.05
pval_sig_threshold=0.05
Read celltype-by-peaks File
os.makedirs("../result", exist_ok=True)
peakfile=os.path.join(peaks_path, "celltype_by_peaks.csv")
#print(f'{current_time}:...reading peak file...takes 5 mins...')
peaks=pd.read_csv(peakfile)

peaks.columns = peaks.columns.str.replace('Unnamed: 0', 'fine_grain')
peaks=peaks.set_index(peaks['fine_grain'])
peaks=peaks.drop(columns=['fine_grain'])

# replace characters which can break the code
peaks.index=peaks.index.str.replace('+', 'pos')
peaks.index=peaks.index.str.replace('/', '_or_')

now = datetime.now()
current_time = now.strftime("%H:%M:%S")
#print(f'{current_time}:...done.')
peaks.head()| chr1-9815-10616 | chr1-180437-181865 | chr1-190528-191930 | chr1-267655-268361 | chr1-629577-630313 | chr1-633636-634418 | chr1-778209-779399 | chr1-817017-817549 | chr1-819870-822573 | chr1-822744-823396 | ... | chrY-56861377-56861817 | chrY-56864364-56864795 | chrY-56868776-56869176 | chrY-56869677-56870379 | chrY-56870544-56871524 | chrY-56873556-56874208 | chrY-56879530-56880478 | chrM-11-4079 | chrM-6124-6729 | chrM-9885-16556 | |
|---|---|---|---|---|---|---|---|---|---|---|---|---|---|---|---|---|---|---|---|---|---|
| fine_grain | |||||||||||||||||||||
| Neurons | 0.011323 | 0.022375 | 0.039922 | 0.004150 | 0.013939 | 0.070913 | 0.091979 | 0.004827 | 0.025171 | 0.009473 | ... | 0.003473 | 0.002571 | 0.003338 | 0.006361 | 0.008030 | 0.004782 | 0.006135 | 0.996391 | 0.850956 | 0.999865 |
| Macrophage | 0.009381 | 0.023139 | 0.013133 | 0.001876 | 0.010006 | 0.058787 | 0.076923 | 0.012508 | 0.025641 | 0.008755 | ... | 0.002502 | 0.000000 | 0.004378 | 0.006879 | 0.007505 | 0.006254 | 0.005629 | 0.997498 | 0.846154 | 1.000000 |
| Endothelial_cells | 0.016760 | 0.050279 | 0.053073 | 0.005587 | 0.050279 | 0.212291 | 0.114525 | 0.008380 | 0.044693 | 0.002793 | ... | 0.011173 | 0.005587 | 0.005587 | 0.008380 | 0.016760 | 0.011173 | 0.005587 | 1.000000 | 0.977654 | 1.000000 |
| T_cells | 0.009019 | 0.022548 | 0.012401 | 0.000000 | 0.013529 | 0.072153 | 0.065389 | 0.004510 | 0.011274 | 0.005637 | ... | 0.003382 | 0.000000 | 0.001127 | 0.005637 | 0.011274 | 0.006764 | 0.006764 | 0.996618 | 0.906426 | 1.000000 |
| Smooth_muscle_cells | 0.010081 | 0.029234 | 0.025202 | 0.004032 | 0.015121 | 0.102823 | 0.072581 | 0.009073 | 0.027218 | 0.012097 | ... | 0.005040 | 0.001008 | 0.003024 | 0.009073 | 0.008065 | 0.005040 | 0.008065 | 0.998992 | 0.873992 | 1.000000 |
5 rows × 243391 columns
Each row of the celltype-by-peaks matrix represents a cell type, each column represents a peak, and the corresponding value represents the proportion of cells in that celltype where the peak is open. This table needs to be prepared in advance. Specific method: First binarize the peak-cell matrix, where 0 represents closed and 1 represents open, then calculate the proportion of open to total.Organize peak_window, chrom, start, end information for all peaks involved in the data, preparing for subsequent statistics on whether trait-associated SNPs cover peak information
%%time
# Generate initial DataFrame
all_peaks = pd.DataFrame(peaks.columns, columns=['peak'])

split_result = all_peaks['peak'].str.split('-', expand=True)
all_peaks['peak_window'] = split_result[1] + "_" + split_result[2]  # Direct string concatenation
all_peaks['chrom'] = split_result[0]
all_peaks['start'] = split_result[1].astype(int)  # Convert to integer
all_peaks['end'] = split_result[2].astype(int)

# Set index
all_peaks = all_peaks.set_index('peak')
all_peaks.head(4)Wall time: 948 ms
| peak_window | chrom | start | end | |
|---|---|---|---|---|
| peak | ||||
| chr1-9815-10616 | 9815_10616 | chr1 | 9815 | 10616 |
| chr1-180437-181865 | 180437_181865 | chr1 | 180437 | 181865 |
| chr1-190528-191930 | 190528_191930 | chr1 | 190528 | 191930 |
| chr1-267655-268361 | 267655_268361 | chr1 | 267655 | 268361 |
# select a window size (bp) of interest (by default it is 500bp)
window_size=500
window_adjustment=(window_size-500)/2
#print('adjustment '+str(window_adjustment))
window_size_for_filename='peak_width_'+str(window_size)
#print(window_size_for_filename)

all_peaks['start']=all_peaks['start'].apply(lambda x: x-window_adjustment)
all_peaks['end']=all_peaks['end'].apply(lambda x: x+window_adjustment)

all_peaks| peak_window | chrom | start | end | |
|---|---|---|---|---|
| peak | ||||
| chr1-9815-10616 | 9815_10616 | chr1 | 9815.0 | 10616.0 |
| chr1-180437-181865 | 180437_181865 | chr1 | 180437.0 | 181865.0 |
| chr1-190528-191930 | 190528_191930 | chr1 | 190528.0 | 191930.0 |
| chr1-267655-268361 | 267655_268361 | chr1 | 267655.0 | 268361.0 |
| chr1-629577-630313 | 629577_630313 | chr1 | 629577.0 | 630313.0 |
| ... | ... | ... | ... | ... |
| chrY-56873556-56874208 | 56873556_56874208 | chrY | 56873556.0 | 56874208.0 |
| chrY-56879530-56880478 | 56879530_56880478 | chrY | 56879530.0 | 56880478.0 |
| chrM-11-4079 | 11_4079 | chrM | 11.0 | 4079.0 |
| chrM-6124-6729 | 6124_6729 | chrM | 6124.0 | 6729.0 |
| chrM-9885-16556 | 9885_16556 | chrM | 9885.0 | 16556.0 |
243391 rows × 4 columns
# get list of celltypes for subsequent analyses
cell_types=peaks.index.unique().tolist()
cell_types'Macrophage',
'Endothelial_cells',
'T_cells',
'Smooth_muscle_cells',
'Keratinocytes',
'DC',
'B_cell']
# Set threshold for binarisation
threshold_for_filename=str(threshold).replace('.','p')
print(threshold_for_filename)Based on all trait information in the SNP_path, count the total number of SNPs for each trait in this enrichment analysis, including SNPs and those in linkage disequilibrium
%%time

# make a table of metadata about the SNP files
md_efo_terms=[]
md_n_SNPs=[]


files=os.listdir(SNP_path)

for file in files:

    efo_term=str(file.split('_')[0])
    md_efo_terms.append(efo_term)

    snps_df=pd.read_csv(f'{SNP_path}{file}')
    snps_df=snps_df.set_index('SNP_id')

    snps_df["Chrom"] = snps_df['Chrom'].apply(lambda x: 'chr'+str(x)).str.split('.',expand=True)[0] # creates a new 'chrom' column and should work even for X or M chromosomes

    md_n_SNPs.append(len(snps_df))

md_dict={
    'efo_term':md_efo_terms,
    'n_SNPs':md_n_SNPs
}


SNP_md=pd.DataFrame(md_dict)
SNP_md=SNP_md.set_index('efo_term')

SNP_md.sort_values('n_SNPs',ascending=False)Wall time: 802 ms
| n_SNPs | |
|---|---|
| efo_term | |
| chronic.lymphocytic.leukemia | 483 |
| neoplasm.of.mature.bcells | 285 |
| cardiomyopathy | 192 |
| ewing.sarcoma | 157 |
| chronic.myelogenous.leukemia | 139 |
| gastritis | 121 |
| azoospermia | 118 |
| pancreatitis | 108 |
| myelodysplastic.syndrome | 102 |
| leukemia | 90 |
| papillary.renal.cell.carcinoma | 83 |
| head.and.neck.squamous.cell.carcinoma | 63 |
| hyperplasia | 61 |
| gastric.adenocarcinoma | 60 |
| chronic.pancreatitis | 57 |
| diffuse.gastric.adenocarcinoma | 56 |
| neoplasm | 51 |
| polyp | 27 |
| infectious.meningitis | 24 |
| portal.hypertension | 18 |
| nervous.system.disease | 11 |
| invasive.lobular.carcinoma | 6 |
| endocarditis | 4 |
efo_terms=SNP_md.index.unique().tolist()Count the number of trait-associated SNPs falling within known peak regions to form a peak-traits matrix
%%time
# Add on a column for each trait, indicating whether a SNP from that trait falls within a peak. This file varies with the which traits are assessed

all_peaks_path=f'{output_path}SNP_mapped_to_peaks/'
os.makedirs(all_peaks_path,
           exist_ok=True) # makes the directory
files=os.listdir(SNP_path)
for efo_term in efo_terms:
    file = [f for f in files if f"{efo_term}" in f]
    file = file[0]
    file_path = os.path.join(SNP_path, file)
    snps_df=pd.read_csv(file_path)
    snps_df=snps_df.set_index('SNP_id')
    snps_df["chrom"]=snps_df["Chrom"].apply(lambda x: 'chr' + str(x)).str.split('.', n=1).str[0]
    all_peaks[efo_term]=0
    for snp in range(len(snps_df["chrom"])): # This loop incrementally adds 1 if there is a SNP within a peak (open or closed)
        all_peaks[efo_term][(all_peaks['chrom'] == snps_df["chrom"][snp])&(all_peaks['start'] <= snps_df['POS'][snp])&(all_peaks['end'] >= snps_df['POS'][snp])]+=1 # Adds one for each SNP which falls inside a peak
all_peaks.to_csv(f'{all_peaks_path}all_peaks_with_SNPs_for_traits_incremental.csv')Wall time: 1min 33s
# Show number of SNPs falling in peaks, for each trait
efo_terms_to_drop=[]

for efo_term in efo_terms:
#    print(efo_id+': '+str(sum(all_peaks[efo_id])))
    if sum(all_peaks[efo_term]) == 0:
efo_terms_to_drop.append(efo_term)efo_terms=[efo_term for efo_term in efo_terms if efo_term not in efo_terms_to_drop]For each cell type, create a random background (1/0 binary matrix) by shuffling the open/closed labels of peaks for that cell type, such that a random set of peaks is labeled open, equal in number to the actual open peaks for that cell state. Repeat this operation to create 1000 random permutations
%%time
import numpy as np
import pandas as pd
import os
from datetime import datetime

permutations = range(n_permutations)
bin_mat_path = f'{output_path}binarised_permutation_matrices/'
os.makedirs(bin_mat_path, exist_ok=True)

for cell_type in cell_types:
    output_file = f'{bin_mat_path}{cell_type}_{n_permutations}_permutations_bin_threshold_{threshold_for_filename}_matrix.csv'

    if not os.path.isfile(output_file):
        print(f'{datetime.now().strftime("%H:%M:%S")}...generating binarised matrix for {cell_type}...')

        # Initialize DataFrame
        cell_df = pd.DataFrame(peaks.loc[cell_type])
        cell_df['peak'] = cell_df.index
        split_result = cell_df['peak'].str.split('-', expand=True)
        cell_df['chrom'] = split_result[0]
        cell_df['peak_window'] = split_result[1] + "_" + split_result[2]
        cell_df['start'] = split_result[1].astype(int)
        cell_df['end'] = split_result[2].astype(int)
        cell_df[f'{cell_type}_binarised_real'] = cell_df[cell_type].ge(threshold).astype(int)

        # Generate all permutation columns
        for perm in permutations:
            cell_df[f'{cell_type}_binarised_permutation_{perm}'] = np.random.permutation(cell_df[f'{cell_type}_binarised_real'])

        # Save at once
        cell_df.to_csv(output_file, index=True)
    else:
        print(f'NOT generating binarised matrix for {cell_type} since it already exists')

print('finished')NOT generating binarised matrix for Macrophage since it already exists
NOT generating binarised matrix for Endothelial_cells since it already exists
NOT generating binarised matrix for T_cells since it already exists
NOT generating binarised matrix for Smooth_muscle_cells since it already exists
NOT generating binarised matrix for Keratinocytes since it already exists
NOT generating binarised matrix for DC since it already exists
NOT generating binarised matrix for B_cell since it already exists
finished
CPU times: user 1.58 ms, sys: 976 μs, total: 2.56 ms
Wall time: 26.5 ms
Merge the randomized binary matrix for each cell type with the actual peak-traits matrix
%%time

joined_bin_mat_path = f'{output_path}binarised_permutation_matrices_joined_incremental/'
os.makedirs(joined_bin_mat_path, exist_ok=True)

for cell_type in cell_types:
    output_file = f'{joined_bin_mat_path}{cell_type}_{n_permutations}_permutations_for_traits_bin_threshold_{threshold_for_filename}_matrix_joined.csv'

    if not os.path.isfile(output_file):
        # Read generated binarized matrix
        binarised_matrix = pd.read_csv(
            f'{bin_mat_path}{cell_type}_{n_permutations}_permutations_bin_threshold_{threshold_for_filename}_matrix.csv'
        )

        # Clean and set index
        binarised_matrix.set_index('peak', inplace=True)  # Ensure index is unique peak column

        # Add column for SNP presence in peaks (assuming all_peaks is another DataFrame)
        # Method 1: Specify suffix
        binarised_matrix = binarised_matrix.join(
            all_peaks,
            lsuffix="_right"
        )

        # Save to new directory
        binarised_matrix.to_csv(output_file)
    else:
        print(f'NOT generating joined binarised matrix for {cell_type} since it already exists')

print('finished')NOT generating joined binarised matrix for Macrophage since it already exists
NOT generating joined binarised matrix for Endothelial_cells since it already exists
NOT generating joined binarised matrix for T_cells since it already exists
NOT generating joined binarised matrix for Smooth_muscle_cells since it already exists
NOT generating joined binarised matrix for Keratinocytes since it already exists
NOT generating joined binarised matrix for DC since it already exists
NOT generating joined binarised matrix for B_cell since it already exists
finished
CPU times: user 2.2 ms, sys: 21 μs, total: 2.22 ms
Wall time: 28 ms
For each trait and cell state, calculate the proportion of trait-associated SNPs falling within the open peaks of that cell state (SNP proportion). Calculate this SNP proportion for each random permutation as well. Then calculate the P-value, which is the proportion of times the random SNP proportion exceeds or equals the actual SNP proportion. Finally, use the Benjamini-Hochberg method to correct these P-values for multiple testing
%%time
import logging

# Set up logging
logging.basicConfig(level=logging.ERROR)


# Find the proportion of all peaks which are open in this celltype
enrichment_output_path=f'{output_path}enrichment_output/'
os.makedirs(enrichment_output_path,
           exist_ok=True) # makes the directory

list_of_output_dfs=[]

#now = datetime.now()
#current_time = now.strftime("%H:%M:%S")
#print(f'...================================================================...')
#print(f'...{current_time}:STARTING')
#print(f'...================================================================...')

# make some empty lists
proportion_of_SNPs_found_in_celltype_specific_open_peaks=[]
proportion_of_all_open_peaks_found_in_this_celltype=[]

n_times_proportions_of_SNPs_in_permuted_open_peaks_greater_than_observed_proportion=[]
mean_proportions_of_SNPs_in_open_peaks=[]
p_values=[]
efo_term_list=[]
cell_type_list=[]
n_SNPs_list=[]

cell_types_done=[]
n_cell_types_total=len(cell_types)

permutations=range(n_permutations)

print('...evaluating '+str(len(efo_terms))+' traits, across '+str(len(cell_types))+' cell types...')

for cell_type in cell_types:

    try:

        cell_types_done.append(cell_type)
        n_cell_types_done=len(cell_types_done)
        n_cell_types_remaining=n_cell_types_total-n_cell_types_done

        now = datetime.now()
        current_time = now.strftime("%H:%M:%S")
        print(f'...================================================================...')
        print(f'...{current_time}: {n_cell_types_remaining+1} of {n_cell_types_total} cell types remaining. Reading binarised matrix for {cell_type}...')
        print(f'...================================================================...')

        cell_bin_mat=pd.read_csv(f'{joined_bin_mat_path}{cell_type}_{n_permutations}_permutations_for_traits_bin_threshold_{threshold_for_filename}_matrix_joined.csv',index_col='peak')

        prop_bins_in_this_cell_type=(len(cell_bin_mat[cell_bin_mat[f'{cell_type}_binarised_real']==1]))/len(cell_bin_mat)


        for efo_term in efo_terms:

            # grab some metadata
            n_SNPs=SNP_md.loc[efo_term]['n_SNPs']

            # add columns which won't change until we run a new cell_type
            proportion_of_all_open_peaks_found_in_this_celltype.append(prop_bins_in_this_cell_type)
            cell_type_list.append(cell_type)

            # add columns which won't change until we run a new efo_id
            n_SNPs_list.append(n_SNPs)
            efo_term_list.append(efo_term)

            # subset to just open regions for this cell type
            # find the proportion of SNPs for this trait that lie within this cell types open peaks
            observed_proportion=(cell_bin_mat[efo_term][cell_bin_mat[f'{cell_type}_binarised_real']==1].sum())/(cell_bin_mat[efo_term].sum())

            proportion_of_SNPs_found_in_celltype_specific_open_peaks.append(observed_proportion)

            proportion_of_SNPs_found_in_permutations_of_celltype_specific_open_peaks=[]

            for permutation in permutations:
                proportion_of_SNPs_found_in_permutations_of_celltype_specific_open_peaks.append(cell_bin_mat[efo_term][cell_bin_mat[f'{cell_type}_binarised_permutation_{permutation}']==1].sum()/cell_bin_mat[efo_term].sum())

            proportions_of_SNPs_in_permuted_open_peaks_greater_than_observed_proportion = [i for i in proportion_of_SNPs_found_in_permutations_of_celltype_specific_open_peaks if i >= observed_proportion]

            n_times_proportions_of_SNPs_in_permuted_open_peaks_greater_than_observed_proportion.append(len(proportions_of_SNPs_in_permuted_open_peaks_greater_than_observed_proportion))

            p_values.append(len(proportions_of_SNPs_in_permuted_open_peaks_greater_than_observed_proportion)/len(permutations)) # p val is simply the proportion of null hypotheses 'observations' greater than the actual observed proportion

            mean_proportions_of_SNPs_in_open_peaks.append(sum(proportion_of_SNPs_found_in_permutations_of_celltype_specific_open_peaks)/len(proportion_of_SNPs_found_in_permutations_of_celltype_specific_open_peaks))

            # Plot histograms for each cell type
    #        plt.rcParams["figure.figsize"] = (20,10)
    #        plt.rcParams["figure.dpi"] = 300

    #        plt.hist(proportion_of_SNPs_found_in_permutations_of_celltype_specific_open_peaks,
    #                 bins=100,color='red',
    #                 range=(0,1),
    #                 histtype='stepfilled',edgecolor='none')
    #        plt.axvline(x=observed_proportion, color='blue', linestyle='--')
    #        plt.legend(['null: proportion of SNPs falling in randomly shuffled OC regions','observed: proportion of SNPs falling cell-type specific OC regions'])
    #        plt.title('cell type: '+cell_type+', trait: '+efo_id+', term: '+efo_term+', threshold for binarisation: '+threshold_for_filename)
    #        plt.savefig(f'{output_path}{efo_id}_{efo_term}_{cell_type}_{threshold_for_filename}_SNP_enrichment.png')
    #        plt.clf() #clears the current plot


    except KeyError as e:
        # Log the error
        logging.error(e)
        print(cell_type)

    # edited so that the file is written incrementally

    output_dict={
        'cell_type':cell_type_list,
        'proportion_of_all_open_peaks_found_in_this_celltype':proportion_of_all_open_peaks_found_in_this_celltype,
        'proportion_of_SNPs_found_in_celltype_specific_open_peaks':proportion_of_SNPs_found_in_celltype_specific_open_peaks,
        'mean_proportions_of_SNPs_in_open_peaks':mean_proportions_of_SNPs_in_open_peaks,
        'n_times_proportions_of_SNPs_in_permuted_open_peaks_greater_than_observed_proportion':n_times_proportions_of_SNPs_in_permuted_open_peaks_greater_than_observed_proportion,
        'p_value':p_values,
        'n_SNPs':n_SNPs_list,
        'efo_term':efo_term_list}

    output_df=pd.DataFrame(output_dict)

    list_of_output_dfs.append(output_df)
    combined_output_df=pd.concat(list_of_output_dfs)
    combined_output_df=combined_output_df.sort_values(by=['efo_term'])
    combined_output_df=combined_output_df.set_index('cell_type')
    combined_output_df.to_csv(f'{enrichment_output_path}{threshold_for_filename}_{window_size_for_filename}_SNPs_in_LD_all_traits_summary.csv')

now = datetime.now()
current_time = now.strftime("%H:%M:%S")
print(f'...================================================================...')
print(f'...{current_time}:FINSIHED')
print(f'...================================================================...')...================================================================...n CPU times: user 9min 9s, sys: 26.8 s, total: 9min 36s
Wall time: 17min 46s
neglog10_pval_sig_threshold=np.negative(np.log10(pval_sig_threshold))
neglog10_pval_sig_thresholdEnrichment Result Visualization
#combined_output_df=pd.read_csv(f'{output_path}{threshold_for_filename}_{window_size_for_filename}_SNPs_in_LD{LD_threshold_for_filename}_all_traits_summary.csv',index_col='cell_type')
combined_output_file=os.path.join(peaks_path, "celltype_by_peaks.csv")
combined_output_df=pd.read_csv("/PROJ2/FLOAT/advanced-analysis/Seek_module_dev/ATAC_SNPenrichment/demo/new_output/enrichment_output/0p05_peak_width_500_SNPs_in_LD_all_traits_summary.csv")
combined_output_df.head()| cell_type | proportion_of_all_open_peaks_found_in_this_celltype | proportion_of_SNPs_found_in_celltype_specific_open_peaks | mean_proportions_of_SNPs_in_open_peaks | n_times_proportions_of_SNPs_in_permuted_open_peaks_greater_than_observed_proportion | p_value | n_SNPs | efo_term | |
|---|---|---|---|---|---|---|---|---|
| 0 | Neurons | 0.075689 | 0.0 | 0.068429 | 1000 | 1.0 | 118 | azoospermia |
| 1 | Neurons | 0.075689 | 0.0 | 0.068429 | 1000 | 1.0 | 118 | azoospermia |
| 2 | Keratinocytes | 0.095275 | 0.0 | 0.092000 | 1000 | 1.0 | 118 | azoospermia |
| 3 | Smooth_muscle_cells | 0.061617 | 0.0 | 0.060429 | 1000 | 1.0 | 118 | azoospermia |
| 4 | T_cells | 0.038198 | 0.0 | 0.036643 | 1000 | 1.0 | 118 | azoospermia |
combined_output_df['efo_term']=combined_output_df['efo_term'].astype(str)#+"_"+combined_output_df['n_SNPs'].astype(str) # Add the n_SNPs - useful for later inspection
combined_output_df.head()| cell_type | proportion_of_all_open_peaks_found_in_this_celltype | proportion_of_SNPs_found_in_celltype_specific_open_peaks | mean_proportions_of_SNPs_in_open_peaks | n_times_proportions_of_SNPs_in_permuted_open_peaks_greater_than_observed_proportion | p_value | n_SNPs | efo_term | |
|---|---|---|---|---|---|---|---|---|
| 0 | Neurons | 0.075689 | 0.0 | 0.068429 | 1000 | 1.0 | 118 | azoospermia |
| 1 | Neurons | 0.075689 | 0.0 | 0.068429 | 1000 | 1.0 | 118 | azoospermia |
| 2 | Keratinocytes | 0.095275 | 0.0 | 0.092000 | 1000 | 1.0 | 118 | azoospermia |
| 3 | Smooth_muscle_cells | 0.061617 | 0.0 | 0.060429 | 1000 | 1.0 | 118 | azoospermia |
| 4 | T_cells | 0.038198 | 0.0 | 0.036643 | 1000 | 1.0 | 118 | azoospermia |
combined_output_df.proportion_of_SNPs_found_in_celltype_specific_open_peaks.hist(bins=100)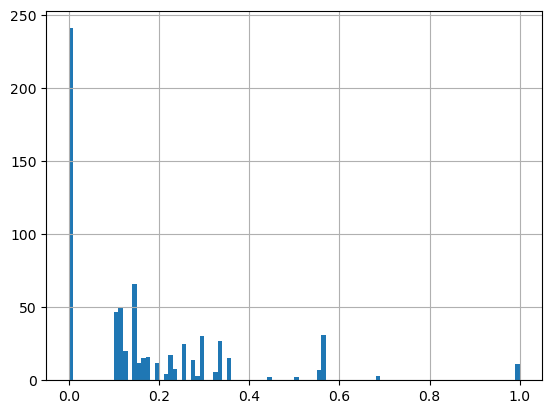
#pivot the table to prepare for heatmap
df=combined_output_df[['p_value',"cell_type",'efo_term']]
df.head()| p_value | cell_type | efo_term | |
|---|---|---|---|
| 0 | 1.0 | Neurons | azoospermia |
| 1 | 1.0 | Neurons | azoospermia |
| 2 | 1.0 | Keratinocytes | azoospermia |
| 3 | 1.0 | Smooth_muscle_cells | azoospermia |
| 4 | 1.0 | T_cells | azoospermia |
df=df.pivot_table(values='p_value',index='cell_type',columns='efo_term')
df| efo_term | azoospermia | cardiomyopathy | chronic.lymphocytic.leukemia | chronic.myelogenous.leukemia | chronic.pancreatitis | diffuse.gastric.adenocarcinoma | ewing.sarcoma | gastric.adenocarcinoma | gastritis | head.and.neck.squamous.cell.carcinoma | hyperplasia | leukemia | myelodysplastic.syndrome | neoplasm | neoplasm.of.mature.bcells | pancreatitis | papillary.renal.cell.carcinoma | polyp | portal.hypertension |
|---|---|---|---|---|---|---|---|---|---|---|---|---|---|---|---|---|---|---|---|
| cell_type | |||||||||||||||||||
| B_cell | 1.0 | 0.156 | 0.000 | 1.00 | 1.0 | 0.215 | 0.058 | 0.215 | 0.302 | 0.279 | 1.0 | 0.000 | 1.000 | 0.099 | 0.099 | 1.0 | 0.001 | 1.000 | 0.249 |
| DC | 1.0 | 0.011 | 0.003 | 1.00 | 1.0 | 0.205 | 1.000 | 0.205 | 0.266 | 0.013 | 1.0 | 0.003 | 0.123 | 0.072 | 0.072 | 1.0 | 0.002 | 1.000 | 0.247 |
| Endothelial_cells | 1.0 | 0.008 | 0.000 | 1.00 | 1.0 | 0.392 | 0.066 | 0.392 | 0.475 | 0.203 | 1.0 | 0.000 | 0.254 | 0.323 | 0.323 | 1.0 | 0.004 | 1.000 | 0.112 |
| Keratinocytes | 1.0 | 0.025 | 0.002 | 1.00 | 1.0 | 1.000 | 0.028 | 1.000 | 0.508 | 0.172 | 1.0 | 0.002 | 0.260 | 0.301 | 0.301 | 1.0 | 0.000 | 0.102 | 0.103 |
| Macrophage | 1.0 | 0.190 | 0.000 | 1.00 | 1.0 | 0.252 | 0.072 | 0.252 | 0.311 | 0.003 | 1.0 | 0.000 | 1.000 | 0.106 | 0.106 | 1.0 | 0.000 | 1.000 | 0.277 |
| Neurons | 1.0 | 0.144 | 0.004 | 0.19 | 1.0 | 0.291 | 0.170 | 0.291 | 0.438 | 0.139 | 1.0 | 0.004 | 0.210 | 0.321 | 0.321 | 1.0 | 0.000 | 0.087 | 0.068 |
| Smooth_muscle_cells | 1.0 | 0.105 | 0.002 | 1.00 | 1.0 | 1.000 | 0.254 | 1.000 | 0.376 | 0.363 | 1.0 | 0.002 | 0.179 | 0.232 | 0.232 | 1.0 | 0.000 | 1.000 | 0.054 |
| T_cells | 1.0 | 0.102 | 0.005 | 1.00 | 1.0 | 1.000 | 1.000 | 1.000 | 0.229 | 0.237 | 1.0 | 0.005 | 1.000 | 0.133 | 0.133 | 1.0 | 0.000 | 1.000 | 0.184 |
# drop columns where p value is all 1 (i.e. nothing at all significant)
print(df.shape)
df=df.loc[:, (df != 1).any(axis=0)]
print(df.shape)(8, 15)
# drop columns where p value is all 0 (i.e. no open peaks)
print(df.shape)
df=df.loc[:, (df != 0).any(axis=0)]
print(df.shape)(8, 15)
plt.rcParams['figure.dpi'] = 100

tmp=df.loc[:, (df > 0.05).any(axis=0)]
tmp=tmp.loc[(tmp > 0.05).any(axis=1),:]

g=sns.clustermap(tmp,
               xticklabels=True,
               yticklabels=True,
               cmap='OrRd',
               figsize=(tmp.shape[1]*0.3,tmp.shape[0]*0.3),
#               annot=anno_df,
               fmt = '',
               dendrogram_ratio=0.05,
               cbar_pos=(0.98,0.9,0.02,0.1)
              )

for a in g.ax_row_dendrogram.collections:
    a.set_linewidth(1)

for a in g.ax_col_dendrogram.collections:
    a.set_linewidth(1)

ax = g.ax_heatmap
ax.set_xlabel('GWAS traits')
ax.set_ylabel('Cell types')
plt.show()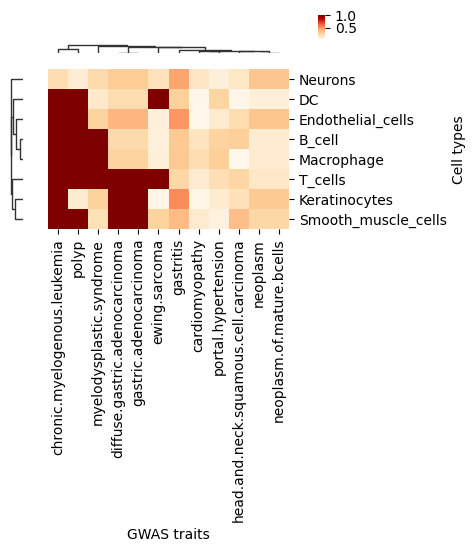
print("Original data description:")
print(df.describe())
plt.figure()
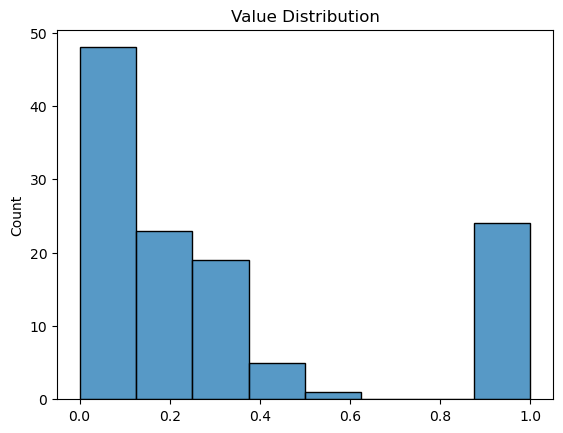
sns.histplot(df.values.flatten())
plt.title('Value Distribution')
plt.show()efo_term cardiomyopathy chronic.lymphocytic.leukemia \\
count 8.000000 8.000000
mean 0.092625 0.002000
std 0.070484 0.001927
min 0.008000 0.000000
25% 0.021500 0.000000
50% 0.103500 0.002000
75% 0.147000 0.003250
max 0.190000 0.005000
efo_term chronic.myelogenous.leukemia diffuse.gastric.adenocarcinoma \\
count 8.000000 8.000000
mean 0.898750 0.544375
std 0.286378 0.381603
min 0.190000 0.205000
25% 1.000000 0.242750
50% 1.000000 0.341500
75% 1.000000 1.000000
max 1.000000 1.000000
efo_term ewing.sarcoma gastric.adenocarcinoma gastritis \\
count 8.000000 8.000000 8.000000
mean 0.331000 0.544375 0.363125
std 0.419288 0.381603 0.102227
min 0.028000 0.205000 0.229000
25% 0.064000 0.242750 0.293000
50% 0.121000 0.341500 0.343500
75% 0.440500 1.000000 0.447250
max 1.000000 1.000000 0.508000
efo_term head.and.neck.squamous.cell.carcinoma leukemia \\
count 8.000000 8.000000
mean 0.176125 0.002000
std 0.124161 0.001927
min 0.003000 0.000000
25% 0.107500 0.000000
50% 0.187500 0.002000
75% 0.247500 0.003250
max 0.363000 0.005000
efo_term myelodysplastic.syndrome neoplasm neoplasm.of.mature.bcells \\
count 8.000000 8.000000 8.000000
mean 0.503250 0.198375 0.198375
std 0.413574 0.107493 0.107493
min 0.123000 0.072000 0.072000
25% 0.202250 0.104250 0.104250
50% 0.257000 0.182500 0.182500
75% 1.000000 0.306000 0.306000
max 1.000000 0.323000 0.323000
efo_term papillary.renal.cell.carcinoma polyp portal.hypertension
count 8.000000 8.000000 8.000000
mean 0.000875 0.773625 0.161750
std 0.001458 0.419184 0.088627
min 0.000000 0.087000 0.054000
25% 0.000000 0.775500 0.094250
50% 0.000000 1.000000 0.148000
75% 0.001250 1.000000 0.247500
max 0.004000 1.000000 0.277000
# multiple testing correction
import statsmodels.stats.multitest
from statsmodels.stats.multitest import multipletests

method='fdr_bh'
columns=df.columns.tolist()

# correct for multiple testing (each test being one cell type). Replacing the column with a corrected value
for column in columns:
    df[column]=statsmodels.stats.multitest.multipletests(df[column],method=method)[1]
df| efo_term | cardiomyopathy | chronic.lymphocytic.leukemia | chronic.myelogenous.leukemia | diffuse.gastric.adenocarcinoma | ewing.sarcoma | gastric.adenocarcinoma | gastritis | head.and.neck.squamous.cell.carcinoma | leukemia | myelodysplastic.syndrome | neoplasm | neoplasm.of.mature.bcells | papillary.renal.cell.carcinoma | polyp | portal.hypertension |
|---|---|---|---|---|---|---|---|---|---|---|---|---|---|---|---|
| cell_type | |||||||||||||||
| B_cell | 0.178286 | 0.000000 | 1.0 | 0.5820 | 0.144000 | 0.5820 | 0.508 | 0.318857 | 0.000000 | 1.000 | 0.266 | 0.266 | 0.001333 | 1.000 | 0.277 |
| DC | 0.044000 | 0.004000 | 1.0 | 0.5820 | 1.000000 | 0.5820 | 0.508 | 0.052000 | 0.004000 | 0.416 | 0.266 | 0.266 | 0.002286 | 1.000 | 0.277 |
| Endothelial_cells | 0.044000 | 0.000000 | 1.0 | 0.6272 | 0.144000 | 0.6272 | 0.508 | 0.316000 | 0.000000 | 0.416 | 0.323 | 0.323 | 0.004000 | 1.000 | 0.224 |
| Keratinocytes | 0.066667 | 0.003200 | 1.0 | 1.0000 | 0.144000 | 1.0000 | 0.508 | 0.316000 | 0.003200 | 0.416 | 0.323 | 0.323 | 0.000000 | 0.408 | 0.224 |
| Macrophage | 0.190000 | 0.000000 | 1.0 | 0.5820 | 0.144000 | 0.5820 | 0.508 | 0.024000 | 0.000000 | 1.000 | 0.266 | 0.266 | 0.000000 | 1.000 | 0.277 |
| Neurons | 0.178286 | 0.004571 | 1.0 | 0.5820 | 0.272000 | 0.5820 | 0.508 | 0.316000 | 0.004571 | 0.416 | 0.323 | 0.323 | 0.000000 | 0.408 | 0.224 |
| Smooth_muscle_cells | 0.168000 | 0.003200 | 1.0 | 1.0000 | 0.338667 | 1.0000 | 0.508 | 0.363000 | 0.003200 | 0.416 | 0.323 | 0.323 | 0.000000 | 1.000 | 0.224 |
| T_cells | 0.168000 | 0.005000 | 1.0 | 1.0000 | 1.000000 | 1.0000 | 0.508 | 0.316000 | 0.005000 | 1.000 | 0.266 | 0.266 | 0.000000 | 1.000 | 0.277 |
# Apply transformation
df = -np.log10(df)

# Handle all special values
df = df.replace([-0.0, 0.0], 0.0)  # Unify zero values
df = df.replace([np.inf, -np.inf], np.nan)  # Infinity to NaN

# Fill NaN with finite max value (skip NaN when calculating max)
if not df.isnull().all().all():
    max_val = df.max().max()  # Auto skip NaN
    df = df.fillna(max_val)
else:
    df = df.fillna(300)  # Case where all are infinity

df| efo_term | cardiomyopathy | chronic.lymphocytic.leukemia | chronic.myelogenous.leukemia | diffuse.gastric.adenocarcinoma | ewing.sarcoma | gastric.adenocarcinoma | gastritis | head.and.neck.squamous.cell.carcinoma | leukemia | myelodysplastic.syndrome | neoplasm | neoplasm.of.mature.bcells | papillary.renal.cell.carcinoma | polyp | portal.hypertension |
|---|---|---|---|---|---|---|---|---|---|---|---|---|---|---|---|
| cell_type | |||||||||||||||
| B_cell | 0.748883 | 2.875061 | 0.0 | 0.235077 | 0.841638 | 0.235077 | 0.294136 | 0.496404 | 2.875061 | 0.000000 | 0.575118 | 0.575118 | 2.875061 | 0.00000 | 0.557520 |
| DC | 1.356547 | 2.397940 | 0.0 | 0.235077 | 0.000000 | 0.235077 | 0.294136 | 1.283997 | 2.397940 | 0.380907 | 0.575118 | 0.575118 | 2.640978 | 0.00000 | 0.557520 |
| Endothelial_cells | 1.356547 | 2.875061 | 0.0 | 0.202594 | 0.841638 | 0.202594 | 0.294136 | 0.500313 | 2.875061 | 0.380907 | 0.490797 | 0.490797 | 2.397940 | 0.00000 | 0.649752 |
| Keratinocytes | 1.176091 | 2.494850 | 0.0 | 0.000000 | 0.841638 | 0.000000 | 0.294136 | 0.500313 | 2.494850 | 0.380907 | 0.490797 | 0.490797 | 2.875061 | 0.38934 | 0.649752 |
| Macrophage | 0.721246 | 2.875061 | 0.0 | 0.235077 | 0.841638 | 0.235077 | 0.294136 | 1.619789 | 2.875061 | 0.000000 | 0.575118 | 0.575118 | 2.875061 | 0.00000 | 0.557520 |
| Neurons | 0.748883 | 2.339948 | 0.0 | 0.235077 | 0.565431 | 0.235077 | 0.294136 | 0.500313 | 2.339948 | 0.380907 | 0.490797 | 0.490797 | 2.875061 | 0.38934 | 0.649752 |
| Smooth_muscle_cells | 0.774691 | 2.494850 | 0.0 | 0.000000 | 0.470228 | 0.000000 | 0.294136 | 0.440093 | 2.494850 | 0.380907 | 0.490797 | 0.490797 | 2.875061 | 0.00000 | 0.649752 |
| T_cells | 0.774691 | 2.301030 | 0.0 | 0.000000 | 0.000000 | 0.000000 | 0.294136 | 0.500313 | 2.301030 | 0.000000 | 0.575118 | 0.575118 | 2.875061 | 0.00000 | 0.557520 |
plt.rcParams['figure.dpi'] = 150

tmp=df.loc[:, (df > 1).any(axis=0)]
tmp=tmp.loc[(tmp > 1).any(axis=1),:]


g=sns.clustermap(tmp,
               xticklabels=True,
               yticklabels=True,
               cmap='OrRd',
               figsize=(5,5),
#               annot=anno_df,
               fmt = '',
               dendrogram_ratio=0.05,
               cbar_pos=(0.98,0.9,0.02,0.1),
                 vmax=4
              )


for a in g.ax_row_dendrogram.collections:
    a.set_linewidth(1)

for a in g.ax_col_dendrogram.collections:
    a.set_linewidth(1)

ax = g.ax_heatmap
ax.set_xlabel('GWAS traits')
ax.set_ylabel('Cell types')
plt.savefig(f'{output_path}overview_heatmap_SNP_enrichment.png')
plt.show()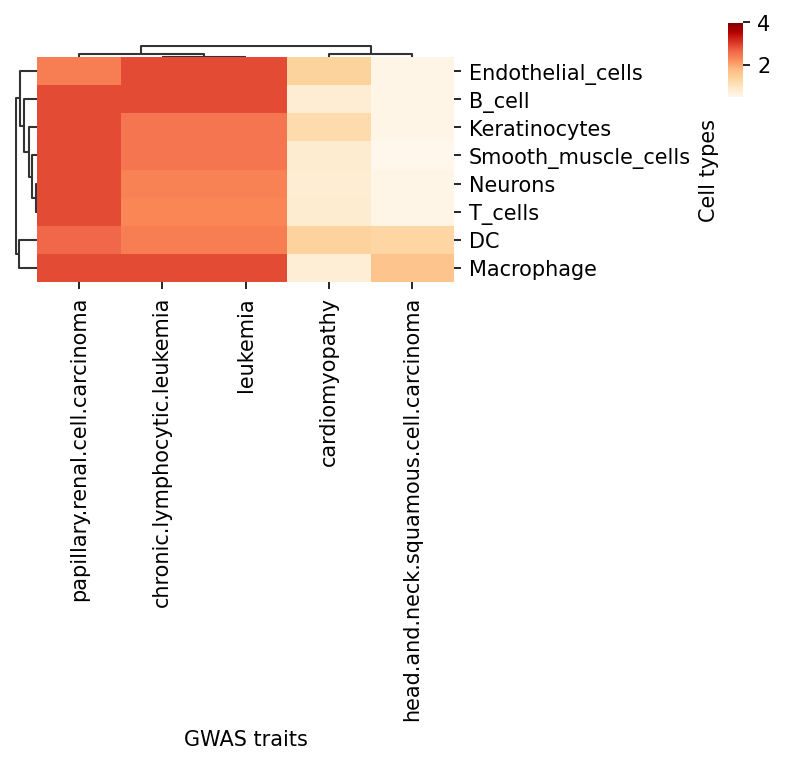
Remove traits not significantly enriched in any cell type
df=df.loc[:, (df > neglog10_pval_sig_threshold).any(axis=0)]
df=df.loc[(df > neglog10_pval_sig_threshold).any(axis=1),:]threshold=0.05plt.rcParams['figure.dpi'] = 100
# Make annotation df
anno_df=df.where(df<1, other="*")
anno_df=anno_df.where(anno_df=='*', other=" ")
anno_df=anno_df.astype(str)
g=sns.clustermap(df,
xticklabels=True,
yticklabels=True,
cmap='OrRd',
figsize=(6,6),
annot=anno_df,
fmt = '',
dendrogram_ratio=0.05,
cbar_pos=(0.98,0.9,0.02,0.1),
vmax=2
)
g.ax_col_dendrogram.set_title(f'Enrichment of cell type-specific open chromatin for GWAS trait SNPs.\n\nScale = -log(bh-corrected p-value)\n"*" = p<{pval_sig_threshold} (-log(p)>={neglog10_pval_sig_threshold}), "open threshold" = {threshold}')
for a in g.ax_row_dendrogram.collections:
a.set_linewidth(1)
for a in g.ax_col_dendrogram.collections:
a.set_linewidth(1)
ax = g.ax_heatmap
ax.set_xlabel('GWAS traits')
ax.set_ylabel('Cell types')
plt.savefig(f'{output_path}overview_heatmap_SNP_enrichment.png')
plt.show()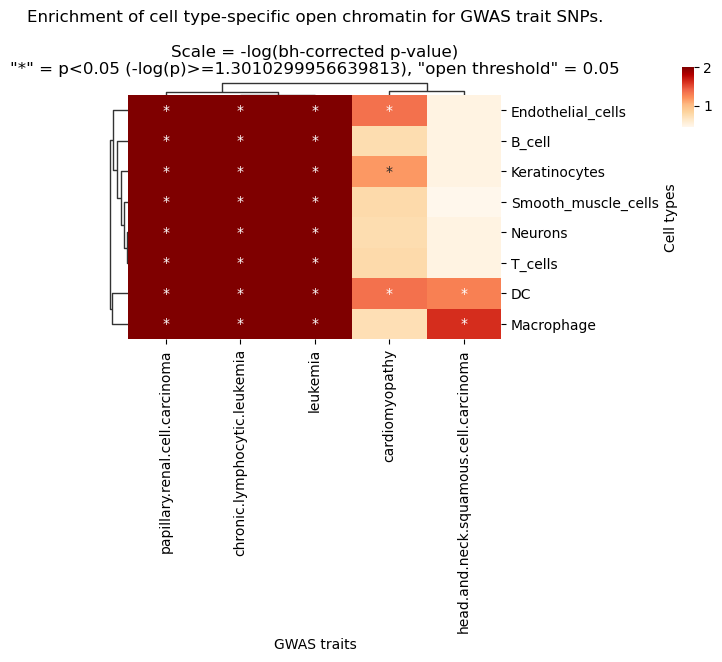
Remove uninteresting traits
df.columns'head.and.neck.squamous.cell.carcinoma', 'leukemia',
'papillary.renal.cell.carcinoma'],
dtype='object', name='efo_term')
df.columns = map(str.upper, df.columns)
df = df.reindex(sorted(df.columns), axis=1)
df.columns'HEAD.AND.NECK.SQUAMOUS.CELL.CARCINOMA', 'LEUKEMIA',
'PAPILLARY.RENAL.CELL.CARCINOMA'],
dtype='object')
plt.rcParams['figure.dpi'] = 60
plt.rcParams['font.size'] = 15     # Set global base font size
from matplotlib.colors import LinearSegmentedColormap
# Make annotation df
anno_df=df.where(df<neglog10_pval_sig_threshold, other="*")
anno_df=anno_df.where(anno_df=='*', other=" ")
anno_df=anno_df.astype(str)

#cmap_celadon = LinearSegmentedColormap.from_list('celadon_gradient',
#                colors = ["#DFEDEA","#B9EAE1", "#79D8C5", "#49C4AC","#17BCA0","#0A9E81"],
#                N=256)
#g=sns.clustermap(df,
#               xticklabels=True,
#               yticklabels=True,
               #cmap = cmap_celadon,
#               camp = "OrRd",
#               figsize=(8,12),
#               annot=anno_df,
#               fmt = '',
#               dendrogram_ratio=0.05,
#               cbar_pos=(0.98,0.9,0.02,0.1),
#                 vmax=5,
#                 row_cluster=False, col_cluster=False
#              )
g=sns.clustermap(df,
               xticklabels=True,
               yticklabels=True,
               cmap='OrRd',
               figsize=(10,10),
               annot=anno_df,
               fmt = '',
               dendrogram_ratio=0.05,
               cbar_pos=(0.98,0.9,0.02,0.1),
                 vmax=2,
                 row_cluster=False, col_cluster=False
              )

g.ax_col_dendrogram.set_title(f'Enrichment of cell-type-specific open chromatin for GWAS trait SNPs.\n\nScale = -log(BH-corrected p-value)\n\n"*" = p<{pval_sig_threshold} (-log(p)>={round(neglog10_pval_sig_threshold,2)})')

for a in g.ax_row_dendrogram.collections:
    a.set_linewidth(1)

for a in g.ax_col_dendrogram.collections:
    a.set_linewidth(1)

ax = g.ax_heatmap
ax.set_xlabel('GWAS traits')
ax.set_ylabel('Cell types')
plt.savefig(f'{output_path}overview_heatmap_SNP_enrichment_physiological.pdf',bbox_inches='tight')
plt.savefig(f'{output_path}overview_heatmap_SNP_enrichment_physiological.png')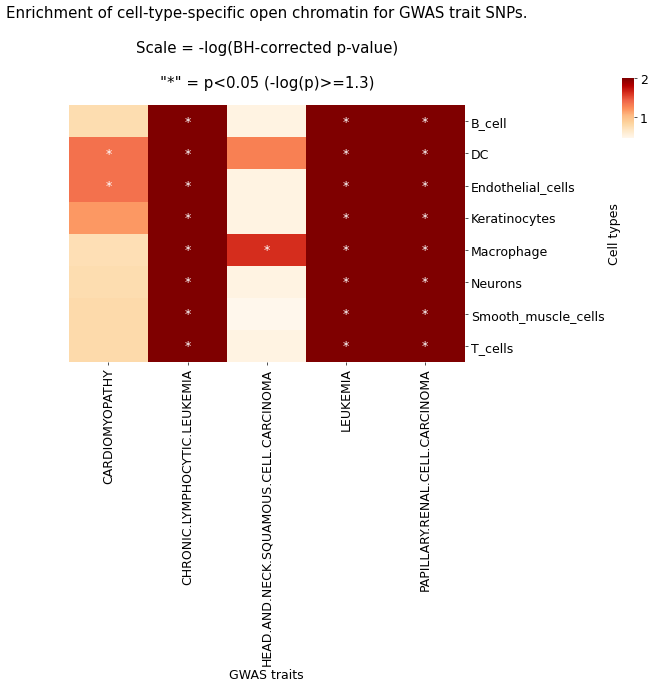
The heatmap shows the enrichment of GWAS trait-associated SNPs in cell-specific open chromatin regions. Colors represent -log(p) values corrected by the BH method; greener colors indicate greater significance. '*' indicates corrected p-value < 0.05, meaning GWAS traits are significantly enriched in the corresponding cell type.Result Files
├── enrichment_output
│ ├── 0p05_peak_width_500_SNPs_in_LD_all_traits_summary.csv
│ └── overview_heatmap_SNP_enrichment_physiological.pdf
Literature Case Analysis
《Spatially resolved multiomics of human cardiac niches》
In this study, the authors used scATAC-seq data to analyze the enrichment of GWAS trait SNPs associated with cardiac physiology and pathology across various cell types.
References
[1] Kanemaru K, Cranley J, Muraro D, et al.Spatially resolved multiomics of human cardiac niches[J].Nature, 2023.DOI: 10.1038/s41586-023-06311-1.
Appendix
.txt: Result data table files, separated by tabs. Unix/Linux/Mac users use less or more commands to view; Windows users use advanced text editors like Notepad++, or open with Microsoft Excel.
.pdf: Result image files, vector graphics, can be zoomed in/out without distortion, convenient for viewing and editing, can be edited using Adobe Illustrator for publication.
.rds: Seurat object containing gene activity assay, needs to be opened in R environment for viewing and further analysis.