scATAC-seq 变异分析:SNP 在染色质开放区域的富集
背景介绍
全基因组关联研究(GWAS)是解析复杂性状遗传基础的关键工具,其鉴定出的大量显著单核苷酸多态性(SNP)往往位于基因组的非编码调控区域。这提示这些 SNP 可能通过影响基因表达调控而非直接改变蛋白质编码序列来影响性状,其效应通常具有细胞类型或状态特异性。理解这些非编码变异如何在特定细胞背景下发挥作用,是揭示复杂性状分子机制的核心挑战。scATAC-seq 能够以单细胞分辨率在全基因组范围内刻画染色质的开放状态,从而精准地定义出不同细胞类型和活化状态下特异性的调控元件(如增强子、启动子)及其活性图谱。本分析旨在建立特定性状与关键细胞类型/状态之间的功能关联。核心策略是计算 GWAS 鉴定的性状相关 SNP(或其连锁区域内的标签 SNP)在各类细胞状态特异性开放染色质区域中的富集程度。
首先,基于 scATAC-seq 定义细胞状态特异的开放区域;其次,对于每个关注的 GWAS 性状(如疾病风险、血液生化指标、神经精神表型等),我们计算其 GWAS 显著 SNP 集合以及其紧密连锁的区域(如 LD 区块)出现在每个特定细胞状态开放区域内的频率。 通过统计检验(如超几何检验、置换检验等)评估该频率是否显著高于随机期望值。 从而揭示哪些细胞类型或活化状态可能是该性状遗传变异影响的主要“靶细胞”。
分析前期数据准备
在进行 SNP 富集分析之前,需要提前准备如下两种文件
(1)traits 相关 SNP 信息
以 azoospermia_with_SNP.csv 文件为例,
azoospermia 这个 trait 相关 SNP 的信息必须包含以下内容:
trait_name index_snps index_chrom index_pos SNP_id tagged_r2 POS
azoospermia rs7192 6 32443869 rs9268686 0.929192 32447745
azoospermia rs7192 6 32443869 rs9268670 0.937897 32446510
azoospermia rs7192 6 32443869 rs7195 1.000000 32444762
azoospermia rs7192 6 32443869 rs2213585 1.000000 32445373
azoospermia rs7192 6 32443869 rs567082101 0.937897 32453552
azoospermia rs7192 6 32443869 rs7775108 0.937897 32452461
azoospermia rs7192 6 32443869 rs9268783 0.937897 32452938
azoospermia rs7192 6 32443869 rs4935354 1.000000 32444621
azoospermia rs7192 6 32443869 rs78456540 0.914852 32586949
其中 trait_name 列是待分析的 trait 名称;index_snps 列表示这个 trait 相关的所有 SNP 信息,可能是几个,也可能是几百几千个,该信息来源于 GWAS 分析结果,也可以从 EBI 官网下载获取;index_chrom 列表示该 SNP 所在染色体编号;index_pos 列表示该 SNP 所在染色体具体位置;SNP_id 表示与前面 index_snps 具有连锁不平衡的 SNP;tagged_r2 则表示连锁不平衡的 r2 系数;POS 表示连锁不平衡的 SNP 所在的位置。
├── index_snps_with_LD_with_pos 该路径下存放着待分析的所有 traits 的 SNP 信息,每个 traits 单独成一个独立的 csv 文件
│ ├── azoospermia_with_SNP.csv
│ ├── cardiomyopathy_with_SNP.csv
│ ├── chronic.lymphocytic.leukemia_with_SNP.csv
│ ├── chronic.myelogenous.leukemia_with_SNP.csv
│ ├── chronic.pancreatitis_with_SNP.csv
│ ├── diffuse.gastric.adenocarcinoma_with_SNP.csv
│ ├── endocarditis_with_SNP.csv
│ ├── ewing.sarcoma_with_SNP.csv
│ ├── gastric.adenocarcinoma_with_SNP.csv
│ ├── gastritis_with_SNP.csv
│ ├── head.and.neck.squamous.cell.carcinoma_with_SNP.csv
│ ├── hyperplasia_with_SNP.csv
│ ├── infectious.meningitis_with_SNP.csv
│ ├── invasive.lobular.carcinoma_with_SNP.csv
│ ├── leukemia_with_SNP.csv
│ ├── myelodysplastic.syndrome_with_SNP.csv
│ ├── neoplasm.of.mature.bcells_with_SNP.csv
│ ├── neoplasm_with_SNP.csv
│ ├── nervous.system.disease_with_SNP.csv
│ ├── pancreatitis_with_SNP.csv
│ ├── papillary.renal.cell.carcinoma_with_SNP.csv
│ ├── polyp_with_SNP.csv
│ └── portal.hypertension_with_SNP.csv
(2)celltype-by-peak 矩阵
celltype-by-peak 矩阵行名是 celltype,列名是 peaks 信息,值表示在某一 celltype 中,该 peak 位置处于开放状态的细胞数占总细胞数的比例
└── peaks 该路径下存放着 celltype-by-peaks 的矩阵文件
│ └── celltype_by_peaks.csv
SNPenrichment 分析
import numpy as np
import pandas as pd
import scanpy as sc
import matplotlib.pyplot as plt
import seaborn as sns
from matplotlib.pyplot import rc_context
import bbknn
import re
import json
import os
import rpy2
import anndata
from datetime import date
import scipy.stats
from datetime import datetime
import requests
import logging

# YYYY-MM-DD
today = date.today()
today = today.strftime("%Y-%m-%d")

import warnings
warnings.filterwarnings('ignore')warnings.warn(
参数说明
peaks_path:存放 celltype_by_peaks.csv 文件的路径;
SNP_path:存放 traits 相关 SNP 信息的文件的路径;
n_permutations:置换检验的次数;
output_path:结果文件输出路径;
threshold:判断 celltype 在某一 peak 上是否开放的阈值;
pval_sig_threshold:富集显著性阈值。
peaks_path='/PROJ2/FLOAT/shumeng/project/scATAC_learn/Signac/example_data/joint.14/joint14.22/'
SNP_path='/PROJ2/FLOAT/advanced-analysis/Seek_module_dev/ATAC_SNPenrichment/demo/index_snps_with_LD_with_pos/'
n_permutations=1000
output_path="../result/"
threshold=0.05
pval_sig_threshold=0.05
读取 celltype-by-peaks 文件
os.makedirs("../result", exist_ok=True)
peakfile=os.path.join(peaks_path, "celltype_by_peaks.csv")
#print(f'{current_time}:...reading peak file...takes 5 mins...')
peaks=pd.read_csv(peakfile)

peaks.columns = peaks.columns.str.replace('Unnamed: 0', 'fine_grain')
peaks=peaks.set_index(peaks['fine_grain'])
peaks=peaks.drop(columns=['fine_grain'])

# replace characters which can break the code
peaks.index=peaks.index.str.replace('+', 'pos')
peaks.index=peaks.index.str.replace('/', '_or_')

now = datetime.now()
current_time = now.strftime("%H:%M:%S")
#print(f'{current_time}:...done.')
peaks.head()| chr1-9815-10616 | chr1-180437-181865 | chr1-190528-191930 | chr1-267655-268361 | chr1-629577-630313 | chr1-633636-634418 | chr1-778209-779399 | chr1-817017-817549 | chr1-819870-822573 | chr1-822744-823396 | ... | chrY-56861377-56861817 | chrY-56864364-56864795 | chrY-56868776-56869176 | chrY-56869677-56870379 | chrY-56870544-56871524 | chrY-56873556-56874208 | chrY-56879530-56880478 | chrM-11-4079 | chrM-6124-6729 | chrM-9885-16556 | |
|---|---|---|---|---|---|---|---|---|---|---|---|---|---|---|---|---|---|---|---|---|---|
| fine_grain | |||||||||||||||||||||
| Neurons | 0.011323 | 0.022375 | 0.039922 | 0.004150 | 0.013939 | 0.070913 | 0.091979 | 0.004827 | 0.025171 | 0.009473 | ... | 0.003473 | 0.002571 | 0.003338 | 0.006361 | 0.008030 | 0.004782 | 0.006135 | 0.996391 | 0.850956 | 0.999865 |
| Macrophage | 0.009381 | 0.023139 | 0.013133 | 0.001876 | 0.010006 | 0.058787 | 0.076923 | 0.012508 | 0.025641 | 0.008755 | ... | 0.002502 | 0.000000 | 0.004378 | 0.006879 | 0.007505 | 0.006254 | 0.005629 | 0.997498 | 0.846154 | 1.000000 |
| Endothelial_cells | 0.016760 | 0.050279 | 0.053073 | 0.005587 | 0.050279 | 0.212291 | 0.114525 | 0.008380 | 0.044693 | 0.002793 | ... | 0.011173 | 0.005587 | 0.005587 | 0.008380 | 0.016760 | 0.011173 | 0.005587 | 1.000000 | 0.977654 | 1.000000 |
| T_cells | 0.009019 | 0.022548 | 0.012401 | 0.000000 | 0.013529 | 0.072153 | 0.065389 | 0.004510 | 0.011274 | 0.005637 | ... | 0.003382 | 0.000000 | 0.001127 | 0.005637 | 0.011274 | 0.006764 | 0.006764 | 0.996618 | 0.906426 | 1.000000 |
| Smooth_muscle_cells | 0.010081 | 0.029234 | 0.025202 | 0.004032 | 0.015121 | 0.102823 | 0.072581 | 0.009073 | 0.027218 | 0.012097 | ... | 0.005040 | 0.001008 | 0.003024 | 0.009073 | 0.008065 | 0.005040 | 0.008065 | 0.998992 | 0.873992 | 1.000000 |
5 rows × 243391 columns
celltype-by-peaks 矩阵每行代表一种细胞类型,每列代表一个 peak,对应的值代表 celltype 在 peak 中处于开放状态的细胞数在 celltype 总细胞数的占比。这个表格需要自己提前制备。具体方法:首先将 peak-cell 矩阵二值化,其中 0 代表不开放,1 代表开放,然后统计开放和总数的占比所得。整理数据中所涉及所有 peaks 的 peak_window、chrom、start、end 信息,为后续统计 traits 相关 SNP 受否覆盖在 peaks 信息中做准备
%%time
# 生成初始DataFrame
all_peaks = pd.DataFrame(peaks.columns, columns=['peak'])

split_result = all_peaks['peak'].str.split('-', expand=True)
all_peaks['peak_window'] = split_result[1] + "_" + split_result[2]  # 直接字符串拼接
all_peaks['chrom'] = split_result[0]
all_peaks['start'] = split_result[1].astype(int)  # 转为整数
all_peaks['end'] = split_result[2].astype(int)

# 设置索引
all_peaks = all_peaks.set_index('peak')
all_peaks.head(4)Wall time: 948 ms
| peak_window | chrom | start | end | |
|---|---|---|---|---|
| peak | ||||
| chr1-9815-10616 | 9815_10616 | chr1 | 9815 | 10616 |
| chr1-180437-181865 | 180437_181865 | chr1 | 180437 | 181865 |
| chr1-190528-191930 | 190528_191930 | chr1 | 190528 | 191930 |
| chr1-267655-268361 | 267655_268361 | chr1 | 267655 | 268361 |
# select a window size (bp) of interest (by default it is 500bp)
window_size=500
window_adjustment=(window_size-500)/2
#print('adjustment '+str(window_adjustment))
window_size_for_filename='peak_width_'+str(window_size)
#print(window_size_for_filename)

all_peaks['start']=all_peaks['start'].apply(lambda x: x-window_adjustment)
all_peaks['end']=all_peaks['end'].apply(lambda x: x+window_adjustment)

all_peaks| peak_window | chrom | start | end | |
|---|---|---|---|---|
| peak | ||||
| chr1-9815-10616 | 9815_10616 | chr1 | 9815.0 | 10616.0 |
| chr1-180437-181865 | 180437_181865 | chr1 | 180437.0 | 181865.0 |
| chr1-190528-191930 | 190528_191930 | chr1 | 190528.0 | 191930.0 |
| chr1-267655-268361 | 267655_268361 | chr1 | 267655.0 | 268361.0 |
| chr1-629577-630313 | 629577_630313 | chr1 | 629577.0 | 630313.0 |
| ... | ... | ... | ... | ... |
| chrY-56873556-56874208 | 56873556_56874208 | chrY | 56873556.0 | 56874208.0 |
| chrY-56879530-56880478 | 56879530_56880478 | chrY | 56879530.0 | 56880478.0 |
| chrM-11-4079 | 11_4079 | chrM | 11.0 | 4079.0 |
| chrM-6124-6729 | 6124_6729 | chrM | 6124.0 | 6729.0 |
| chrM-9885-16556 | 9885_16556 | chrM | 9885.0 | 16556.0 |
243391 rows × 4 columns
# get list of celltypes for subsequent analyses
cell_types=peaks.index.unique().tolist()
cell_types'Macrophage',
'Endothelial_cells',
'T_cells',
'Smooth_muscle_cells',
'Keratinocytes',
'DC',
'B_cell']
# Set threshold for binarisation
threshold_for_filename=str(threshold).replace('.','p')
print(threshold_for_filename)根据 SNP_path 路径下包含的所有 traits 信息,统计此次富集分析中,每个 traits 包含的 SNP 总数,包含 SNP 和与之连锁不平衡的 SNP
%%time

# make a table of metadata about the SNP files
md_efo_terms=[]
md_n_SNPs=[]


files=os.listdir(SNP_path)

for file in files:

    efo_term=str(file.split('_')[0])
    md_efo_terms.append(efo_term)

    snps_df=pd.read_csv(f'{SNP_path}{file}')
    snps_df=snps_df.set_index('SNP_id')

    snps_df["Chrom"] = snps_df['Chrom'].apply(lambda x: 'chr'+str(x)).str.split('.',expand=True)[0] # creates a new 'chrom' column and should work even for X or M chromosomes

    md_n_SNPs.append(len(snps_df))

md_dict={
    'efo_term':md_efo_terms,
    'n_SNPs':md_n_SNPs
}


SNP_md=pd.DataFrame(md_dict)
SNP_md=SNP_md.set_index('efo_term')

SNP_md.sort_values('n_SNPs',ascending=False)Wall time: 802 ms
| n_SNPs | |
|---|---|
| efo_term | |
| chronic.lymphocytic.leukemia | 483 |
| neoplasm.of.mature.bcells | 285 |
| cardiomyopathy | 192 |
| ewing.sarcoma | 157 |
| chronic.myelogenous.leukemia | 139 |
| gastritis | 121 |
| azoospermia | 118 |
| pancreatitis | 108 |
| myelodysplastic.syndrome | 102 |
| leukemia | 90 |
| papillary.renal.cell.carcinoma | 83 |
| head.and.neck.squamous.cell.carcinoma | 63 |
| hyperplasia | 61 |
| gastric.adenocarcinoma | 60 |
| chronic.pancreatitis | 57 |
| diffuse.gastric.adenocarcinoma | 56 |
| neoplasm | 51 |
| polyp | 27 |
| infectious.meningitis | 24 |
| portal.hypertension | 18 |
| nervous.system.disease | 11 |
| invasive.lobular.carcinoma | 6 |
| endocarditis | 4 |
efo_terms=SNP_md.index.unique().tolist()统计 traits 相关 SNP 落在已知 peaks 区域内的个数,形成 peak-traits 矩阵
%%time
# Add on a column for each trait, indicating whether a SNP from that trait falls within a peak. This file varies with the which traits are assessed

all_peaks_path=f'{output_path}SNP_mapped_to_peaks/'
os.makedirs(all_peaks_path,
           exist_ok=True) # makes the directory
files=os.listdir(SNP_path)
for efo_term in efo_terms:
    file = [f for f in files if f"{efo_term}" in f]
    file = file[0]
    file_path = os.path.join(SNP_path, file)
    snps_df=pd.read_csv(file_path)
    snps_df=snps_df.set_index('SNP_id')
    snps_df["chrom"]=snps_df["Chrom"].apply(lambda x: 'chr' + str(x)).str.split('.', n=1).str[0]
    all_peaks[efo_term]=0
    for snp in range(len(snps_df["chrom"])): # This loop incrementally adds 1 if there is a SNP within a peak (open or closed)
        all_peaks[efo_term][(all_peaks['chrom'] == snps_df["chrom"][snp])&(all_peaks['start'] <= snps_df['POS'][snp])&(all_peaks['end'] >= snps_df['POS'][snp])]+=1 # Adds one for each SNP which falls inside a peak
all_peaks.to_csv(f'{all_peaks_path}all_peaks_with_SNPs_for_traits_incremental.csv')Wall time: 1min 33s
# Show number of SNPs falling in peaks, for each trait
efo_terms_to_drop=[]

for efo_term in efo_terms:
#    print(efo_id+': '+str(sum(all_peaks[efo_id])))
    if sum(all_peaks[efo_term]) == 0:
efo_terms_to_drop.append(efo_term)efo_terms=[efo_term for efo_term in efo_terms if efo_term not in efo_terms_to_drop]对于每个细胞类型,通过打乱该细胞类型峰的开放/关闭标签来创建随机背景(1/0 的二值化矩阵),使得随机的一组峰被标注为开放,其数量等于该细胞状态实际开放峰的数量。重复此操作以创建 1000 个随机排列
%%time
import numpy as np
import pandas as pd
import os
from datetime import datetime

permutations = range(n_permutations)
bin_mat_path = f'{output_path}binarised_permutation_matrices/'
os.makedirs(bin_mat_path, exist_ok=True)

for cell_type in cell_types:
    output_file = f'{bin_mat_path}{cell_type}_{n_permutations}_permutations_bin_threshold_{threshold_for_filename}_matrix.csv'

    if not os.path.isfile(output_file):
        print(f'{datetime.now().strftime("%H:%M:%S")}...generating binarised matrix for {cell_type}...')

        # 初始化 DataFrame
        cell_df = pd.DataFrame(peaks.loc[cell_type])
        cell_df['peak'] = cell_df.index
        split_result = cell_df['peak'].str.split('-', expand=True)
        cell_df['chrom'] = split_result[0]
        cell_df['peak_window'] = split_result[1] + "_" + split_result[2]
        cell_df['start'] = split_result[1].astype(int)
        cell_df['end'] = split_result[2].astype(int)
        cell_df[f'{cell_type}_binarised_real'] = cell_df[cell_type].ge(threshold).astype(int)

        # 生成所有 permutation 列
        for perm in permutations:
            cell_df[f'{cell_type}_binarised_permutation_{perm}'] = np.random.permutation(cell_df[f'{cell_type}_binarised_real'])

        # 一次性保存
        cell_df.to_csv(output_file, index=True)
    else:
        print(f'NOT generating binarised matrix for {cell_type} since it already exists')

print('finished')NOT generating binarised matrix for Macrophage since it already exists
NOT generating binarised matrix for Endothelial_cells since it already exists
NOT generating binarised matrix for T_cells since it already exists
NOT generating binarised matrix for Smooth_muscle_cells since it already exists
NOT generating binarised matrix for Keratinocytes since it already exists
NOT generating binarised matrix for DC since it already exists
NOT generating binarised matrix for B_cell since it already exists
finished
CPU times: user 1.58 ms, sys: 976 μs, total: 2.56 ms
Wall time: 26.5 ms
将每个细胞类型的随机排列的二值化矩阵与实际 peak-traits 矩阵进行合并
%%time

joined_bin_mat_path = f'{output_path}binarised_permutation_matrices_joined_incremental/'
os.makedirs(joined_bin_mat_path, exist_ok=True)

for cell_type in cell_types:
    output_file = f'{joined_bin_mat_path}{cell_type}_{n_permutations}_permutations_for_traits_bin_threshold_{threshold_for_filename}_matrix_joined.csv'

    if not os.path.isfile(output_file):
        # 读取已生成的二值化矩阵
        binarised_matrix = pd.read_csv(
            f'{bin_mat_path}{cell_type}_{n_permutations}_permutations_bin_threshold_{threshold_for_filename}_matrix.csv'
        )

        # 清理并设置索引
        binarised_matrix.set_index('peak', inplace=True)  # 确保索引是唯一的 peak 列

        # 添加 SNP 是否在 peaks 中的列(假设 all_peaks 是另一个 DataFrame)
        # 方法一:指定后缀
        binarised_matrix = binarised_matrix.join(
            all_peaks,
            lsuffix="_right"
        )

        # 保存到新目录
        binarised_matrix.to_csv(output_file)
    else:
        print(f'NOT generating joined binarised matrix for {cell_type} since it already exists')

print('finished')NOT generating joined binarised matrix for Macrophage since it already exists
NOT generating joined binarised matrix for Endothelial_cells since it already exists
NOT generating joined binarised matrix for T_cells since it already exists
NOT generating joined binarised matrix for Smooth_muscle_cells since it already exists
NOT generating joined binarised matrix for Keratinocytes since it already exists
NOT generating joined binarised matrix for DC since it already exists
NOT generating joined binarised matrix for B_cell since it already exists
finished
CPU times: user 2.2 ms, sys: 21 μs, total: 2.22 ms
Wall time: 28 ms
对于每个性状和细胞状态,计算该性状相关单核苷酸多态性(SNP)落在该细胞状态开放峰内的比例(SNP 比例)。对于每个随机排列也计算此 SNP 比例。然后可以计算 P 值,即随机 SNP 比例超过或等于实际 SNP 比例的次数所占的比例。最后,使用 Benjamini-Hochberg 方法对这些 P 值进行多重检验校正
%%time
import logging

# Set up logging
logging.basicConfig(level=logging.ERROR)


# Find the proportion of all peaks which are open in this celltype
enrichment_output_path=f'{output_path}enrichment_output/'
os.makedirs(enrichment_output_path,
           exist_ok=True) # makes the directory

list_of_output_dfs=[]

#now = datetime.now()
#current_time = now.strftime("%H:%M:%S")
#print(f'...================================================================...')
#print(f'...{current_time}:STARTING')
#print(f'...================================================================...')

# make some empty lists
proportion_of_SNPs_found_in_celltype_specific_open_peaks=[]
proportion_of_all_open_peaks_found_in_this_celltype=[]

n_times_proportions_of_SNPs_in_permuted_open_peaks_greater_than_observed_proportion=[]
mean_proportions_of_SNPs_in_open_peaks=[]
p_values=[]
efo_term_list=[]
cell_type_list=[]
n_SNPs_list=[]

cell_types_done=[]
n_cell_types_total=len(cell_types)

permutations=range(n_permutations)

print('...evaluating '+str(len(efo_terms))+' traits, across '+str(len(cell_types))+' cell types...')

for cell_type in cell_types:

    try:

        cell_types_done.append(cell_type)
        n_cell_types_done=len(cell_types_done)
        n_cell_types_remaining=n_cell_types_total-n_cell_types_done

        now = datetime.now()
        current_time = now.strftime("%H:%M:%S")
        print(f'...================================================================...')
        print(f'...{current_time}: {n_cell_types_remaining+1} of {n_cell_types_total} cell types remaining. Reading binarised matrix for {cell_type}...')
        print(f'...================================================================...')

        cell_bin_mat=pd.read_csv(f'{joined_bin_mat_path}{cell_type}_{n_permutations}_permutations_for_traits_bin_threshold_{threshold_for_filename}_matrix_joined.csv',index_col='peak')

        prop_bins_in_this_cell_type=(len(cell_bin_mat[cell_bin_mat[f'{cell_type}_binarised_real']==1]))/len(cell_bin_mat)


        for efo_term in efo_terms:

            # grab some metadata
            n_SNPs=SNP_md.loc[efo_term]['n_SNPs']

            # add columns which won't change until we run a new cell_type
            proportion_of_all_open_peaks_found_in_this_celltype.append(prop_bins_in_this_cell_type)
            cell_type_list.append(cell_type)

            # add columns which won't change until we run a new efo_id
            n_SNPs_list.append(n_SNPs)
            efo_term_list.append(efo_term)

            # subset to just open regions for this cell type
            # find the proportion of SNPs for this trait that lie within this cell types open peaks
            observed_proportion=(cell_bin_mat[efo_term][cell_bin_mat[f'{cell_type}_binarised_real']==1].sum())/(cell_bin_mat[efo_term].sum())

            proportion_of_SNPs_found_in_celltype_specific_open_peaks.append(observed_proportion)

            proportion_of_SNPs_found_in_permutations_of_celltype_specific_open_peaks=[]

            for permutation in permutations:
                proportion_of_SNPs_found_in_permutations_of_celltype_specific_open_peaks.append(cell_bin_mat[efo_term][cell_bin_mat[f'{cell_type}_binarised_permutation_{permutation}']==1].sum()/cell_bin_mat[efo_term].sum())

            proportions_of_SNPs_in_permuted_open_peaks_greater_than_observed_proportion = [i for i in proportion_of_SNPs_found_in_permutations_of_celltype_specific_open_peaks if i >= observed_proportion]

            n_times_proportions_of_SNPs_in_permuted_open_peaks_greater_than_observed_proportion.append(len(proportions_of_SNPs_in_permuted_open_peaks_greater_than_observed_proportion))

            p_values.append(len(proportions_of_SNPs_in_permuted_open_peaks_greater_than_observed_proportion)/len(permutations)) # p val is simply the proportion of null hypotheses 'observations' greater than the actual observed proportion

            mean_proportions_of_SNPs_in_open_peaks.append(sum(proportion_of_SNPs_found_in_permutations_of_celltype_specific_open_peaks)/len(proportion_of_SNPs_found_in_permutations_of_celltype_specific_open_peaks))

            # Plot histograms for each cell type
    #        plt.rcParams["figure.figsize"] = (20,10)
    #        plt.rcParams["figure.dpi"] = 300

    #        plt.hist(proportion_of_SNPs_found_in_permutations_of_celltype_specific_open_peaks,
    #                 bins=100,color='red',
    #                 range=(0,1),
    #                 histtype='stepfilled',edgecolor='none')
    #        plt.axvline(x=observed_proportion, color='blue', linestyle='--')
    #        plt.legend(['null: proportion of SNPs falling in randomly shuffled OC regions','observed: proportion of SNPs falling cell-type specific OC regions'])
    #        plt.title('cell type: '+cell_type+', trait: '+efo_id+', term: '+efo_term+', threshold for binarisation: '+threshold_for_filename)
    #        plt.savefig(f'{output_path}{efo_id}_{efo_term}_{cell_type}_{threshold_for_filename}_SNP_enrichment.png')
    #        plt.clf() #clears the current plot


    except KeyError as e:
        # Log the error
        logging.error(e)
        print(cell_type)

    # edited so that the file is written incrementally

    output_dict={
        'cell_type':cell_type_list,
        'proportion_of_all_open_peaks_found_in_this_celltype':proportion_of_all_open_peaks_found_in_this_celltype,
        'proportion_of_SNPs_found_in_celltype_specific_open_peaks':proportion_of_SNPs_found_in_celltype_specific_open_peaks,
        'mean_proportions_of_SNPs_in_open_peaks':mean_proportions_of_SNPs_in_open_peaks,
        'n_times_proportions_of_SNPs_in_permuted_open_peaks_greater_than_observed_proportion':n_times_proportions_of_SNPs_in_permuted_open_peaks_greater_than_observed_proportion,
        'p_value':p_values,
        'n_SNPs':n_SNPs_list,
        'efo_term':efo_term_list}

    output_df=pd.DataFrame(output_dict)

    list_of_output_dfs.append(output_df)
    combined_output_df=pd.concat(list_of_output_dfs)
    combined_output_df=combined_output_df.sort_values(by=['efo_term'])
    combined_output_df=combined_output_df.set_index('cell_type')
    combined_output_df.to_csv(f'{enrichment_output_path}{threshold_for_filename}_{window_size_for_filename}_SNPs_in_LD_all_traits_summary.csv')

now = datetime.now()
current_time = now.strftime("%H:%M:%S")
print(f'...================================================================...')
print(f'...{current_time}:FINSIHED')
print(f'...================================================================...')...================================================================...n CPU times: user 9min 9s, sys: 26.8 s, total: 9min 36s
Wall time: 17min 46s
neglog10_pval_sig_threshold=np.negative(np.log10(pval_sig_threshold))
neglog10_pval_sig_threshold富集结果可视化
#combined_output_df=pd.read_csv(f'{output_path}{threshold_for_filename}_{window_size_for_filename}_SNPs_in_LD{LD_threshold_for_filename}_all_traits_summary.csv',index_col='cell_type')
combined_output_file=os.path.join(peaks_path, "celltype_by_peaks.csv")
combined_output_df=pd.read_csv("/PROJ2/FLOAT/advanced-analysis/Seek_module_dev/ATAC_SNPenrichment/demo/new_output/enrichment_output/0p05_peak_width_500_SNPs_in_LD_all_traits_summary.csv")
combined_output_df.head()| cell_type | proportion_of_all_open_peaks_found_in_this_celltype | proportion_of_SNPs_found_in_celltype_specific_open_peaks | mean_proportions_of_SNPs_in_open_peaks | n_times_proportions_of_SNPs_in_permuted_open_peaks_greater_than_observed_proportion | p_value | n_SNPs | efo_term | |
|---|---|---|---|---|---|---|---|---|
| 0 | Neurons | 0.075689 | 0.0 | 0.068429 | 1000 | 1.0 | 118 | azoospermia |
| 1 | Neurons | 0.075689 | 0.0 | 0.068429 | 1000 | 1.0 | 118 | azoospermia |
| 2 | Keratinocytes | 0.095275 | 0.0 | 0.092000 | 1000 | 1.0 | 118 | azoospermia |
| 3 | Smooth_muscle_cells | 0.061617 | 0.0 | 0.060429 | 1000 | 1.0 | 118 | azoospermia |
| 4 | T_cells | 0.038198 | 0.0 | 0.036643 | 1000 | 1.0 | 118 | azoospermia |
combined_output_df['efo_term']=combined_output_df['efo_term'].astype(str)#+"_"+combined_output_df['n_SNPs'].astype(str) # Add the n_SNPs - useful for later inspection
combined_output_df.head()| cell_type | proportion_of_all_open_peaks_found_in_this_celltype | proportion_of_SNPs_found_in_celltype_specific_open_peaks | mean_proportions_of_SNPs_in_open_peaks | n_times_proportions_of_SNPs_in_permuted_open_peaks_greater_than_observed_proportion | p_value | n_SNPs | efo_term | |
|---|---|---|---|---|---|---|---|---|
| 0 | Neurons | 0.075689 | 0.0 | 0.068429 | 1000 | 1.0 | 118 | azoospermia |
| 1 | Neurons | 0.075689 | 0.0 | 0.068429 | 1000 | 1.0 | 118 | azoospermia |
| 2 | Keratinocytes | 0.095275 | 0.0 | 0.092000 | 1000 | 1.0 | 118 | azoospermia |
| 3 | Smooth_muscle_cells | 0.061617 | 0.0 | 0.060429 | 1000 | 1.0 | 118 | azoospermia |
| 4 | T_cells | 0.038198 | 0.0 | 0.036643 | 1000 | 1.0 | 118 | azoospermia |
combined_output_df.proportion_of_SNPs_found_in_celltype_specific_open_peaks.hist(bins=100)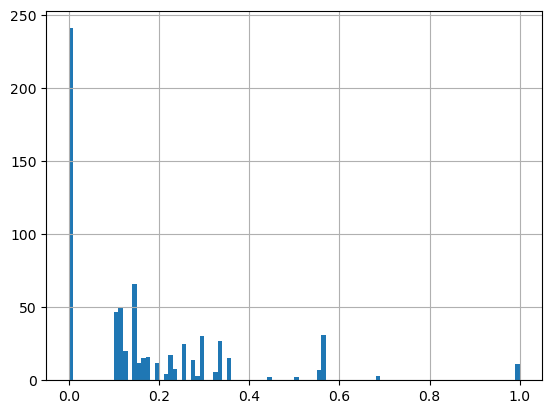
#pivot the table to prepare for heatmap
df=combined_output_df[['p_value',"cell_type",'efo_term']]
df.head()| p_value | cell_type | efo_term | |
|---|---|---|---|
| 0 | 1.0 | Neurons | azoospermia |
| 1 | 1.0 | Neurons | azoospermia |
| 2 | 1.0 | Keratinocytes | azoospermia |
| 3 | 1.0 | Smooth_muscle_cells | azoospermia |
| 4 | 1.0 | T_cells | azoospermia |
df=df.pivot_table(values='p_value',index='cell_type',columns='efo_term')
df| efo_term | azoospermia | cardiomyopathy | chronic.lymphocytic.leukemia | chronic.myelogenous.leukemia | chronic.pancreatitis | diffuse.gastric.adenocarcinoma | ewing.sarcoma | gastric.adenocarcinoma | gastritis | head.and.neck.squamous.cell.carcinoma | hyperplasia | leukemia | myelodysplastic.syndrome | neoplasm | neoplasm.of.mature.bcells | pancreatitis | papillary.renal.cell.carcinoma | polyp | portal.hypertension |
|---|---|---|---|---|---|---|---|---|---|---|---|---|---|---|---|---|---|---|---|
| cell_type | |||||||||||||||||||
| B_cell | 1.0 | 0.156 | 0.000 | 1.00 | 1.0 | 0.215 | 0.058 | 0.215 | 0.302 | 0.279 | 1.0 | 0.000 | 1.000 | 0.099 | 0.099 | 1.0 | 0.001 | 1.000 | 0.249 |
| DC | 1.0 | 0.011 | 0.003 | 1.00 | 1.0 | 0.205 | 1.000 | 0.205 | 0.266 | 0.013 | 1.0 | 0.003 | 0.123 | 0.072 | 0.072 | 1.0 | 0.002 | 1.000 | 0.247 |
| Endothelial_cells | 1.0 | 0.008 | 0.000 | 1.00 | 1.0 | 0.392 | 0.066 | 0.392 | 0.475 | 0.203 | 1.0 | 0.000 | 0.254 | 0.323 | 0.323 | 1.0 | 0.004 | 1.000 | 0.112 |
| Keratinocytes | 1.0 | 0.025 | 0.002 | 1.00 | 1.0 | 1.000 | 0.028 | 1.000 | 0.508 | 0.172 | 1.0 | 0.002 | 0.260 | 0.301 | 0.301 | 1.0 | 0.000 | 0.102 | 0.103 |
| Macrophage | 1.0 | 0.190 | 0.000 | 1.00 | 1.0 | 0.252 | 0.072 | 0.252 | 0.311 | 0.003 | 1.0 | 0.000 | 1.000 | 0.106 | 0.106 | 1.0 | 0.000 | 1.000 | 0.277 |
| Neurons | 1.0 | 0.144 | 0.004 | 0.19 | 1.0 | 0.291 | 0.170 | 0.291 | 0.438 | 0.139 | 1.0 | 0.004 | 0.210 | 0.321 | 0.321 | 1.0 | 0.000 | 0.087 | 0.068 |
| Smooth_muscle_cells | 1.0 | 0.105 | 0.002 | 1.00 | 1.0 | 1.000 | 0.254 | 1.000 | 0.376 | 0.363 | 1.0 | 0.002 | 0.179 | 0.232 | 0.232 | 1.0 | 0.000 | 1.000 | 0.054 |
| T_cells | 1.0 | 0.102 | 0.005 | 1.00 | 1.0 | 1.000 | 1.000 | 1.000 | 0.229 | 0.237 | 1.0 | 0.005 | 1.000 | 0.133 | 0.133 | 1.0 | 0.000 | 1.000 | 0.184 |
# drop columns where p value is all 1 (i.e. nothing at all significant)
print(df.shape)
df=df.loc[:, (df != 1).any(axis=0)]
print(df.shape)(8, 15)
# drop columns where p value is all 0 (i.e. no open peaks)
print(df.shape)
df=df.loc[:, (df != 0).any(axis=0)]
print(df.shape)(8, 15)
plt.rcParams['figure.dpi'] = 100

tmp=df.loc[:, (df > 0.05).any(axis=0)]
tmp=tmp.loc[(tmp > 0.05).any(axis=1),:]

g=sns.clustermap(tmp,
               xticklabels=True,
               yticklabels=True,
               cmap='OrRd',
               figsize=(tmp.shape[1]*0.3,tmp.shape[0]*0.3),
#               annot=anno_df,
               fmt = '',
               dendrogram_ratio=0.05,
               cbar_pos=(0.98,0.9,0.02,0.1)
              )

for a in g.ax_row_dendrogram.collections:
    a.set_linewidth(1)

for a in g.ax_col_dendrogram.collections:
    a.set_linewidth(1)

ax = g.ax_heatmap
ax.set_xlabel('GWAS traits')
ax.set_ylabel('Cell types')
plt.show()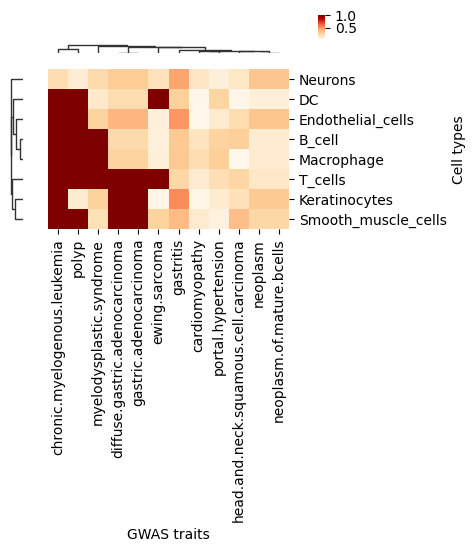
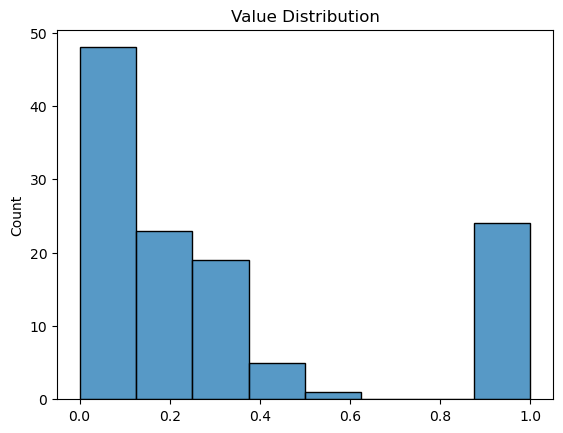
print("原始数据描述:")
print(df.describe())
plt.figure()
sns.histplot(df.values.flatten())
plt.title('Value Distribution')
plt.show()efo_term cardiomyopathy chronic.lymphocytic.leukemia \\
count 8.000000 8.000000
mean 0.092625 0.002000
std 0.070484 0.001927
min 0.008000 0.000000
25% 0.021500 0.000000
50% 0.103500 0.002000
75% 0.147000 0.003250
max 0.190000 0.005000
efo_term chronic.myelogenous.leukemia diffuse.gastric.adenocarcinoma \\
count 8.000000 8.000000
mean 0.898750 0.544375
std 0.286378 0.381603
min 0.190000 0.205000
25% 1.000000 0.242750
50% 1.000000 0.341500
75% 1.000000 1.000000
max 1.000000 1.000000
efo_term ewing.sarcoma gastric.adenocarcinoma gastritis \\
count 8.000000 8.000000 8.000000
mean 0.331000 0.544375 0.363125
std 0.419288 0.381603 0.102227
min 0.028000 0.205000 0.229000
25% 0.064000 0.242750 0.293000
50% 0.121000 0.341500 0.343500
75% 0.440500 1.000000 0.447250
max 1.000000 1.000000 0.508000
efo_term head.and.neck.squamous.cell.carcinoma leukemia \\
count 8.000000 8.000000
mean 0.176125 0.002000
std 0.124161 0.001927
min 0.003000 0.000000
25% 0.107500 0.000000
50% 0.187500 0.002000
75% 0.247500 0.003250
max 0.363000 0.005000
efo_term myelodysplastic.syndrome neoplasm neoplasm.of.mature.bcells \\
count 8.000000 8.000000 8.000000
mean 0.503250 0.198375 0.198375
std 0.413574 0.107493 0.107493
min 0.123000 0.072000 0.072000
25% 0.202250 0.104250 0.104250
50% 0.257000 0.182500 0.182500
75% 1.000000 0.306000 0.306000
max 1.000000 0.323000 0.323000
efo_term papillary.renal.cell.carcinoma polyp portal.hypertension
count 8.000000 8.000000 8.000000
mean 0.000875 0.773625 0.161750
std 0.001458 0.419184 0.088627
min 0.000000 0.087000 0.054000
25% 0.000000 0.775500 0.094250
50% 0.000000 1.000000 0.148000
75% 0.001250 1.000000 0.247500
max 0.004000 1.000000 0.277000
# multiple testing correction
import statsmodels.stats.multitest
from statsmodels.stats.multitest import multipletests

method='fdr_bh'
columns=df.columns.tolist()

# correct for multiple testing (each test being one cell type). Replacing the column with a corrected value
for column in columns:
    df[column]=statsmodels.stats.multitest.multipletests(df[column],method=method)[1]
df| efo_term | cardiomyopathy | chronic.lymphocytic.leukemia | chronic.myelogenous.leukemia | diffuse.gastric.adenocarcinoma | ewing.sarcoma | gastric.adenocarcinoma | gastritis | head.and.neck.squamous.cell.carcinoma | leukemia | myelodysplastic.syndrome | neoplasm | neoplasm.of.mature.bcells | papillary.renal.cell.carcinoma | polyp | portal.hypertension |
|---|---|---|---|---|---|---|---|---|---|---|---|---|---|---|---|
| cell_type | |||||||||||||||
| B_cell | 0.178286 | 0.000000 | 1.0 | 0.5820 | 0.144000 | 0.5820 | 0.508 | 0.318857 | 0.000000 | 1.000 | 0.266 | 0.266 | 0.001333 | 1.000 | 0.277 |
| DC | 0.044000 | 0.004000 | 1.0 | 0.5820 | 1.000000 | 0.5820 | 0.508 | 0.052000 | 0.004000 | 0.416 | 0.266 | 0.266 | 0.002286 | 1.000 | 0.277 |
| Endothelial_cells | 0.044000 | 0.000000 | 1.0 | 0.6272 | 0.144000 | 0.6272 | 0.508 | 0.316000 | 0.000000 | 0.416 | 0.323 | 0.323 | 0.004000 | 1.000 | 0.224 |
| Keratinocytes | 0.066667 | 0.003200 | 1.0 | 1.0000 | 0.144000 | 1.0000 | 0.508 | 0.316000 | 0.003200 | 0.416 | 0.323 | 0.323 | 0.000000 | 0.408 | 0.224 |
| Macrophage | 0.190000 | 0.000000 | 1.0 | 0.5820 | 0.144000 | 0.5820 | 0.508 | 0.024000 | 0.000000 | 1.000 | 0.266 | 0.266 | 0.000000 | 1.000 | 0.277 |
| Neurons | 0.178286 | 0.004571 | 1.0 | 0.5820 | 0.272000 | 0.5820 | 0.508 | 0.316000 | 0.004571 | 0.416 | 0.323 | 0.323 | 0.000000 | 0.408 | 0.224 |
| Smooth_muscle_cells | 0.168000 | 0.003200 | 1.0 | 1.0000 | 0.338667 | 1.0000 | 0.508 | 0.363000 | 0.003200 | 0.416 | 0.323 | 0.323 | 0.000000 | 1.000 | 0.224 |
| T_cells | 0.168000 | 0.005000 | 1.0 | 1.0000 | 1.000000 | 1.0000 | 0.508 | 0.316000 | 0.005000 | 1.000 | 0.266 | 0.266 | 0.000000 | 1.000 | 0.277 |
# 应用变换
df = -np.log10(df)

# 处理所有特殊值
df = df.replace([-0.0, 0.0], 0.0)  # 统一零值
df = df.replace([np.inf, -np.inf], np.nan)  # 无穷大转NaN

# 用有限值最大值填充NaN(跳过NaN计算最大值)
if not df.isnull().all().all():
    max_val = df.max().max()  # 自动跳过NaN
    df = df.fillna(max_val)
else:
    df = df.fillna(300)  # 全为无穷大的情况

df| efo_term | cardiomyopathy | chronic.lymphocytic.leukemia | chronic.myelogenous.leukemia | diffuse.gastric.adenocarcinoma | ewing.sarcoma | gastric.adenocarcinoma | gastritis | head.and.neck.squamous.cell.carcinoma | leukemia | myelodysplastic.syndrome | neoplasm | neoplasm.of.mature.bcells | papillary.renal.cell.carcinoma | polyp | portal.hypertension |
|---|---|---|---|---|---|---|---|---|---|---|---|---|---|---|---|
| cell_type | |||||||||||||||
| B_cell | 0.748883 | 2.875061 | 0.0 | 0.235077 | 0.841638 | 0.235077 | 0.294136 | 0.496404 | 2.875061 | 0.000000 | 0.575118 | 0.575118 | 2.875061 | 0.00000 | 0.557520 |
| DC | 1.356547 | 2.397940 | 0.0 | 0.235077 | 0.000000 | 0.235077 | 0.294136 | 1.283997 | 2.397940 | 0.380907 | 0.575118 | 0.575118 | 2.640978 | 0.00000 | 0.557520 |
| Endothelial_cells | 1.356547 | 2.875061 | 0.0 | 0.202594 | 0.841638 | 0.202594 | 0.294136 | 0.500313 | 2.875061 | 0.380907 | 0.490797 | 0.490797 | 2.397940 | 0.00000 | 0.649752 |
| Keratinocytes | 1.176091 | 2.494850 | 0.0 | 0.000000 | 0.841638 | 0.000000 | 0.294136 | 0.500313 | 2.494850 | 0.380907 | 0.490797 | 0.490797 | 2.875061 | 0.38934 | 0.649752 |
| Macrophage | 0.721246 | 2.875061 | 0.0 | 0.235077 | 0.841638 | 0.235077 | 0.294136 | 1.619789 | 2.875061 | 0.000000 | 0.575118 | 0.575118 | 2.875061 | 0.00000 | 0.557520 |
| Neurons | 0.748883 | 2.339948 | 0.0 | 0.235077 | 0.565431 | 0.235077 | 0.294136 | 0.500313 | 2.339948 | 0.380907 | 0.490797 | 0.490797 | 2.875061 | 0.38934 | 0.649752 |
| Smooth_muscle_cells | 0.774691 | 2.494850 | 0.0 | 0.000000 | 0.470228 | 0.000000 | 0.294136 | 0.440093 | 2.494850 | 0.380907 | 0.490797 | 0.490797 | 2.875061 | 0.00000 | 0.649752 |
| T_cells | 0.774691 | 2.301030 | 0.0 | 0.000000 | 0.000000 | 0.000000 | 0.294136 | 0.500313 | 2.301030 | 0.000000 | 0.575118 | 0.575118 | 2.875061 | 0.00000 | 0.557520 |
plt.rcParams['figure.dpi'] = 150

tmp=df.loc[:, (df > 1).any(axis=0)]
tmp=tmp.loc[(tmp > 1).any(axis=1),:]


g=sns.clustermap(tmp,
               xticklabels=True,
               yticklabels=True,
               cmap='OrRd',
               figsize=(5,5),
#               annot=anno_df,
               fmt = '',
               dendrogram_ratio=0.05,
               cbar_pos=(0.98,0.9,0.02,0.1),
                 vmax=4
              )


for a in g.ax_row_dendrogram.collections:
    a.set_linewidth(1)

for a in g.ax_col_dendrogram.collections:
    a.set_linewidth(1)

ax = g.ax_heatmap
ax.set_xlabel('GWAS traits')
ax.set_ylabel('Cell types')
plt.savefig(f'{output_path}overview_heatmap_SNP_enrichment.png')
plt.show()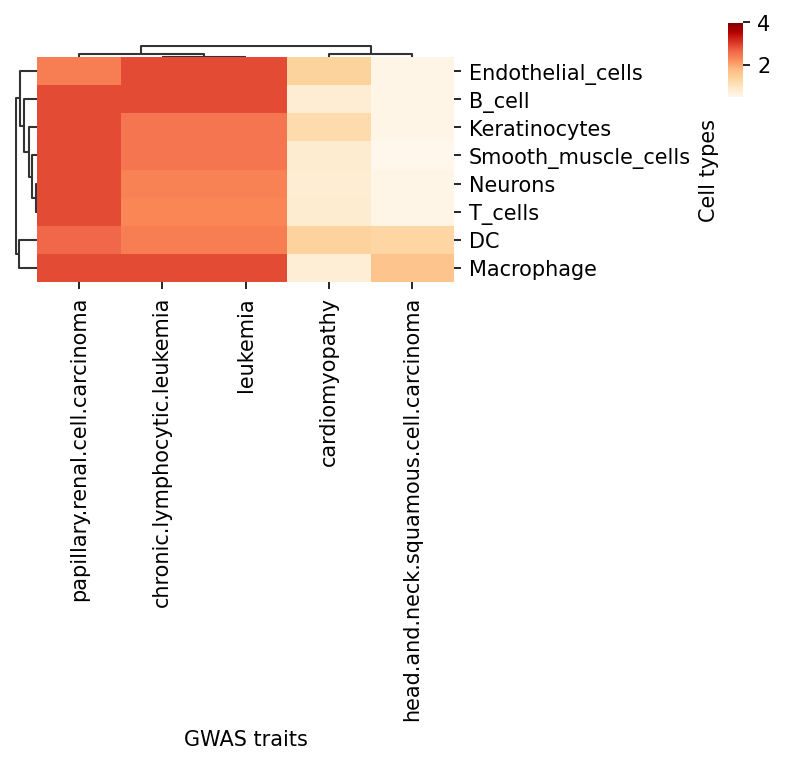
删掉在所有细胞类型中都不显著富集的 traits
df=df.loc[:, (df > neglog10_pval_sig_threshold).any(axis=0)]
df=df.loc[(df > neglog10_pval_sig_threshold).any(axis=1),:]threshold=0.05plt.rcParams['figure.dpi'] = 100
# Make annotation df
anno_df=df.where(df<1, other="*")
anno_df=anno_df.where(anno_df=='*', other=" ")
anno_df=anno_df.astype(str)
g=sns.clustermap(df,
xticklabels=True,
yticklabels=True,
cmap='OrRd',
figsize=(6,6),
annot=anno_df,
fmt = '',
dendrogram_ratio=0.05,
cbar_pos=(0.98,0.9,0.02,0.1),
vmax=2
)
g.ax_col_dendrogram.set_title(f'Enrichment of cell type-specific open chromatin for GWAS trait SNPs.\n\nScale = -log(bh-corrected p-value)\n"*" = p<{pval_sig_threshold} (-log(p)>={neglog10_pval_sig_threshold}), "open threshold" = {threshold}')
for a in g.ax_row_dendrogram.collections:
a.set_linewidth(1)
for a in g.ax_col_dendrogram.collections:
a.set_linewidth(1)
ax = g.ax_heatmap
ax.set_xlabel('GWAS traits')
ax.set_ylabel('Cell types')
plt.savefig(f'{output_path}overview_heatmap_SNP_enrichment.png')
plt.show()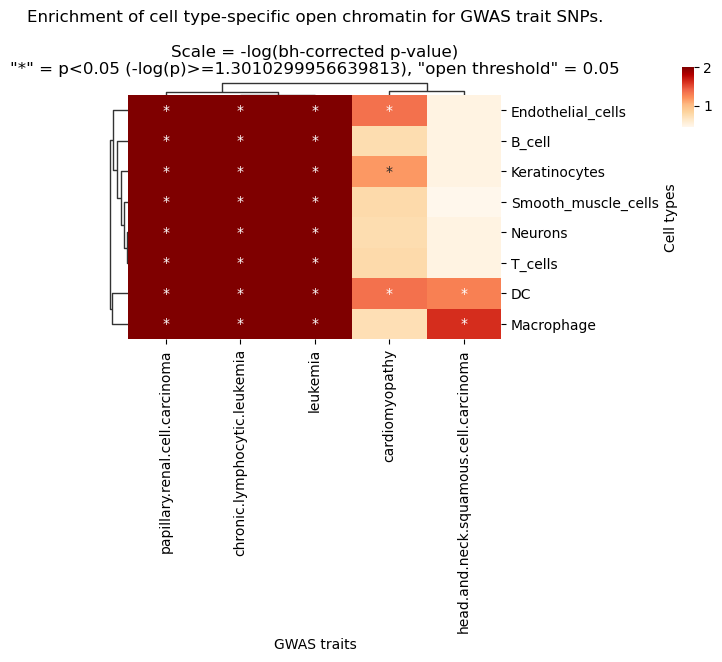
删掉不感兴趣的 traits
df.columns'head.and.neck.squamous.cell.carcinoma', 'leukemia',
'papillary.renal.cell.carcinoma'],
dtype='object', name='efo_term')
df.columns = map(str.upper, df.columns)
df = df.reindex(sorted(df.columns), axis=1)
df.columns'HEAD.AND.NECK.SQUAMOUS.CELL.CARCINOMA', 'LEUKEMIA',
'PAPILLARY.RENAL.CELL.CARCINOMA'],
dtype='object')
plt.rcParams['figure.dpi'] = 60
plt.rcParams['font.size'] = 15     # 设置全局基础字体大小
from matplotlib.colors import LinearSegmentedColormap
# Make annotation df
anno_df=df.where(df<neglog10_pval_sig_threshold, other="*")
anno_df=anno_df.where(anno_df=='*', other=" ")
anno_df=anno_df.astype(str)

#cmap_celadon = LinearSegmentedColormap.from_list('celadon_gradient',
#                colors = ["#DFEDEA","#B9EAE1", "#79D8C5", "#49C4AC","#17BCA0","#0A9E81"],
#                N=256)
#g=sns.clustermap(df,
#               xticklabels=True,
#               yticklabels=True,
               #cmap = cmap_celadon,
#               camp = "OrRd",
#               figsize=(8,12),
#               annot=anno_df,
#               fmt = '',
#               dendrogram_ratio=0.05,
#               cbar_pos=(0.98,0.9,0.02,0.1),
#                 vmax=5,
#                 row_cluster=False, col_cluster=False
#              )
g=sns.clustermap(df,
               xticklabels=True,
               yticklabels=True,
               cmap='OrRd',
               figsize=(10,10),
               annot=anno_df,
               fmt = '',
               dendrogram_ratio=0.05,
               cbar_pos=(0.98,0.9,0.02,0.1),
                 vmax=2,
                 row_cluster=False, col_cluster=False
              )

g.ax_col_dendrogram.set_title(f'Enrichment of cell-type-specific open chromatin for GWAS trait SNPs.\n\nScale = -log(BH-corrected p-value)\n\n"*" = p<{pval_sig_threshold} (-log(p)>={round(neglog10_pval_sig_threshold,2)})')

for a in g.ax_row_dendrogram.collections:
    a.set_linewidth(1)

for a in g.ax_col_dendrogram.collections:
    a.set_linewidth(1)

ax = g.ax_heatmap
ax.set_xlabel('GWAS traits')
ax.set_ylabel('Cell types')
plt.savefig(f'{output_path}overview_heatmap_SNP_enrichment_physiological.pdf',bbox_inches='tight')
plt.savefig(f'{output_path}overview_heatmap_SNP_enrichment_physiological.png')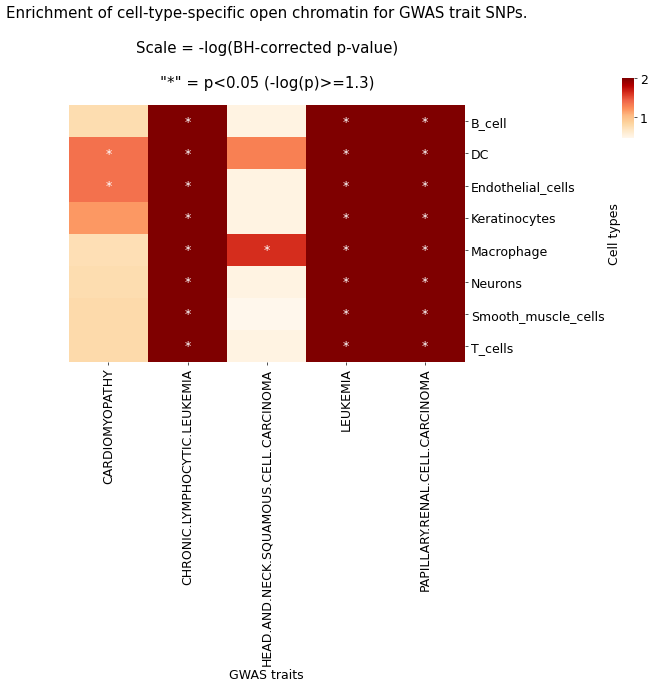
热图展示 GWAS traits 相关的 SNP 在细胞特异性开放染色质区域的富集情况,颜色表示经过 BH 方法矫正后的-log(p)值,颜色越绿,表示越显著。‘*’表示矫正后 p 值<0.05,即 GAWS traits 在对应细胞类型中具有显著富集的现象。结果文件
├── enrichment_output
│ ├── 0p05_peak_width_500_SNPs_in_LD_all_traits_summary.csv
│ └── overview_heatmap_SNP_enrichment_physiological.pdf
文献案例解析
《Spatially resolved multiomics of human cardiac niches》
在这项研究中,作者利用 scATAC-seq 数据分析与心脏生理和病理相关的 GAWS traits SNP 在各个细胞类型中的富集情况。
参考资料
[1] Kanemaru K, Cranley J, Muraro D, et al.Spatially resolved multiomics of human cardiac niches[J].Nature, 2023.DOI: 10.1038/s41586-023-06311-1.
附录
.txt :结果数据表格文件,文件以制表符(Tab)分隔。unix/Linux/Mac 用户使用 less 或 more 命令查看;windows 用户使用高级文本编辑器 Notepad++ 等查看,也可以用 Microsoft Excel 打开。
.pdf :结果图像文件,矢量图,可以放大和缩小而不失真,方便用户查看和编辑处理,可使用 Adobe Illustrator 进行图片编辑,用于文章发表等。
.rds : 包含基因活力 assay 的 Seurat 对象,需要在 R 环境中打开查看和用于进一步分析。