Single-cell Methylation Doublet Detection Tutorial (ALLCools / MethylScrublet)
Time: 4 min
Words: 634 words
Updated: 2026-02-28
Reads: 0 times
Load Python Packages
python
import os
import re
import glob
from ALLCools.mcds import MCDS
from ALLCools.clustering import tsne, significant_pc_test, log_scale, lsi, binarize_matrix, filter_regions, cluster_enriched_features, ConsensusClustering, Dendrogram, get_pc_centers
from ALLCools.clustering.doublets import MethylScrublet
from ALLCools.plot import *
import scanpy as sc
import numpy as np
import pandas as pd
import matplotlib.pyplot as plt
import matplotlib.colors as mcolors
from matplotlib.lines import Line2D
import warnings
import xarray as xr
from ALLCools.clustering import one_vs_rest_dmg
import pybedtools
from scipy import sparse
python
load = True
mc_type = 'CGN'
# Clustering resolution
n_neighbors = 10
expected_doublet_rate=0.06
plot_type = 'static'
mcds_list = []
cell_number = []
samples = ["HC10_12","HC14_21"]
Single-cell Methylation Multi-sample MCDS Integration
python
adata_met = sc.read_h5ad("adata_met.h5ad")
for i in samples:
    keep_barcodes = [ re.sub('\\-.*','',b) for b in adata_met.obs[adata_met.obs["Sample"] == i].index ]
    mcds = MCDS.open(os.path.join(f'{i}', f'{i}_methy','step3','allcools_generate_datasets', f'{i}.mcds'), obs_dim = 'cell', var_dim = 'chrom1M', use_obs = keep_barcodes)
    suffix = samples.index(i)
    if len(samples) > 1:
        mcds = mcds.assign_coords(cell=[ f'{i}-{suffix}' for i in mcds.cell.values ])
    mcds_list.append(mcds)
    cell_number += [i]*len(mcds.cell.values)
if len(samples) > 1:
    combined = xr.concat(mcds_list, dim='cell')
else:
    combined = mcds_list[0]
combined = combined.assign_coords(cell = adata_met.obs.index)

mc = combined[f'chrom1M_da'].sel({
    'count_type': 'mc'
})
cov = combined[f'chrom1M_da'].sel({
    'count_type': 'cov'
})

if load and (combined.get_index('cell').size <= 20000):
    mc.load()
    cov.load()
Doublet Detection for Single-cell Methylation Data
Doublets refer to technical artifacts where two or more cells accidentally stick together and are sequenced as a single "cell" during single-cell sequencing. Doublets introduce mixed expression/methylation signatures, seriously interfering with subsequent cell clustering and differential analysis (e.g., potentially misidentifying doublets as new intermediate cell types).
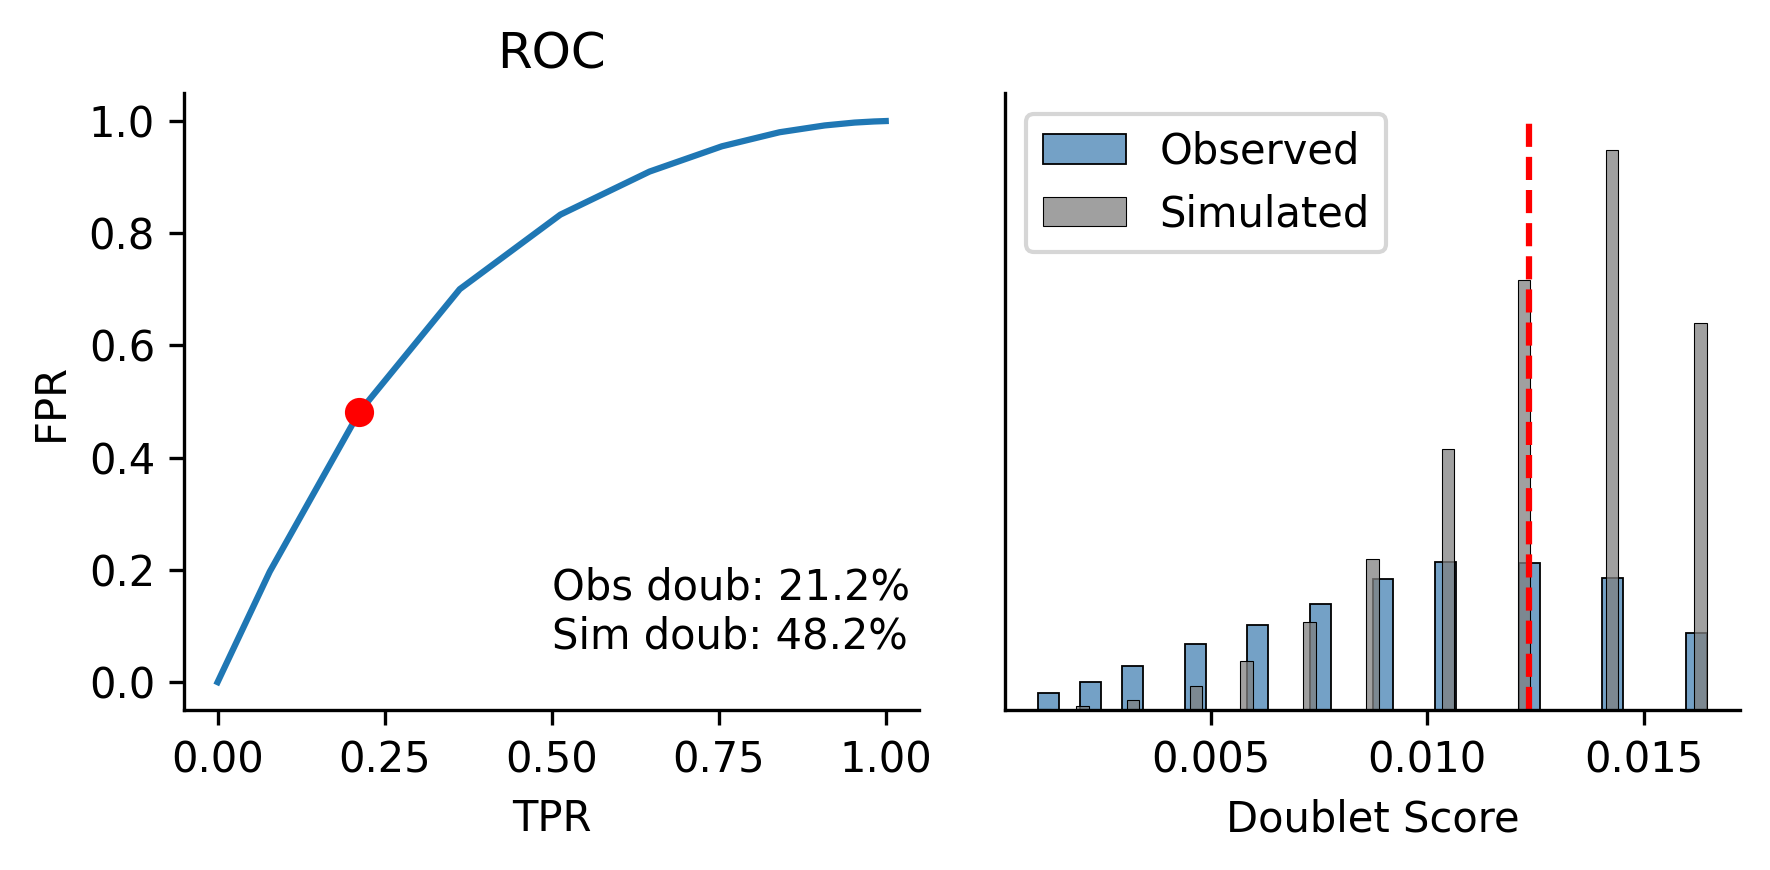
Use the MethylScrublet algorithm to identify potential doublets. This algorithm calculates a "doublet score" for each cell by simulating artificial doublets and comparing them with observed data.
python
scrublet = MethylScrublet(sim_doublet_ratio=2.0,
                          n_neighbors=n_neighbors,
                          expected_doublet_rate=expected_doublet_rate,
                          stdev_doublet_rate=0.02,
                          metric='euclidean',
                          random_state=0,
                          n_jobs=-1)
score, judge = scrublet.fit(mc, cov, clusters=adata_met.obs["celltype"])
adata_met.obs['met_doublet_score'] = score
adata_met.obs['met_is_doublet'] = judge
scrublet.plot()
adata_met.obs['met_is_doublet'] = adata_met.obs['met_is_doublet'].astype('category')
output
Calculating mC frac of observations...n Simulating doublets...n PCA...n Calculating doublet scores...n Automatically set threshold to 0.01
Detected doublet rate = 21.2%
Estimated detectable doublet fraction = 48.2%
Overall doublet rate:
Expected = 6.0%
Estimated = 44.1%
Detected doublet rate = 21.2%
Estimated detectable doublet fraction = 48.2%
Overall doublet rate:
Expected = 6.0%
Estimated = 44.1%
python
plt.rcParams['figure.dpi'] = 150
plt.rcParams['figure.figsize'] = (3,3)
sc.pl.umap(adata_met,
           color = ['met_doublet_score', 'met_is_doublet'],
           ncols = 2)
output
/PROJ2/FLOAT/jinwen/apps/miniconda3/envs/allcools/lib/python3.8/site-packages/scanpy/plotting/_tools/scatterplots.py:394: UserWarning: No data for colormapping provided via 'c'. Parameters 'cmap' will be ignored
cax = scatter(
cax = scatter(
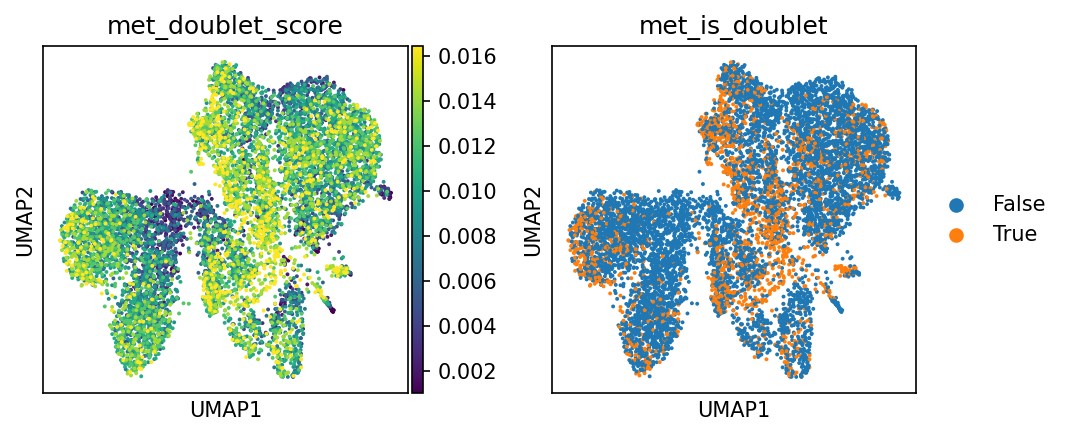
Doublet Score and Prediction Results
- Left Plot (met_doublet_score): Doublet score. Brighter colors (yellow) indicate higher similarity to simulated doublet features and a higher probability of being a doublet.
- Right Plot (met_is_doublet): Doublet determination result.
- Orange Points (True): Determined as Doublet.
- Blue Points (False): Determined as Singlet.