scRNA-seq Cell Annotation Tutorial: Type Identification Based on Marker Genes
Introduction to Cell Type Annotation
What is Cell Type Annotation?
Cell type annotation is a crucial step in single-cell RNA sequencing (scRNA-seq) analysis that involves assigning cell type identities to individual cells based on their gene expression patterns. This process transforms clusters of cells into biologically meaningful cell types, enabling researchers to:
- Compare cell type compositions across different conditions or samples.
- Identify rare or novel cell types that may be missed in bulk RNA-seq.
- Map developmental trajectories and cellular differentiation pathways.
- Understand cellular heterogeneity within tissues and organs.
- Study cell type-specific responses to treatments or disease conditions.
Introduction to SingleR
SingleR (Single-cell Recognition) is a computational method for automated cell type annotation of single-cell RNA-seq data.
Reference Datasets Available:
- Human: HumanPrimaryCellAtlas, BlueprintEncode, DatabaseImmuneCellExpression, MonacoImmune, NovershternHematopoietic.
- Mouse: MouseRNAseq, ImmGen.
Kernel Configuration
Important: This tutorial should be run using the "common_r" kernel.
Required packages:
- Seurat (>= 4.0).
- SingleR.
- dplyr.
- ggplot2, RColorBrewer, viridis, cowplot, pheatmap and patchwork.
Libraries loading and Parameter Configuration
Load Libraries
Load all required libraries.
# Load required R packages
suppressMessages({
    library(Seurat)
    library(SingleR)
    library(dplyr)
    library(ggplot2)
    library(RColorBrewer)
    library(viridis)
    library(cowplot)
    library(pheatmap)
    library(patchwork)
})
Configure Analysis Parameters
Set up the key parameters for the analysis including file paths, visualization settings, species information, and reference datasets.
# ========== File Paths Configuration ==========
# Input data path (pre-clustered Seurat object)
input_path <- "/home/demo-seekgene-com/workspace/project/demo-seekgene-com/Seurat/result/Step8_Seurat.rds"

# Output results directory
output_path <- "/home/demo-seekgene-com/workspace/project/demo-seekgene-com/CellAnnotation/result"

# ========== Color Scheme Configuration ==========
# Discrete color palette
discrete_colors_name <- "Paired"

# Continuous color palette
continuous_colors <- viridis(100)

# ========== Species Information ==========
# Species selection ("human" or "mouse")
species <- "human"

# ========== Reference datasets ==========
# For human: HumanPrimaryCellAtlas, BlueprintEncode, DatabaseImmuneCellExpression, MonacoImmune, NovershternHematopoietic
# For mouse: MouseRNAseq, ImmGen
reference_datasets <- "HumanPrimaryCellAtlas,BlueprintEncode"  # Multiple datasets separated by comma

# annotation information selection ("label.main" or "label.fine")
reference_label <- "label.main"

# Clustering resolution to use
resolution <- "RNA_snn_res.0.5"

# Create output directory if it doesn't exist
if (!dir.exists(output_path)) {
    dir.create(output_path, recursive = TRUE)
    cat("Created output directory:", output_path, "\n")
}

# Print configuration summary
cat("=== Analysis Configuration ===\n")
cat("Input path:", input_path, "\n")
cat("Output path:", output_path, "\n")
cat("Species:", species, "\n")
cat("Reference datasets:", reference_datasets, "\n")
cat("Resolution:", resolution, "\n")Input path: /home/demo-seekgene-com/workspace/project/demo-seekgene-com/Seurat/result/Step8_Seurat.rds
Output path: /home/demo-seekgene-com/workspace/project/demo-seekgene-com/CellAnnotation/result
Species: human
Reference datasets: HumanPrimaryCellAtlas,BlueprintEncode
Resolution: RNA_snn_res.0.5
Comprehensive Cell Type Annotation Tutorial
Data Setup
Load and Examine the Seurat object
Load the pre-clustered Seurat object and examine its basic properties. Update color schemes based on the actual number of clusters.
# Load the pre-clustered Seurat object
cat("Loading Seurat object from:", input_path, "\n")
seurat_obj <- readRDS(input_path)

# Display basic dataset information
cat("=== Dataset Overview ===\n")
cat("Number of cells:", ncol(seurat_obj), "\n")
cat("Number of genes:", nrow(seurat_obj), "\n")

# Check available clustering resolutions
available_resolutions <- colnames(seurat_obj@meta.data)[grepl("RNA_snn_res", colnames(seurat_obj@meta.data))]
if (length(available_resolutions) > 0) {
    cat("Available clustering resolutions:", paste(available_resolutions, collapse = ", "), "\n")

    # Set the specified resolution as active clusters
    if (resolution %in% colnames(seurat_obj@meta.data)) {
        cat("Using clustering resolution:", resolution, "\n")
        cat("Number of clusters:", length(table(seurat_obj[[resolution]])), "\n")
    } else {
        cat("Warning: Specified resolution", resolution, "not found. Using default clustering.\n")
    }
} else {
    cat("Using default clustering from Seurat object\n")
}

# Display cluster distribution
cat("\nCluster distribution:\n")
print(table(seurat_obj[[resolution]]))=== Dataset Overview ===
Number of cells: 16924
Number of genes: 24091
Available clustering resolutions: RNA_snn_res.0.5
Using clustering resolution: RNA_snn_res.0.5
Number of clusters: 18
Cluster distribution:
RNA_snn_res.0.5
0 1 2 3 4 5 6 7 8 9 10 11 12 13 14 15
4645 2406 2243 1542 1014 892 858 805 804 440 411 285 146 126 99 87
16 17
78 43
Initial Data Visualization
Create basic visualizations to understand the dataset structure before annotation.
# Adaptive discrete colors based on number of clusters
n_clusters <- length(table(seurat_obj[[resolution]]))
discrete_colors <- brewer.pal(min(n_clusters, 12), discrete_colors_name)
if (n_clusters > 12) {
discrete_colors <- colorRampPalette(discrete_colors)(n_clusters)
}
cat("\n=== Color Scheme Updated ===\n")
cat("Number of clusters detected:", n_clusters, "\n")
cat("Discrete colors generated:", length(discrete_colors), "\n")
# Set plot size for this visualization
options(repr.plot.width = 7, repr.plot.height = 7)
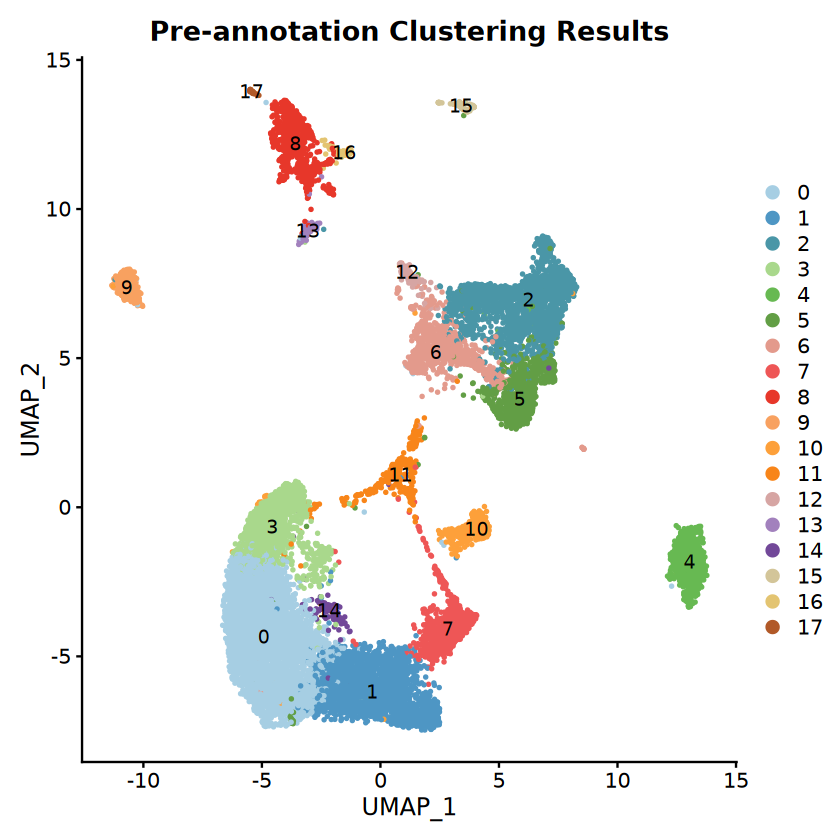
# Create UMAP plot showing clusters with adaptive colors
p_clusters <- DimPlot(seurat_obj,
reduction = "umap",
group.by = resolution,
label = TRUE,
pt.size = 0.5,
cols = discrete_colors) +
ggtitle("Pre-annotation Clustering Results")
# Display the plot
print(p_clusters)
# Save the plot
ggsave(filename = file.path(output_path, "Step1_clusters_UMAP.pdf"),
plot = p_clusters,
width = 10,
height = 8,
dpi = 300)
cat("Initial clustering plot saved to:", file.path(output_path, "Step1_clusters_UMAP.pdf"), "\n")Number of clusters detected: 18
Discrete colors generated: 18
Initial clustering plot saved to: /home/demo-seekgene-com/workspace/project/demo-seekgene-com/CellAnnotation/result/Step1_clusters_UMAP.pdf
Automated Annotation using SingleR
Load Reference Datasets
Parse and load the specified reference datasets for automated annotation.
# Reference dataset cache directory
cache_dir <- "/jp_envs/SingleR"

# Parse reference datasets from parameter (support comma-separated values)
ref_datasets <- trimws(unlist(strsplit(reference_datasets, ",")))

# Validate reference datasets based on species
if (species == "human") {
    valid_refs <- c("HumanPrimaryCellAtlas", "BlueprintEncode", "DatabaseImmuneCellExpression", "MonacoImmune", "NovershternHematopoietic")
} else if (species == "mouse") {
    valid_refs <- c("MouseRNAseq", "ImmGen")
} else {
    stop("Species must be either 'human' or 'mouse'")
}

# Check if specified datasets are valid
invalid_refs <- ref_datasets[!ref_datasets %in% valid_refs]
if (length(invalid_refs) > 0) {
    cat("Warning: Invalid reference datasets for", species, ":", paste(invalid_refs, collapse = ", "), "\n")
    cat("Valid options:", paste(valid_refs, collapse = ", "), "\n")
    ref_datasets <- ref_datasets[ref_datasets %in% valid_refs]
}

if (length(ref_datasets) == 0) {
    stop("No valid reference datasets specified")
}

cat("=== Loading Reference Datasets ===\n")
cat("Species:", species, "\n")
cat("Reference datasets:", paste(ref_datasets, collapse = ", "), "\n")

# Load reference datasets
loaded_refs <- list()

for (ref_name in ref_datasets) {
    ref_path <- file.path(cache_dir, paste0(ref_name, ".rds"))

    if (file.exists(ref_path)) {
        cat("Loading reference dataset:", ref_name, "\n")
        ref_data <- readRDS(ref_path)
        loaded_refs[[ref_name]] <- ref_data

        # Display reference dataset information
        col_data <- colData(ref_data)
        if ("label.main" %in% colnames(col_data)) {
            cat("  - Number of cell types:", length(unique(col_data$label.main)), "\n")
            cat("  - Number of samples:", ncol(ref_data), "\n")
        }
    } else {
        cat("Warning: Reference dataset file not found:", ref_path, "\n")
        # Try to download from celldx if not cached
        tryCatch({
            if (ref_name == "HumanPrimaryCellAtlas") {
                ref_data <- HumanPrimaryCellAtlasData()
            } else if (ref_name == "BlueprintEncode") {
                ref_data <- BlueprintEncodeData()
            } else if (ref_name == "DatabaseImmuneCellExpression") {
                ref_data <- DatabaseImmuneCellExpressionData()
            } else if (ref_name == "MonacoImmuneData") {
                ref_data <- MonacoImmuneData()
            } else if (ref_name == "MouseRNAseq") {
                ref_data <- MouseRNAseqData()
            } else if (ref_name == "ImmGen") {
                ref_data <- ImmGenData()
            }
            loaded_refs[[ref_name]] <- ref_data
            cat("Downloaded reference dataset:", ref_name, "\n")
        }, error = function(e) {
            cat("Error loading", ref_name, ":", e$message, "\n")
        })
    }
}

cat("Successfully loaded", length(loaded_refs), "reference dataset(s)\n")Species: human
Reference datasets: HumanPrimaryCellAtlas, BlueprintEncode
Loading reference dataset: HumanPrimaryCellAtlas
- Number of cell types: 36
- Number of samples: 713
Loading reference dataset: BlueprintEncode
- Number of cell types: 25
- Number of samples: 259
Successfully loaded 2 reference dataset(s)
Run SingleR Annotation
Perform automated cell type annotation using SingleR with the loaded reference datasets.
if (length(loaded_refs) > 0) {
    cat("=== Running SingleR Annotation ===\n")

    # Extract expression matrix
    expression_matrix <- GetAssayData(seurat_obj, assay = "RNA", slot = "data")

    # Store SingleR results
    singler_results <- list()

    # Run SingleR for each reference dataset
    for (ref_name in names(loaded_refs)) {
        cat("Running SingleR with reference:", ref_name, "\n")

        ref_data <- loaded_refs[[ref_name]]

        cluster_vector <- seurat_obj[[resolution]][, 1]
        names(cluster_vector) <- rownames(seurat_obj[[resolution]])

        # Run SingleR annotation
        result <- SingleR(
            test = expression_matrix,
            ref = ref_data,
            labels = ref_data[[reference_label]],
            clusters = cluster_vector
        )

        singler_results[[ref_name]] <- result

        # Add cluster-level annotations to Seurat object
        cluster_vector <- seurat_obj[[resolution]][, 1]
        names(cluster_vector) <- rownames(seurat_obj[[resolution]])
        cluster_annotations <- result$labels[match(cluster_vector, rownames(result))]
        seurat_obj@meta.data[[paste0("SingleR_", ref_name)]] <- cluster_annotations

        # Add annotation scores
        cluster_scores <- result$scores[match(cluster_vector, rownames(result)), ]
        max_scores <- apply(cluster_scores, 1, max, na.rm = TRUE)
        seurat_obj@meta.data[[paste0("SingleR_score_", ref_name)]] <- max_scores[match(cluster_vector, rownames(result))]

        cat("Completed annotation with", ref_name, "\n")
        cat("Identified cell types:", paste(unique(result$labels), collapse = ", "), "\n\n")
    }

    cat("=== SingleR Annotation Complete ===\n")
} else {
    cat("Error: No reference datasets loaded. Cannot proceed with SingleR annotation.\n")
}Running SingleR with reference: HumanPrimaryCellAtlas
Completed annotation with HumanPrimaryCellAtlas
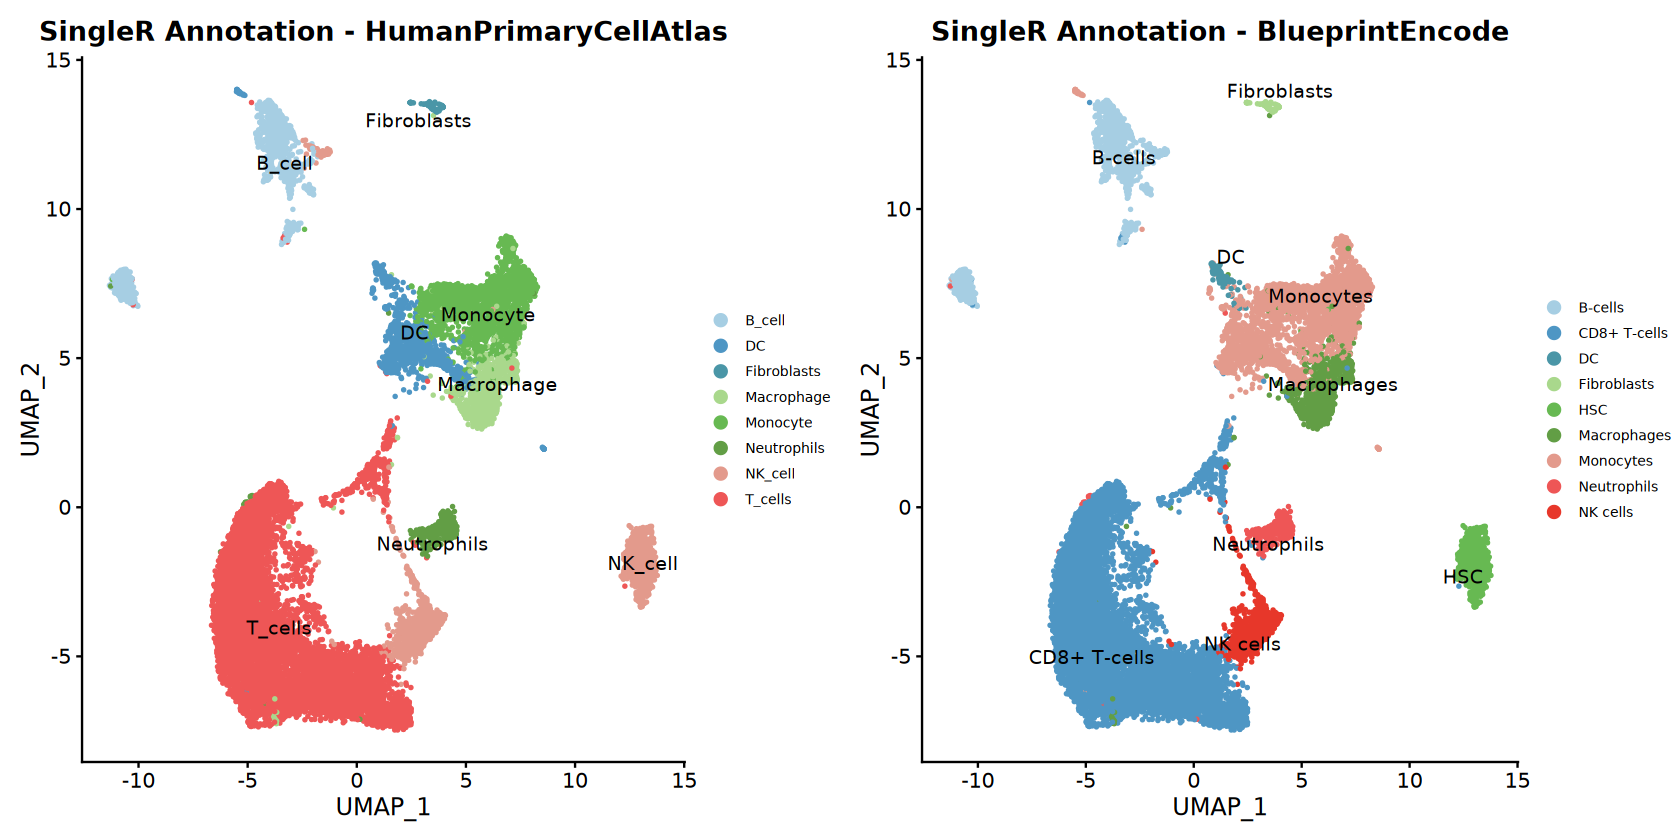
Identified cell types: T_cells, Monocyte, NK_cell, Macrophage, DC, B_cell, Neutrophils, Fibroblasts
Running SingleR with reference: BlueprintEncode
Completed annotation with BlueprintEncode
Identified cell types: CD8+ T-cells, Monocytes, HSC, Macrophages, NK cells, B-cells, Neutrophils, DC, Fibroblasts
=== SingleR Annotation Complete ===
Visualize SingleR Results
Create comprehensive visualizations of the SingleR annotation results and display them.
if (exists("singler_results") && length(singler_results) > 0) {
    cat("=== Creating SingleR Annotation Visualizations ===\n")

    # Create plots for each reference dataset
    singler_plots <- list()

    for (ref_name in names(singler_results)) {
        # UMAP plot colored by SingleR annotations
        p_singler <- DimPlot(seurat_obj,
                            reduction = "umap",
                            group.by = paste0("SingleR_", ref_name),
                            label = TRUE,
                            pt.size = 0.5,
                            cols = discrete_colors,
                            repel = TRUE) +
            ggtitle(paste("SingleR Annotation -", ref_name)) +
            theme(legend.text = element_text(size = 8),
                  plot.title = element_text(hjust = 0.5))

        singler_plots[[ref_name]] <- p_singler

        # Display annotation statistics
        cat("\nAnnotation results for", ref_name, ":\n")
        annotation_table <- table(seurat_obj@meta.data[[paste0("SingleR_", ref_name)]])
        print(annotation_table)
        cat("\n")
    }

    # Create combined plot if multiple references
    if (length(singler_plots) > 0) {
        # Set larger plot size for combined plot
        options(repr.plot.width = 14, repr.plot.height = 7)

        combined_singler <- plot_grid(plotlist = singler_plots, ncol = 2)

        # Display combined plot
        print(combined_singler)

        ggsave(filename = file.path(output_path, "Step2_SingleR_UMAP.pdf"),
               plot = combined_singler,
               width = 16,
               height = 12,
               dpi = 300)

        cat("Saved combined SingleR plot\n")
    }

} else {
    cat("No SingleR results available for visualization\n")
}Annotation results for HumanPrimaryCellAtlas :
B_cell DC Fibroblasts Macrophage Monocyte Neutrophils
1370 1047 87 892 2243 411
NK_cell T_cells
1897 8977
Annotation results for BlueprintEncode :
B-cells CD8+ T-cells DC Fibroblasts HSC Macrophages
1448 8977 146 87 1014 892
Monocytes Neutrophils NK cells
3144 411 805
Saved combined SingleR plot
Manual Cell Type Annotation
Define Marker Genes
Perform manual cell type annotation using marker genes.
cat("=== Defining Marker Gene Systems ===\n")

# Define species-specific marker genes
if (species == "human") {
    cell_systems <- list(
        # Lymphoid system markers
        Lymphoid = list(
            B_cells = c("CD79A", "CD79B", "MS4A1"),
            Plasma_cells = c("JCHAIN", "MZB1", "IGHG1"),
            T_cells = c("CD3D", "CD3E", "CD3G", "CD2"),
            NK_cells = c("NKG7", "GNLY", "KLRF1", "KLRD1")
        ),

        # Myeloid system markers
        Myeloid = list(
            Monocytes = c("LYZ", "CTSS", "CD14", "FCGR3A"),
            Macrophages = c("CD68", "C1QA", "CD163", "CCL3", "VCAN"),
            DCs = c("CD74", "HLA-DPB1", "HLA-DPA1", "CD1C", "FCER1A", "CST3"),
            pDCs = c("LILRA4", "CLEC4C", "PLXNA4"),
            Granulocytes = c("ELANE", "MPO"),
            Neutrophils = c("S100A9", "S100A8", "FCGR3B", "CXCL8", "CSF3R"),
            Mast_cells = c("CPA3", "ENPP3", "HDC", "GATA2"),
            Megakaryocytes = c("PPBP", "PF4"),
            Erythrocytes = c("HBG1", "HBA1", "HBB")
        ),

        # Stromal system markers
        Stroma = list(
            Epithelial_cells = c("EPCAM", "KRT5", "KRT18"),
            Endothelial_cells = c("PECAM1", "ICAM2", "CLDN5", "CDH5", "PCDH17"),
            Fibroblasts = c("DCN", "COL1A2", "COL1A1"),
            Proliferating_cells = c("TOP2A", "MKI67")
        )
    )

} else if (species == "mouse") {
    # Mouse-specific markers
    cell_systems <- list(
        Lymphoid = list(
            B_cells = c("Cd79a", "Cd79b", "Ms4a1", "Cd19"),
            Plasma_cells = c("Igha", "Jchain", "Iglv1"),
            T_cells = c("Cd3d", "Cd3e", "Cd3g"),
            NK_cells = c("Nkg7", "Icos", "Gzmb", "Prf1", "Klre1", "Gzma")
        ),

        Myeloid = list(
            Monocytes = c("Lyz2", "Cd14", "Csf1r", "Ctss"),
            Macrophages = c("Mrc1", "Arg1", "Cd163", "Cd68", "Adgre1"),
            DCs = c("Cd74", "H2-Aa", "H2-Ab1", "H2-Eb1", "Cd209a"),
            pDCs = c("Bst2", "Tcf4", "Irf8", "Siglech"),
            Granulocytes = c("Ngp", "Camp"),
            Neutrophils = c("S100a8", "S100a9", "Retnlg", "Csf3r"),
            Mast_cells = c("Cpa3"),
            Megakaryocytes = c("Pf4", "Ppbp"),
            Erythrocytes = c("Hba-a2", "Hbb-bs", "Hba-a1")
        ),

        Stroma = list(
            Epithelial_cells = c("Epcam", "Clcn3", "Cldn10", "Cldn3", "Krt7", "Krt8"),
            Endothelial_cells = c("Pecam1", "Cdh5", "Cldn5"),
            Fibroblasts = c("Col1a1", "Col1a2", "Dcn"),
            Proliferating_cells = c("Top2a", "Mki67")
        )
    )

} else {
    stop("Only mouse and human can do this analysis.")
}

# Output system information
for (system_name in names(cell_systems)) {
    cat(sprintf("%s system: %d cell types\n",
                system_name,
                length(cell_systems[[system_name]])))
}

cat("\nMarker gene systems defined successfully\n")Lymphoid system: 4 cell types
Myeloid system: 9 cell types
Stroma system: 4 cell types
Marker gene systems defined successfully
Create Drawing and Scoring Function
Function for drawing markers and scoring dotplot, heatmap, vlnplot, and featurereplot.
# Define comprehensive analysis function for cell systems
analyze_cell_system <- function(seurat_obj, groups, markers, system_name, create_heatmap = TRUE, create_violin = TRUE, create_feature = TRUE, create_scoring = TRUE, print_plot = TRUE, step = "Step3") {
    cat(sprintf("\n=== %s System Analysis ===\n", system_name))

    # Get available genes
    all_genes <- unlist(markers)
    available_genes <- all_genes[all_genes %in% rownames(seurat_obj)]

    if (length(available_genes) == 0) {
        cat(sprintf("Warning: No marker genes found for %s system\n", system_name))
        return(seurat_obj)
    }

    cat(sprintf("Found %d/%d marker genes\n", length(available_genes), length(all_genes)))

    # 1. Create dotplot with marker and gene set names
    cat("Creating dotplot with marker and gene set names...\n")
    dotplot_width <- if(tolower(system_name) %in% c("all")) 20 else 20
    dotplot_height <- if(tolower(system_name) %in% c("all")) 10 else 8
    options(repr.plot.width = dotplot_width, repr.plot.height = dotplot_height)

    # Create gene set labels that match exactly with available genes
    gene_labels <- c()
    ordered_genes <- c()

    for (cell_type in names(markers)) {
        genes_in_data <- markers[[cell_type]][markers[[cell_type]] %in% rownames(seurat_obj)]
        if (length(genes_in_data) > 0) {
            ordered_genes <- c(ordered_genes, genes_in_data)
            gene_labels <- c(gene_labels, rep(cell_type, length(genes_in_data)))
        }
    }

    # Use ordered genes to ensure consistency
    if (length(ordered_genes) > 0) {
        dotplot <- DotPlot(seurat_obj,
                          features = markers,
                          group.by = groups) +
            scale_color_gradientn(colors = continuous_colors) +
            theme(axis.text.x = element_text(angle = 45, hjust = 1, size = 9),
                  axis.text.y = element_text(size = 10),
                  plot.title = element_text(hjust = 0.5),
                  plot.margin = margin(t = 20, r = 10, b = 50, l = 10)) +
            ggtitle(sprintf("%s System Markers - DotPlot", system_name))

        if (print_plot) {
            print(dotplot)
        }

        # Save dotplot
        filename <- sprintf("%s_%s_dotplot.pdf", step, tolower(gsub("[^A-Za-z0-9]", "_", system_name)))
        ggsave(filename = file.path(output_path, filename),
               plot = dotplot, width = dotplot_width, height = dotplot_height, dpi = 300)

        cat(sprintf("Dotplot saved: %s\n", filename))
    } else {
        cat("No genes available for dotplot\n")
    }

    # 2. Create heatmap
    if (create_heatmap && length(available_genes) > 0) {
        cat("Creating heatmap...\\n")

        # Set up heatmap dimensions
        heatmap_width <- if(tolower(system_name) %in% c("all")) 20 else 20
        heatmap_height <- if(tolower(system_name) %in% c("all")) 10 else 8
        options(repr.plot.width = heatmap_width, repr.plot.height = heatmap_height)

        # Create heatmap with DoHeatmap
        tryCatch({
            # Downsample cells if too many for heatmap performance
            max_cells_for_heatmap <- 1000
            if (ncol(seurat_obj) > max_cells_for_heatmap) {
                sample_cells <- sample(colnames(seurat_obj), max_cells_for_heatmap)
                heatmap_object <- subset(seurat_obj, cells = sample_cells)
            } else {
                heatmap_object <- seurat_obj
            }

            heatmap_plot <- DoHeatmap(heatmap_object,
                                    features = available_genes,
                                    group.by = groups,
                                    size = 4,
                                    angle = 45,
                                    draw.lines = TRUE) +
                scale_fill_gradientn(colors = continuous_colors) +
                theme(axis.text.y = element_text(size = 8),
                      plot.title = element_text(hjust = 0.5)) +
                ggtitle(sprintf("%s System Markers - Heatmap", system_name))

            if (print_plot) {
                print(heatmap_plot)
            }

            # Save heatmap
            filename <- sprintf("%s_%s_heatmap.pdf", step, tolower(gsub("[^A-Za-z0-9]", "_", system_name)))
            ggsave(filename = file.path(output_path, filename),
                   plot = heatmap_plot, width = heatmap_width, height = heatmap_height, dpi = 300)

            cat(sprintf("Heatmap saved: %s\\n", filename))
        }, error = function(e) {
            cat(sprintf("Could not create heatmap for %s: %s\\n", system_name, e$message))
        })
    } else {
        cat("No genes available for heatmap\\n")
    }

    # 3. Create stacked violin plot
    if (create_violin && length(available_genes) > 0) {
        cat("Creating stacked violin plot...\n")
        violin_width <- if(tolower(system_name) %in% c("all")) 20 else 20
        violin_height <- if(tolower(system_name) %in% c("all")) 8 else 6
        options(repr.plot.width = violin_width, repr.plot.height = violin_height)

        # Adaptive discrete colors based on number of genes
        n_genes <- length(available_genes)
        genes_discrete_colors <- brewer.pal(min(n_genes, 12), discrete_colors_name)
        if (n_genes > 12) {
            genes_discrete_colors <- colorRampPalette(genes_discrete_colors)(n_genes)
        }

        violin_plot <- VlnPlot(seurat_obj,
                              features = available_genes,
                              group.by = groups,
                              stack = TRUE,
                              flip = TRUE,
                              cols = genes_discrete_colors) +
            NoLegend() +
            ggtitle(sprintf("%s System Markers - Stacked Violin Plot", system_name)) +
            theme(plot.title = element_text(hjust = 0.5)) +
            theme(axis.text.x = element_text(angle = 0, hjust = 1))

        if (print_plot) {
        print(violin_plot)
        }

        filename <- sprintf("%s_%s_violin.pdf", step, tolower(gsub("[^A-Za-z0-9]", "_", system_name)))
        ggsave(filename = file.path(output_path, filename),
               plot = violin_plot, width = violin_width, height = violin_height, dpi = 300)

        cat(sprintf("Violin plot saved: %s\n", filename))
    }

    # 4. Create top 6 genes featureplot
    if (create_feature && length(available_genes) > 0) {
        cat("Creating top 6 genes featureplot...\n")
        top6_genes <- available_genes[1:min(6, length(available_genes))]

        featureplot_width <- if(tolower(system_name) %in% c("all")) 20 else 20
        featureplot_height <- if(tolower(system_name) %in% c("all")) 20 else 20
        options(repr.plot.width = featureplot_width, repr.plot.height = featureplot_height)

        feature_plot <- FeaturePlot(seurat_obj,
                                   features = top6_genes,
                                   ncol = 3,
                                   reduction = "umap",
                                   col = continuous_colors) +
            theme(plot.title = element_text(hjust = 0.5, size = 12))

        feature_plot <- feature_plot + plot_annotation(
            title = sprintf("%s System Markers - Feature Plot", system_name),
            theme = theme(plot.title = element_text(hjust = 0.5, size = 16, face = "bold"))
            )

        if (print_plot) {
            print(feature_plot)
        }

        filename <- sprintf("%s_%s_top6_featureplot.pdf", step, tolower(gsub("[^A-Za-z0-9]", "_", system_name)))
        ggsave(filename = file.path(output_path, filename),
               plot = feature_plot, width = featureplot_width, height = featureplot_height, dpi = 300)

        cat(sprintf("Feature plot saved: %s\n", filename))
    }

    # 5. Gene set scoring and visualization
    if (create_scoring) {
        cat("Calculating gene set scores...\n")

        for (cell_type in names(markers)) {
            genes <- markers[[cell_type]]
            genes <- genes[genes %in% rownames(seurat_obj)]

            if (length(genes) > 0) {
                score_name <- sprintf("%s_%s_Score", system_name, cell_type)
                seurat_obj <- AddModuleScore(seurat_obj,
                                            features = list(genes),
                                            name = score_name,
                                            seed = 42)
                colnames(seurat_obj@meta.data)[ncol(seurat_obj@meta.data)] <- score_name
                cat(sprintf("Added %s score\n", cell_type))
            }
        }

        # Get score columns
        score_pattern <- sprintf("%s_.*_Score", system_name)
        score_columns <- grep(score_pattern, colnames(seurat_obj@meta.data), value = TRUE)

        if (length(score_columns) > 0) {
            # Gene set scoring dotplot
            cat("Creating gene set scoring dotplot...\n")
            score_dotplot_width <- if(tolower(system_name) %in% c("all")) 20 else 20
            score_dotplot_height <- if(tolower(system_name) %in% c("all")) 10 else 8
            options(repr.plot.width = score_dotplot_width, repr.plot.height = score_dotplot_height)
            score_dotplot <- DotPlot(seurat_obj,
                              features = score_columns,
                              group.by = groups) +
                scale_color_gradientn(colors = continuous_colors) +
                theme(plot.title = element_text(hjust = 0.5, size = 10),
                    axis.text.x = element_text(angle = 45, hjust = 1, size = 9)) +
                ggtitle(sprintf("%s System Module Score - DotPlot", system_name))

            if (print_plot) {
                print(score_dotplot)
            }

            filename <- sprintf("%s_%s_score_dotplot.pdf", step, tolower(gsub("[^A-Za-z0-9]", "_", system_name)))
            ggsave(filename = file.path(output_path, filename),
                   plot = score_dotplot, width = score_dotplot_width, height = score_dotplot_height, dpi = 300)

            cat(sprintf("Score dotplot saved: %s\n", filename))

            # Gene set scoring heatmap
            cat("Creating gene set scoring heatmap...\n")
            score_heatmap_width <- if(tolower(system_name) %in% c("all")) 10 else 20
            score_heatmap_height <- if(tolower(system_name) %in% c("all")) 8 else 6
            avg_score <- sapply(score_columns, function(sc) tapply(seurat_obj@meta.data[[sc]], seurat_obj@meta.data[[groups]], mean, na.rm = TRUE))
            avg_score <- t(avg_score)

            score_heatmap <- pheatmap(
                avg_score,
                cluster_rows = FALSE,
                cluster_cols = FALSE,
                show_colnames = TRUE,
                show_rownames = TRUE,
                angle_col = 0,
                color = continuous_colors,
                cellwidth = 80,
                cellheight = 60,
                main = paste0(system_name, " System Module Score - Heatmap")
            )

            filename <- sprintf("%s_%s_score_heatmap.pdf", step, tolower(gsub("[^A-Za-z0-9]", "_", system_name)))
            ggsave(filename = file.path(output_path, filename),
                   plot = score_heatmap, width = score_heatmap_width, height = score_heatmap_height, dpi = 300)

            cat(sprintf("Score heatmap saved: %s\n", filename))

            # Gene set scoring violin plot
            cat("Creating gene set scoring violin plot...\n")
            score_violin_width <- if(tolower(system_name) %in% c("all")) 20 else 20
            score_violin_height <- if(tolower(system_name) %in% c("all")) 24 else 14
            ncol_val <- if(tolower(system_name) %in% c("all")) 3 else 2
            options(repr.plot.width = score_violin_width, repr.plot.height = score_violin_height)

            score_violin <- VlnPlot(seurat_obj,
                                   features = score_columns,
                                   group.by = groups,
                                   ncol = ncol_val,
                                   pt.size = 0,
                                   cols = discrete_colors) &
                theme(plot.title = element_text(hjust = 0.5, size = 10))

            score_violin <- score_violin + plot_annotation(
                title = sprintf("%s System Module Score - Violin Plot", system_name),
                theme = theme(plot.title = element_text(hjust = 0.5, size = 16, face = "bold"))
                )

            if (print_plot) {
                print(score_violin)
            }

            filename <- sprintf("%s_%s_score_violin.pdf", step, tolower(gsub("[^A-Za-z0-9]", "_", system_name)))
            ggsave(filename = file.path(output_path, filename),
                   plot = score_violin, width = score_violin_width, height = score_violin_height, dpi = 300)

            cat(sprintf("Score violin plot saved: %s\n", filename))

            # Gene set scoring featureplot
            cat("Creating gene set scoring featureplot...\n")
            score_featureplot_width <- if(tolower(system_name) %in% c("all")) 20 else 20
            score_featureplot_height <- if(tolower(system_name) %in% c("all")) 24 else 14
            options(repr.plot.width = score_featureplot_width, repr.plot.height = score_featureplot_height)

            score_feature <- FeaturePlot(seurat_obj,
                                        features = score_columns,
                                        ncol = ncol_val,
                                        reduction = "umap",
                                        cols = continuous_colors) &
                theme(plot.title = element_text(hjust = 0.5, size = 10))

            score_feature <- score_feature + plot_annotation(
                title = sprintf("%s System Module Score - Feature Plot", system_name),
                theme = theme(plot.title = element_text(hjust = 0.5, size = 16, face = "bold"))
                )

            if (print_plot) {
                print(score_feature)
            }

            filename <- sprintf("%s_%s_score_featureplot.pdf", step, tolower(gsub("[^A-Za-z0-9]", "_", system_name)))
            ggsave(filename = file.path(output_path, filename),
                   plot = score_feature, width = score_featureplot_width, height = score_featureplot_height, dpi = 300)

            cat(sprintf("Score feature plot saved: %s\n", filename))
        }
    }

    cat(sprintf("%s system analysis completed\n", system_name))
    return(seurat_obj)
}

cat("Analysis function defined successfully\n")Lymphoid System Analysis
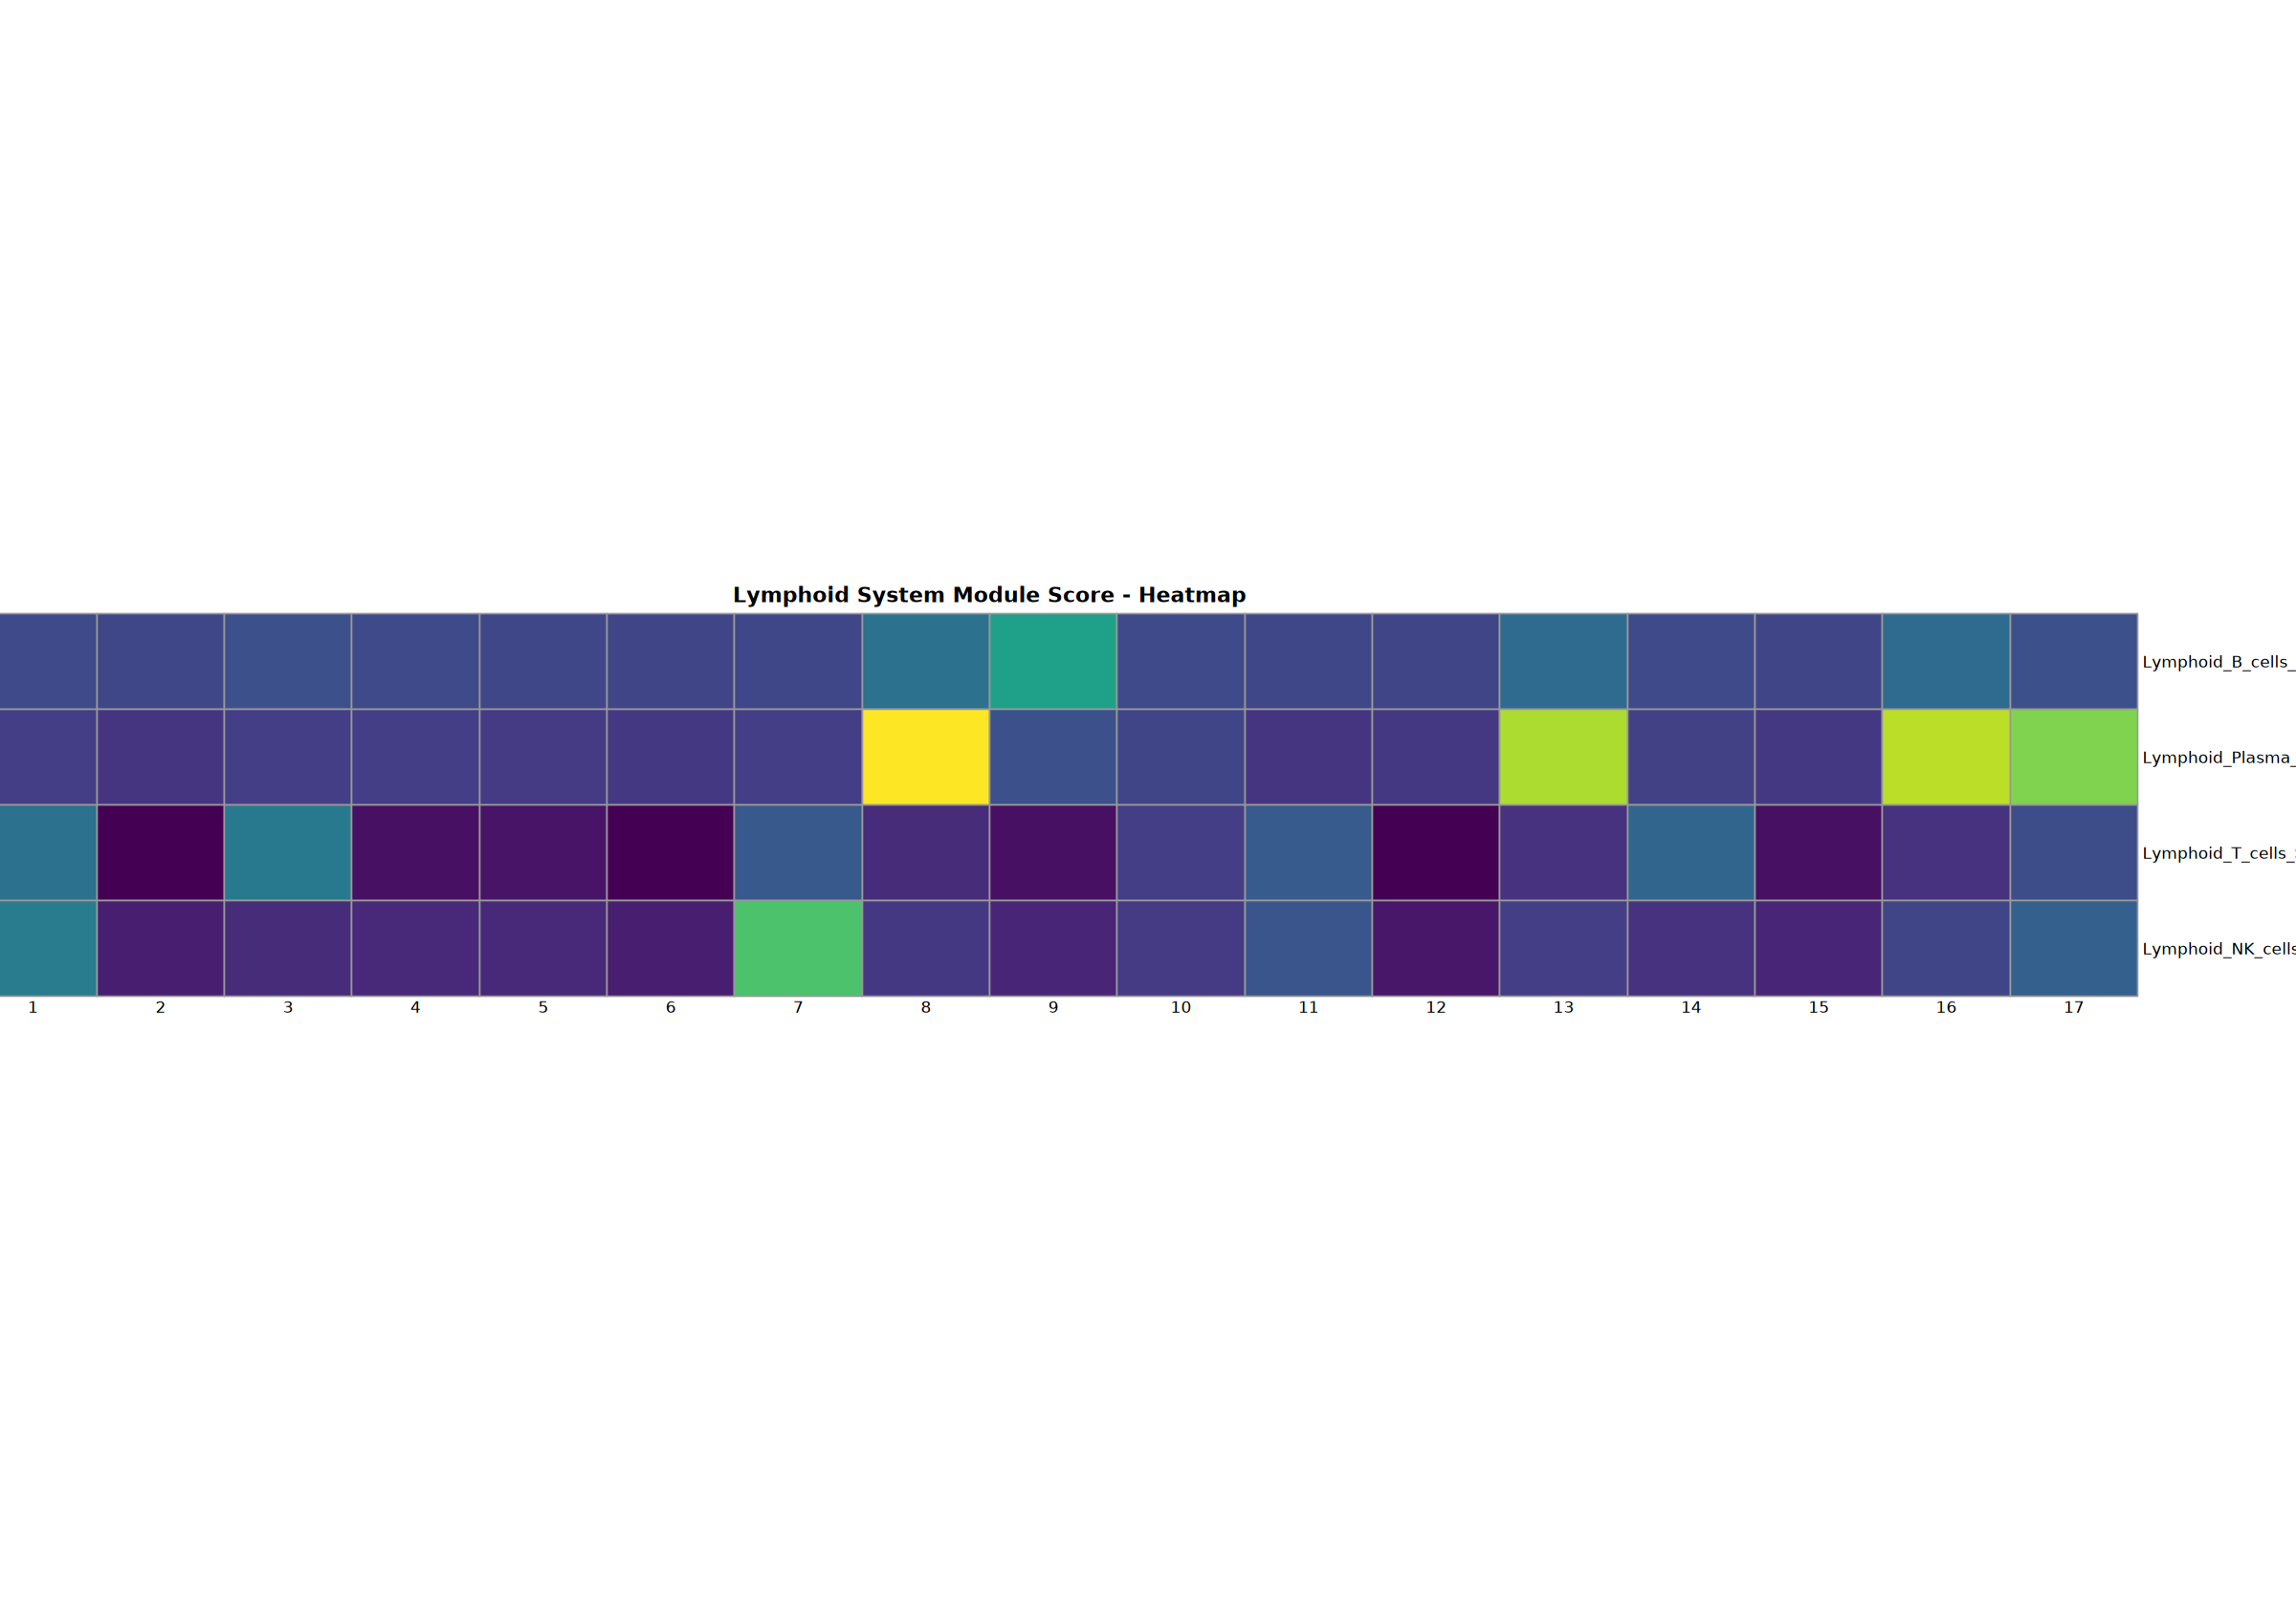
Comprehensive analysis of B, Plasma, T, and NK cells including dotplot, stacked violin plot, heatmap, top6 genes featureplot, and gene set scoring.
# Lymphoid system analysis
cat("=== Starting Lymphoid System Analysis ===\n")

seurat_obj <- analyze_cell_system(
    seurat_obj = seurat_obj,
    groups = resolution,
    markers = cell_systems$Lymphoid,
    system_name = "Lymphoid",
    create_heatmap = TRUE,
    create_violin = TRUE,
    create_feature = TRUE,
    create_scoring = TRUE,
    print_plot = FALSE,
    step = "Step3"
)

cat("Lymphoid system analysis completed\n")=== Lymphoid System Analysis ===
Found 14/14 marker genes
Creating dotplot with marker and gene set names...n
Warning message:
“The \`facets\` argument of \`facet_grid()\` is deprecated as of ggplot2 2.2.0.
ℹ Please use the \`rows\` argument instead.
ℹ The deprecated feature was likely used in the Seurat package.
Please report the issue at
Scale for colour is already present.
Adding another scale for colour, which will replace the existing scale.
Dotplot saved: Step3_lymphoid_dotplot.pdf
Creating heatmap...
Warning message in DoHeatmap(heatmap_object, features = available_genes, group.by = groups, :
“The following features were omitted as they were not found in the scale.data slot for the RNA assay: KLRF1, CD2, CD3G, CD3E, CD3D, CD79B”
Scale for fill is already present.
Adding another scale for fill, which will replace the existing scale.
Heatmap saved: Step3_lymphoid_heatmap.pdf\
Creating stacked violin plot...n Violin plot saved: Step3_lymphoid_violin.pdf
Creating top 6 genes featureplot...n Feature plot saved: Step3_lymphoid_top6_featureplot.pdf
Calculating gene set scores...n Added B_cells score
Added Plasma_cells score
Added T_cells score
Added NK_cells score
Creating gene set scoring dotplot...n
Scale for colour is already present.
Adding another scale for colour, which will replace the existing scale.
Score dotplot saved: Step3_lymphoid_score_dotplot.pdf
Creating gene set scoring heatmap...n Score heatmap saved: Step3_lymphoid_score_heatmap.pdf
Creating gene set scoring violin plot...n Score violin plot saved: Step3_lymphoid_score_violin.pdf
Creating gene set scoring featureplot...n Score feature plot saved: Step3_lymphoid_score_featureplot.pdf
Lymphoid system analysis completed
Lymphoid system analysis completed
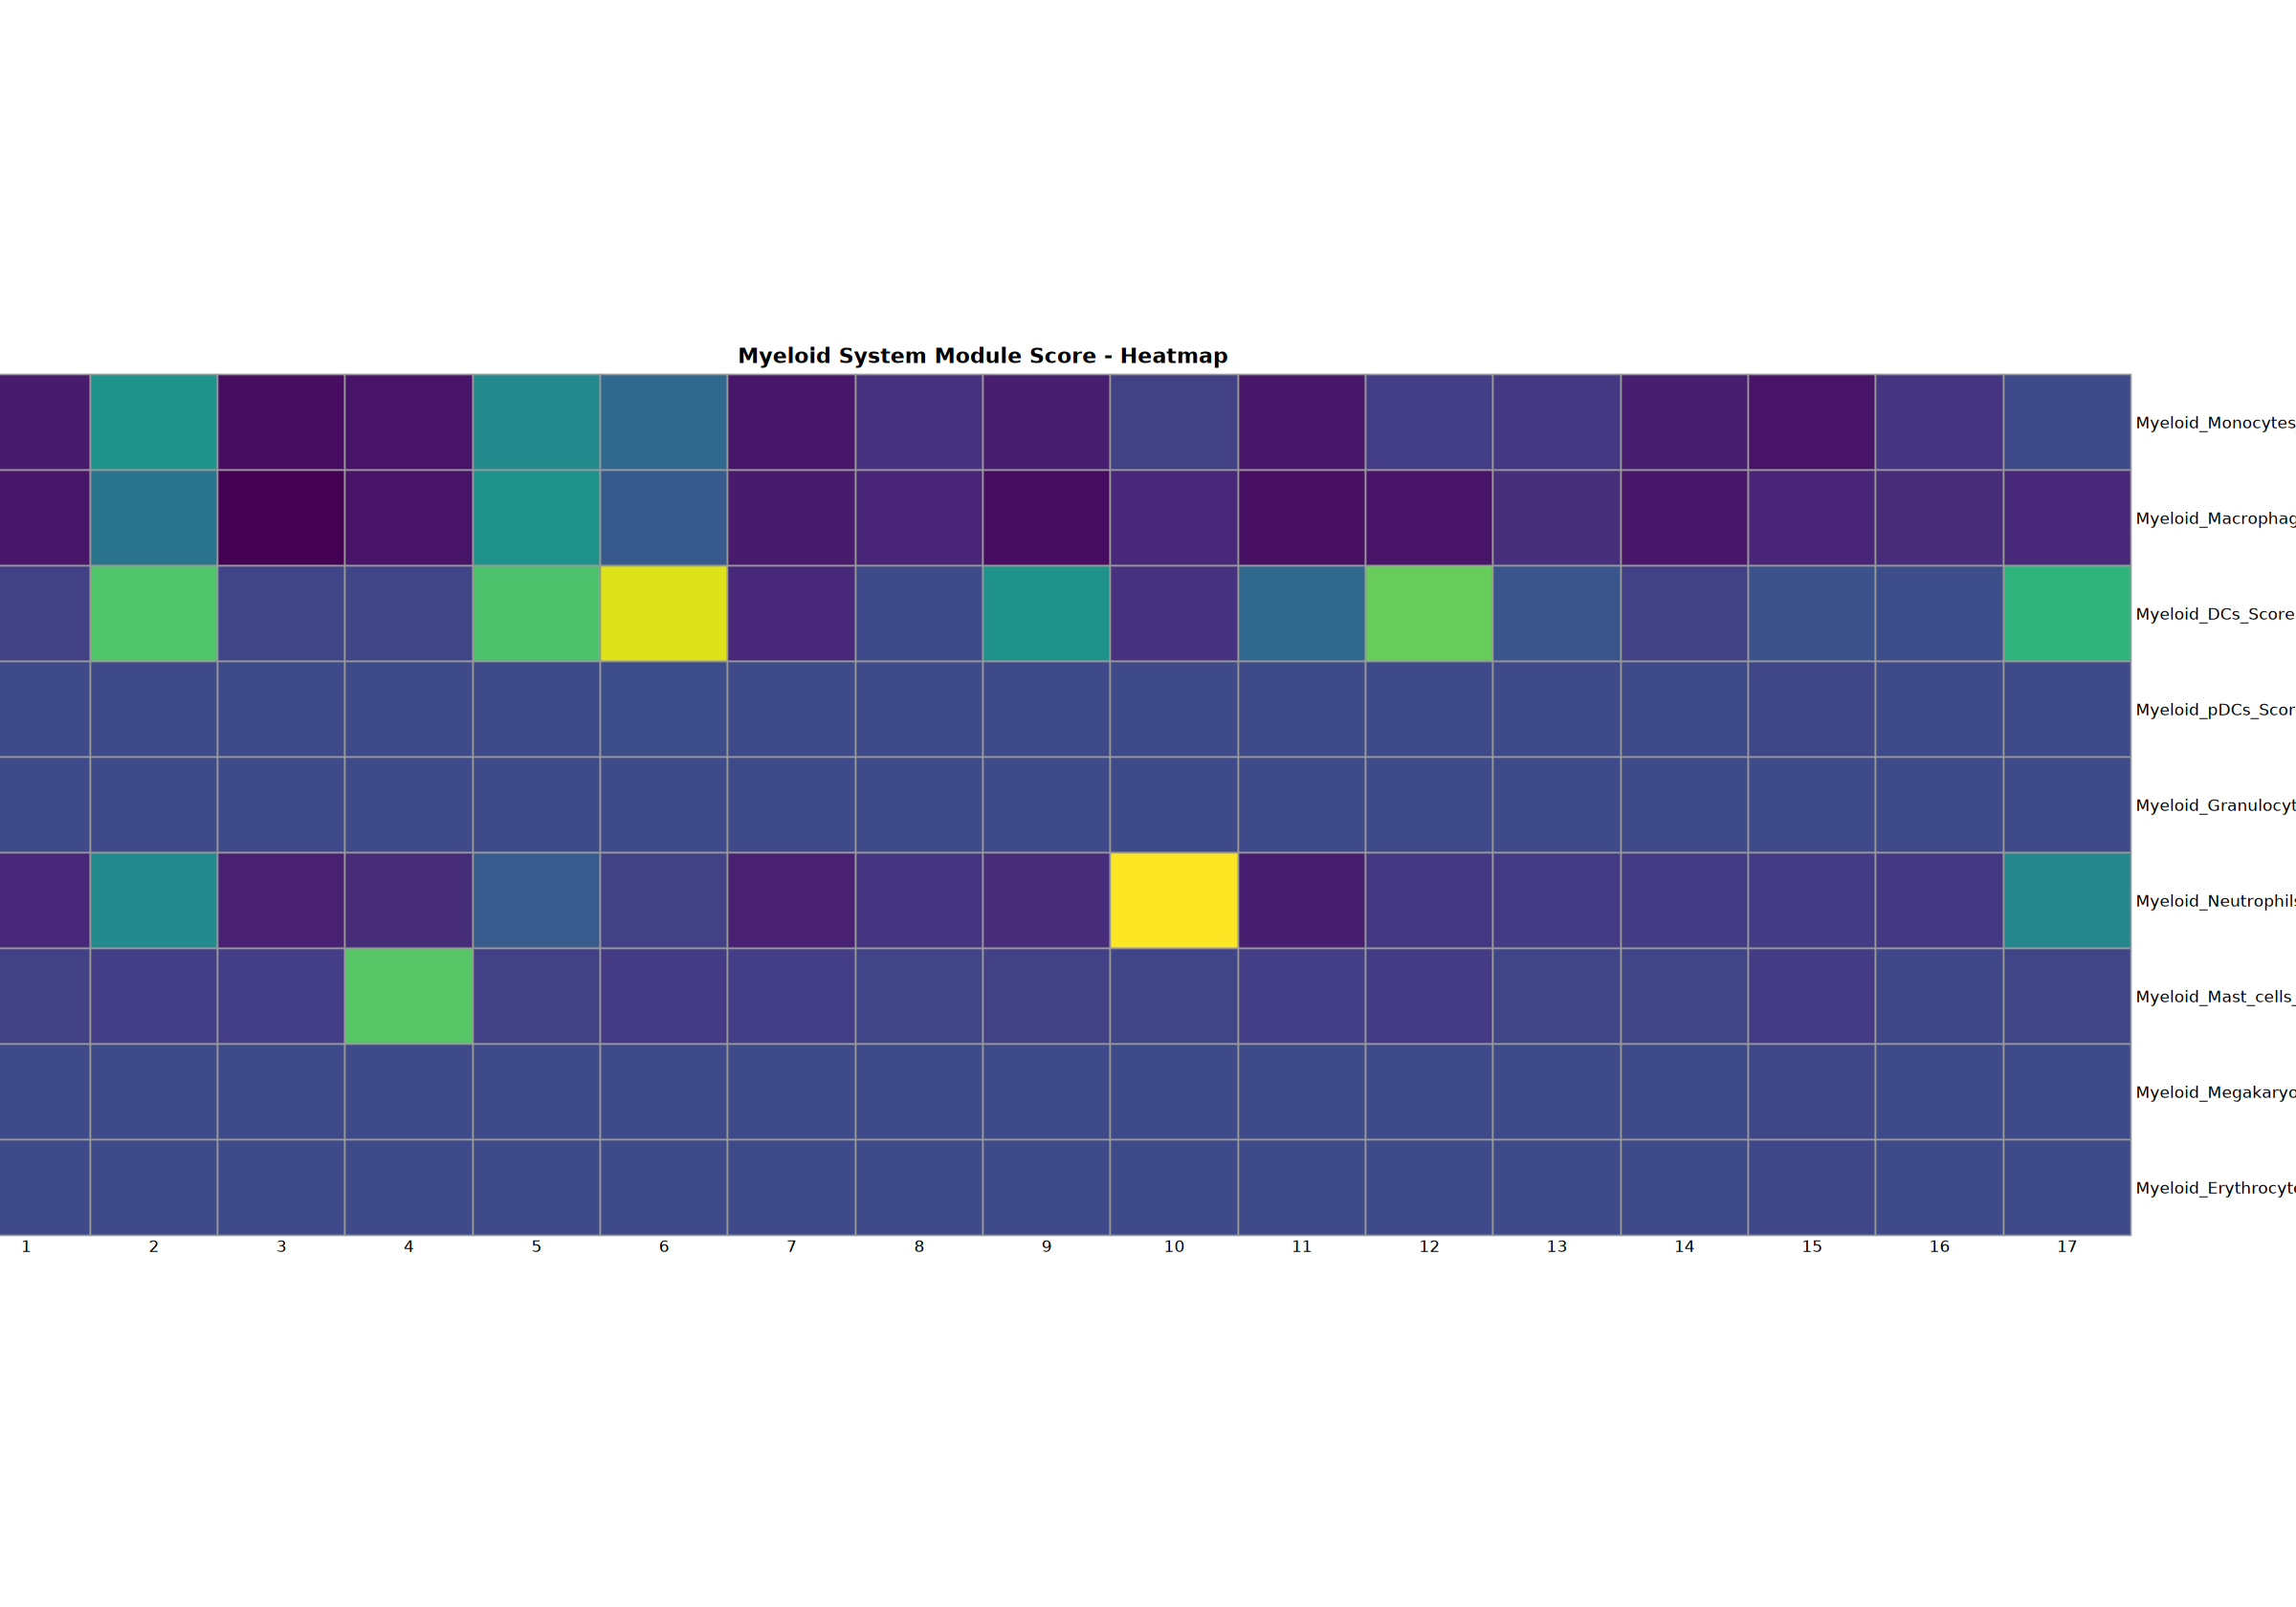
Myeloid System Analysis
Comprehensive analysis of monocytes, macrophages, DCs, pDCs, granulocytes, neutrophils, mast cells, megakaryocytes, and erythrocytes.
# Myeloid system analysis
cat("=== Starting Myeloid System Analysis ===\n")

seurat_obj <- analyze_cell_system(
    seurat_obj = seurat_obj,
    groups = resolution,
    markers = cell_systems$Myeloid,
    system_name = "Myeloid",
    create_heatmap = TRUE,
    create_violin = TRUE,
    create_feature = TRUE,
    create_scoring = TRUE,
    print_plot = FALSE,
    step = "Step3"
)

cat("Myeloid system analysis completed\n")=== Myeloid System Analysis ===
Found 33/34 marker genes
Creating dotplot with marker and gene set names...n
Warning message in FetchData.Seurat(object = object, vars = features, cells = cells):
“The following requested variables were not found: HBG1”
Scale for colour is already present.
Adding another scale for colour, which will replace the existing scale.
Dotplot saved: Step3_myeloid_dotplot.pdf
Creating heatmap...
Warning message in DoHeatmap(heatmap_object, features = available_genes, group.by = groups, :
“The following features were omitted as they were not found in the scale.data slot for the RNA assay: HBA1, PF4, CSF3R, MPO, ELANE, PLXNA4, CLEC4C, HLA-DPA1, HLA-DPB1, CD74, CTSS”
Scale for fill is already present.
Adding another scale for fill, which will replace the existing scale.
Heatmap saved: Step3_myeloid_heatmap.pdf\
Creating stacked violin plot...n Violin plot saved: Step3_myeloid_violin.pdf
Creating top 6 genes featureplot...n Feature plot saved: Step3_myeloid_top6_featureplot.pdf
Calculating gene set scores...n Added Monocytes score
Added Macrophages score
Added DCs score
Added pDCs score
Added Granulocytes score
Added Neutrophils score
Added Mast_cells score
Added Megakaryocytes score
Added Erythrocytes score
Creating gene set scoring dotplot...n
Scale for colour is already present.
Adding another scale for colour, which will replace the existing scale.
Score dotplot saved: Step3_myeloid_score_dotplot.pdf
Creating gene set scoring heatmap...n Score heatmap saved: Step3_myeloid_score_heatmap.pdf
Creating gene set scoring violin plot...n Score violin plot saved: Step3_myeloid_score_violin.pdf
Creating gene set scoring featureplot...n Score feature plot saved: Step3_myeloid_score_featureplot.pdf
Myeloid system analysis completed
Myeloid system analysis completed
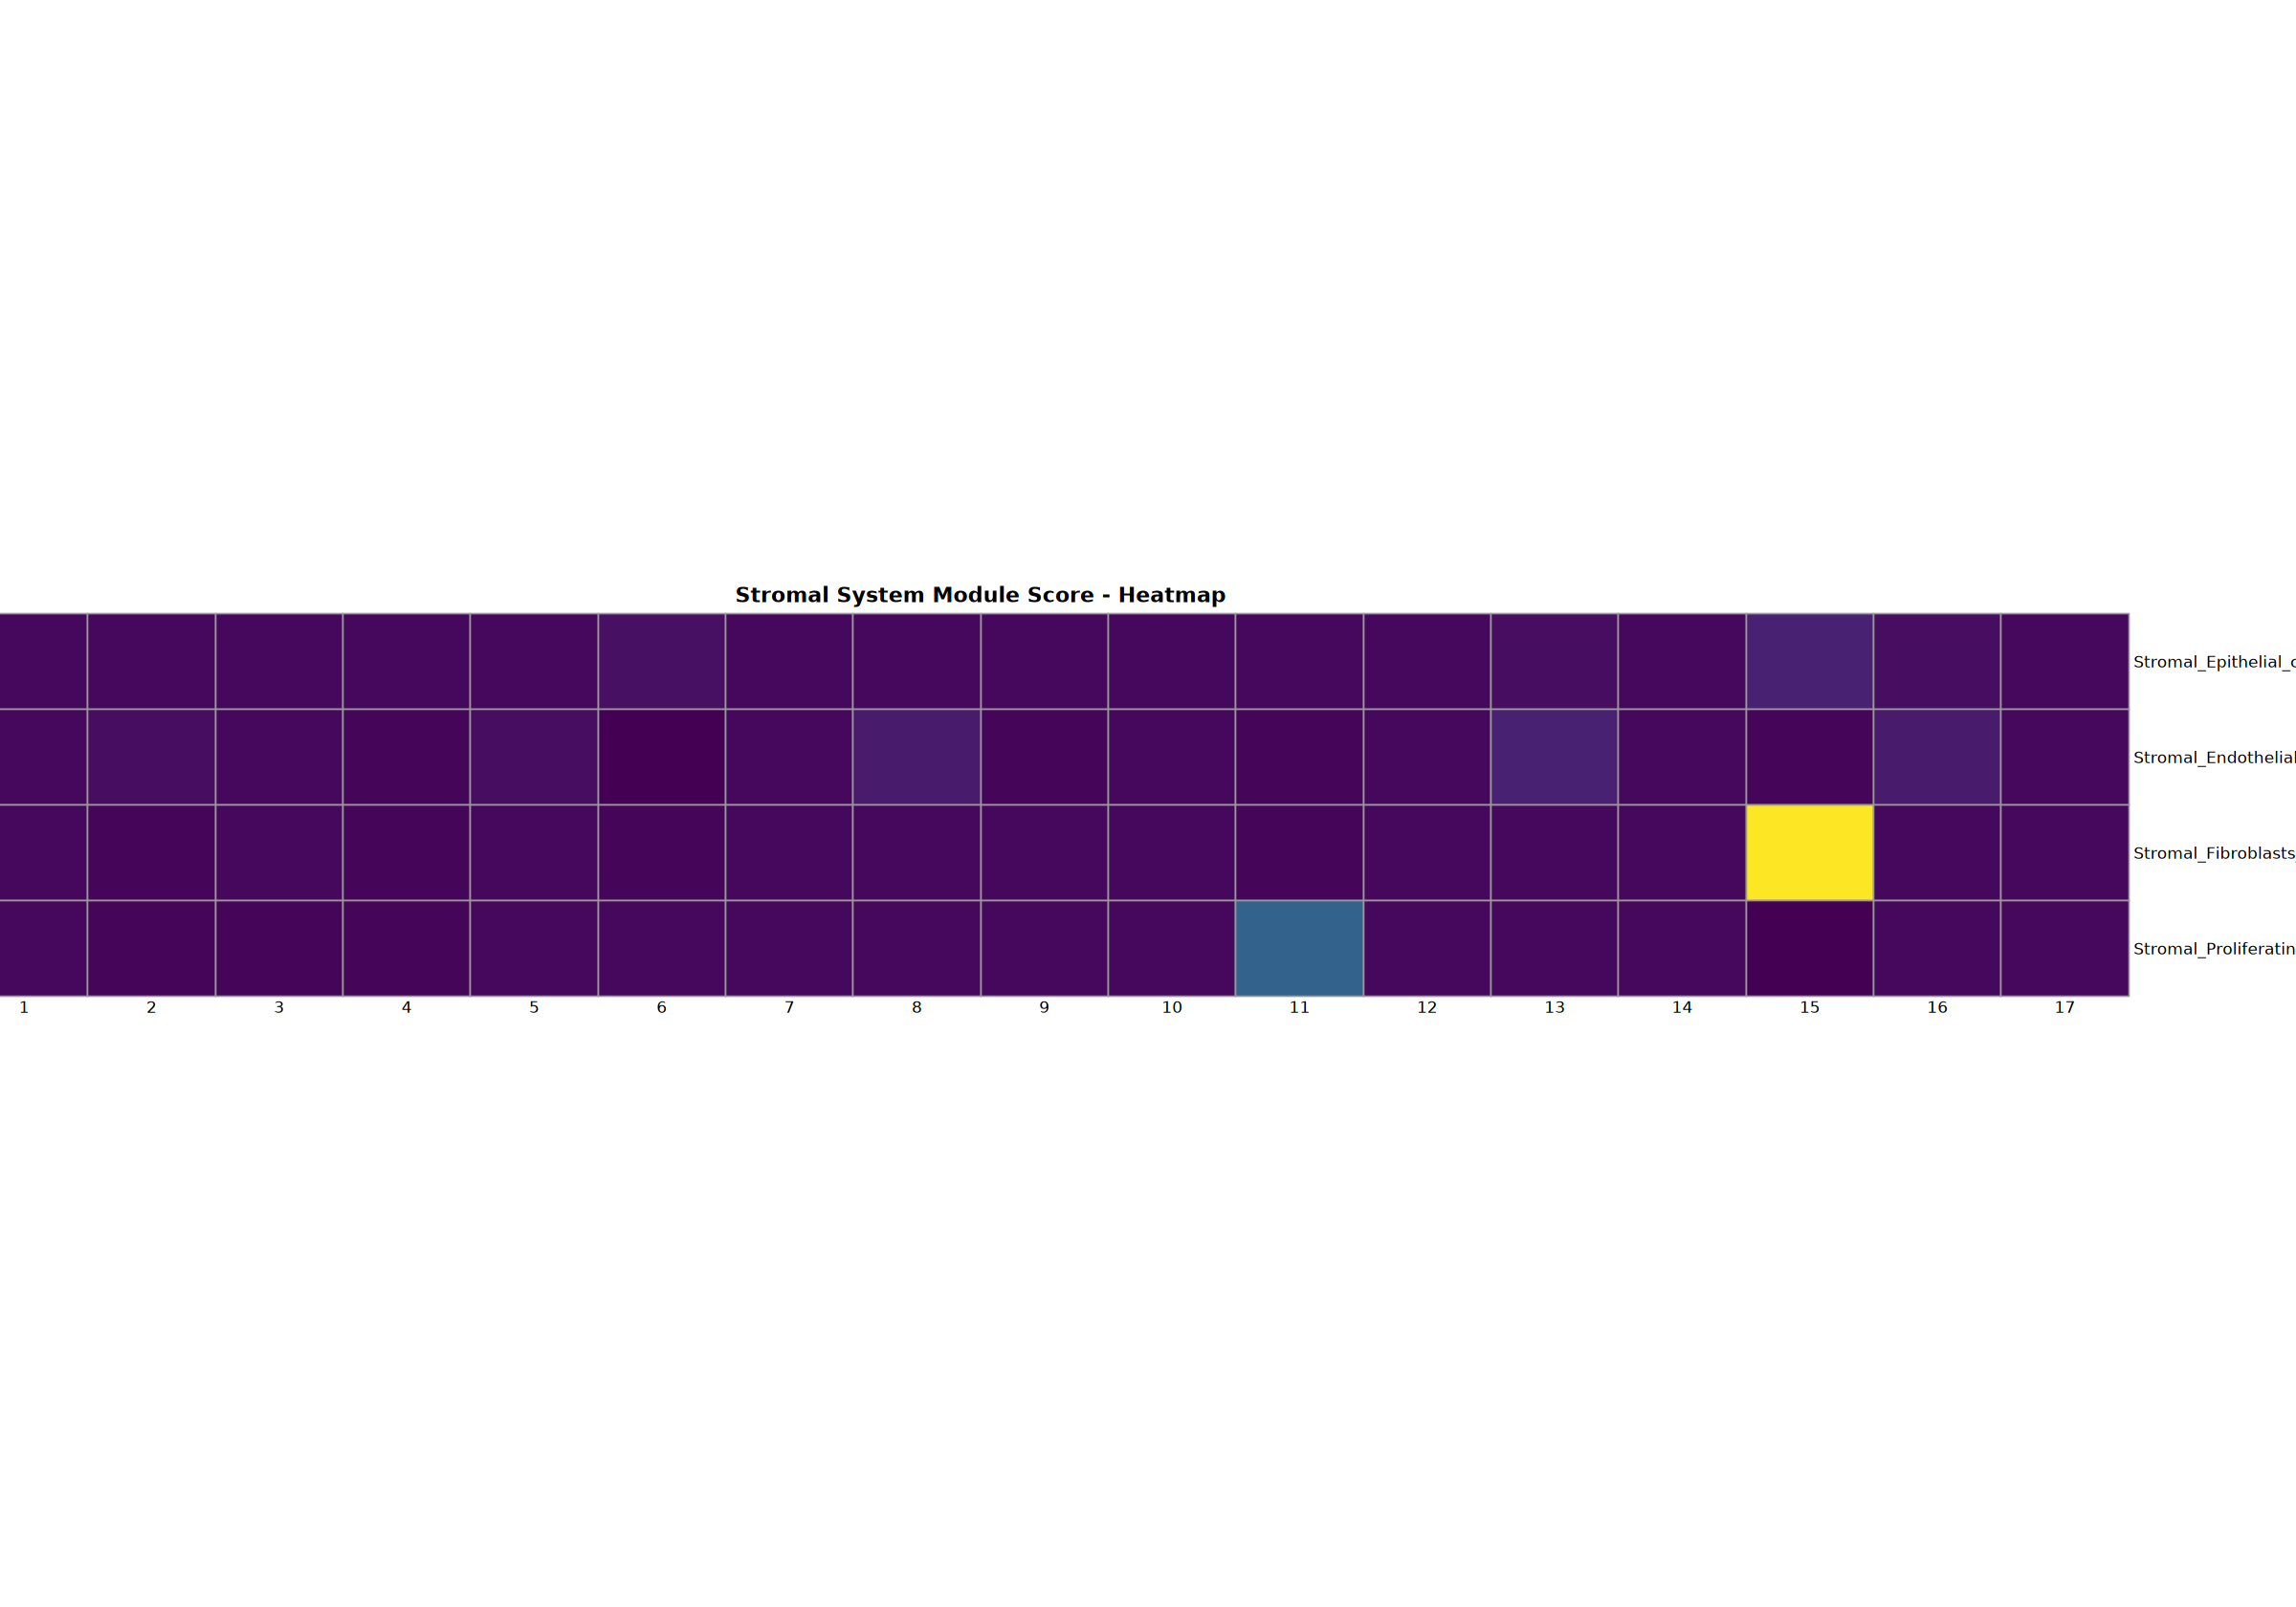
Stromal System Analysis
Analysis of epithelial, endothelial, fibroblast, and proliferating cells.
# Stromal system analysis (dotplot only as per requirements)
cat("=== Starting Stromal System Analysis ===\n")

seurat_obj <- analyze_cell_system(
    seurat_obj = seurat_obj,
    groups = resolution,
    markers = cell_systems$Stroma,
    system_name = "Stromal",
    create_heatmap = TRUE,
    create_violin = TRUE,
    create_feature = TRUE,
    create_scoring = TRUE,
    print_plot = FALSE,
    step = "Step3"
)

cat("Stromal system analysis completed\n")=== Stromal System Analysis ===
Found 12/13 marker genes
Creating dotplot with marker and gene set names...n
Warning message in FetchData.Seurat(object = object, vars = features, cells = cells):
“The following requested variables were not found: CDH5”
Scale for colour is already present.
Adding another scale for colour, which will replace the existing scale.
Dotplot saved: Step3_stromal_dotplot.pdf
Creating heatmap...
Warning message in DoHeatmap(heatmap_object, features = available_genes, group.by = groups, :
“The following features were omitted as they were not found in the scale.data slot for the RNA assay: PCDH17, ICAM2, PECAM1”
Scale for fill is already present.
Adding another scale for fill, which will replace the existing scale.
Heatmap saved: Step3_stromal_heatmap.pdf\
Creating stacked violin plot...n Violin plot saved: Step3_stromal_violin.pdf
Creating top 6 genes featureplot...n Feature plot saved: Step3_stromal_top6_featureplot.pdf
Calculating gene set scores...n Added Epithelial_cells score
Added Endothelial_cells score
Added Fibroblasts score
Added Proliferating_cells score
Creating gene set scoring dotplot...n
Scale for colour is already present.
Adding another scale for colour, which will replace the existing scale.
Score dotplot saved: Step3_stromal_score_dotplot.pdf
Creating gene set scoring heatmap...n Score heatmap saved: Step3_stromal_score_heatmap.pdf
Creating gene set scoring violin plot...n Score violin plot saved: Step3_stromal_score_violin.pdf
Creating gene set scoring featureplot...n Score feature plot saved: Step3_stromal_score_featureplot.pdf
Stromal system analysis completed
Stromal system analysis completed
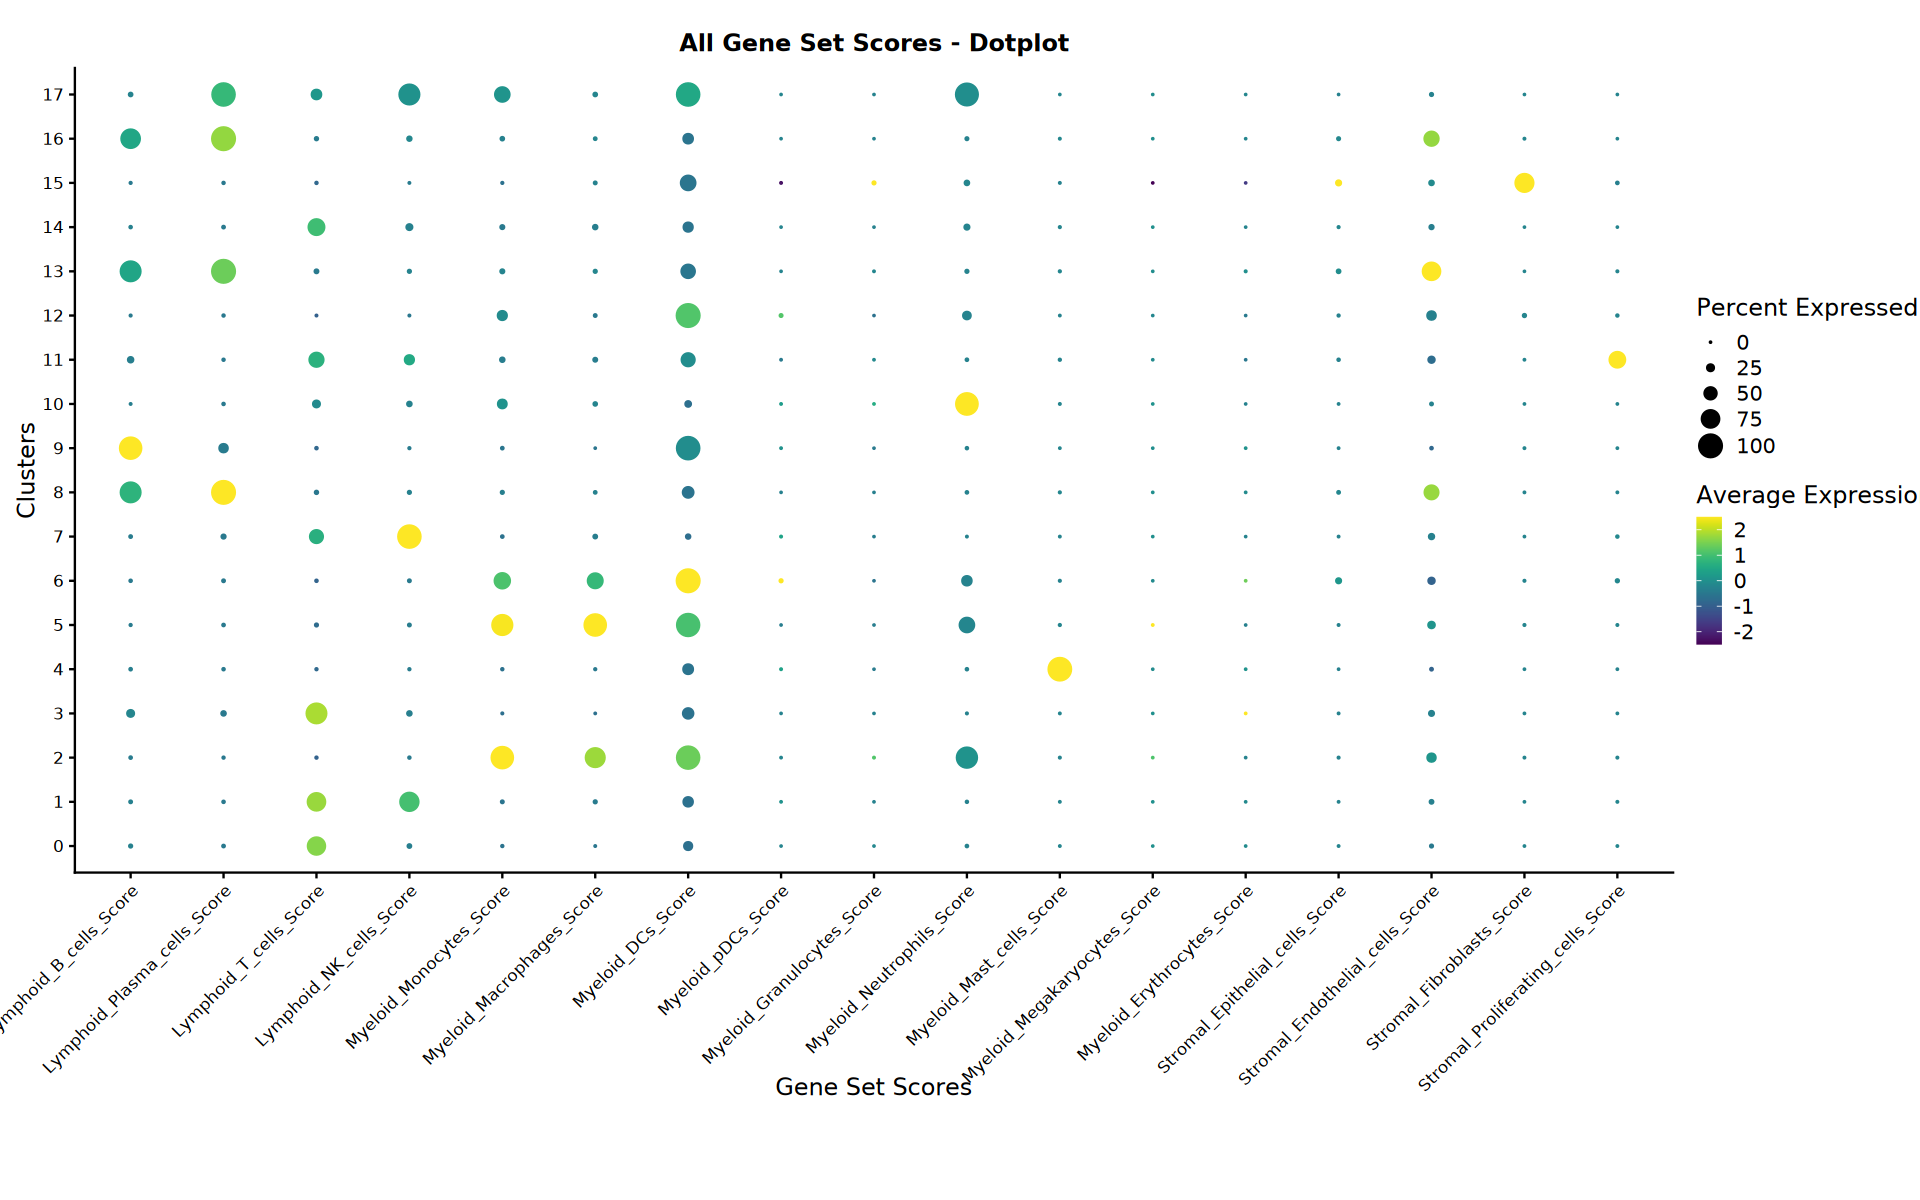
Analysis Summary
Display summary of completed analyses and generated files.
# === All Scores Dotplot ===
cat("=== Creating All Scores Dotplot ===")

# Get all score columns
all_scores <- grep(".*_.*_Score$", colnames(seurat_obj@meta.data), value = TRUE)

if (length(all_scores) > 0) {
    cat(sprintf("Found %d gene set scores for visualization", length(all_scores)))

    # Set up plot dimensions
    options(repr.plot.width = 16, repr.plot.height = 10)

    # Create combined scores dotplot
    tryCatch({
        scores_dotplot <- DotPlot(seurat_obj,
                                features = all_scores,
                                group.by = resolution) +
            scale_color_gradientn(colors = continuous_colors) +
            theme(axis.text.x = element_text(angle = 45, hjust = 1, size = 10),
                  axis.text.y = element_text(size = 10),
                  plot.title = element_text(hjust = 0.5, size = 14),
                  plot.margin = margin(t = 20, r = 10, b = 60, l = 10)) +
            ggtitle("All Gene Set Scores - Dotplot") +
            labs(x = "Gene Set Scores", y = "Clusters")

        print(scores_dotplot)

        # Save all scores dotplot
        ggsave(filename = file.path(output_path, "Step3_All_Scores_dotplot.pdf"),
               plot = scores_dotplot, width = 20, height = 15, dpi = 300)

        cat("All scores dotplot saved: Step3_All_Scores_dotplot.pdf")
    }, error = function(e) {
        cat(sprintf("Could not create all scores dotplot: %s", e))
    })
} else {
    cat("No gene set scores found for visualization")
}Scale for colour is already present.
Adding another scale for colour, which will replace the existing scale.
All scores dotplot saved: Step3_All_Scores_dotplot.pdf
cat("=== Manual Annotation Analysis Summary ===\n")

# Count generated scores
all_scores <- grep(".*_.*_Score$", colnames(seurat_obj@meta.data), value = TRUE)
cat(sprintf("Generated %d gene set scores\n", length(all_scores)))

if (length(all_scores) > 0) {
    cat("Gene set scores:\n")
    for (score in all_scores) {
        cat("  -", score, "\n")
    }
}

# List generated files
cat("\nGenerated visualization files:\n")
pdf_files <- list.files(output_path, pattern = "\\.pdf$", full.names = FALSE)
annotation_files <- pdf_files[grepl("(lymphoid|myeloid|stromal)", pdf_files, ignore.case = TRUE)]
for (file in annotation_files) {
    cat("  -", file, "\n")
}

cat("\nAnalysis completed successfully!\n")Generated 17 gene set scores
Gene set scores:
- Lymphoid_B_cells_Score
- Lymphoid_Plasma_cells_Score
- Lymphoid_T_cells_Score
- Lymphoid_NK_cells_Score
- Myeloid_Monocytes_Score
- Myeloid_Macrophages_Score
- Myeloid_DCs_Score
- Myeloid_pDCs_Score
- Myeloid_Granulocytes_Score
- Myeloid_Neutrophils_Score
- Myeloid_Mast_cells_Score
- Myeloid_Megakaryocytes_Score
- Myeloid_Erythrocytes_Score
- Stromal_Epithelial_cells_Score
- Stromal_Endothelial_cells_Score
- Stromal_Fibroblasts_Score
- Stromal_Proliferating_cells_Score
Generated visualization files:
- Step3_lymphoid_dotplot.pdf
- Step3_lymphoid_heatmap.pdf
- Step3_lymphoid_score_dotplot.pdf
- Step3_lymphoid_score_featureplot.pdf
- Step3_lymphoid_score_heatmap.pdf
- Step3_lymphoid_score_violin.pdf
- Step3_lymphoid_top6_featureplot.pdf
- Step3_lymphoid_violin.pdf
- Step3_myeloid_dotplot.pdf
- Step3_myeloid_heatmap.pdf
- Step3_myeloid_score_dotplot.pdf
- Step3_myeloid_score_featureplot.pdf
- Step3_myeloid_score_heatmap.pdf
- Step3_myeloid_score_violin.pdf
- Step3_myeloid_top6_featureplot.pdf
- Step3_myeloid_violin.pdf
- Step3_stromal_dotplot.pdf
- Step3_stromal_heatmap.pdf
- Step3_stromal_score_dotplot.pdf
- Step3_stromal_score_featureplot.pdf
- Step3_stromal_score_heatmap.pdf
- Step3_stromal_score_violin.pdf
- Step3_stromal_top6_featureplot.pdf
- Step3_stromal_violin.pdf
Analysis completed successfully!
Save RDS Results
Save the Manual annotated Seurat object.
cat("=== Saving Final Results ===\n")

# Save annotated Seurat object
annotated_seurat_path <- file.path(output_path, "Step3_Cell_Annotation.rds")
saveRDS(seurat_obj, annotated_seurat_path)
cat("Saved annotated Seurat object to:", annotated_seurat_path, "\n")Saved annotated Seurat object to: /home/demo-seekgene-com/workspace/project/demo-seekgene-com/CellAnnotation/result/Step3_Cell_Annotation.rds
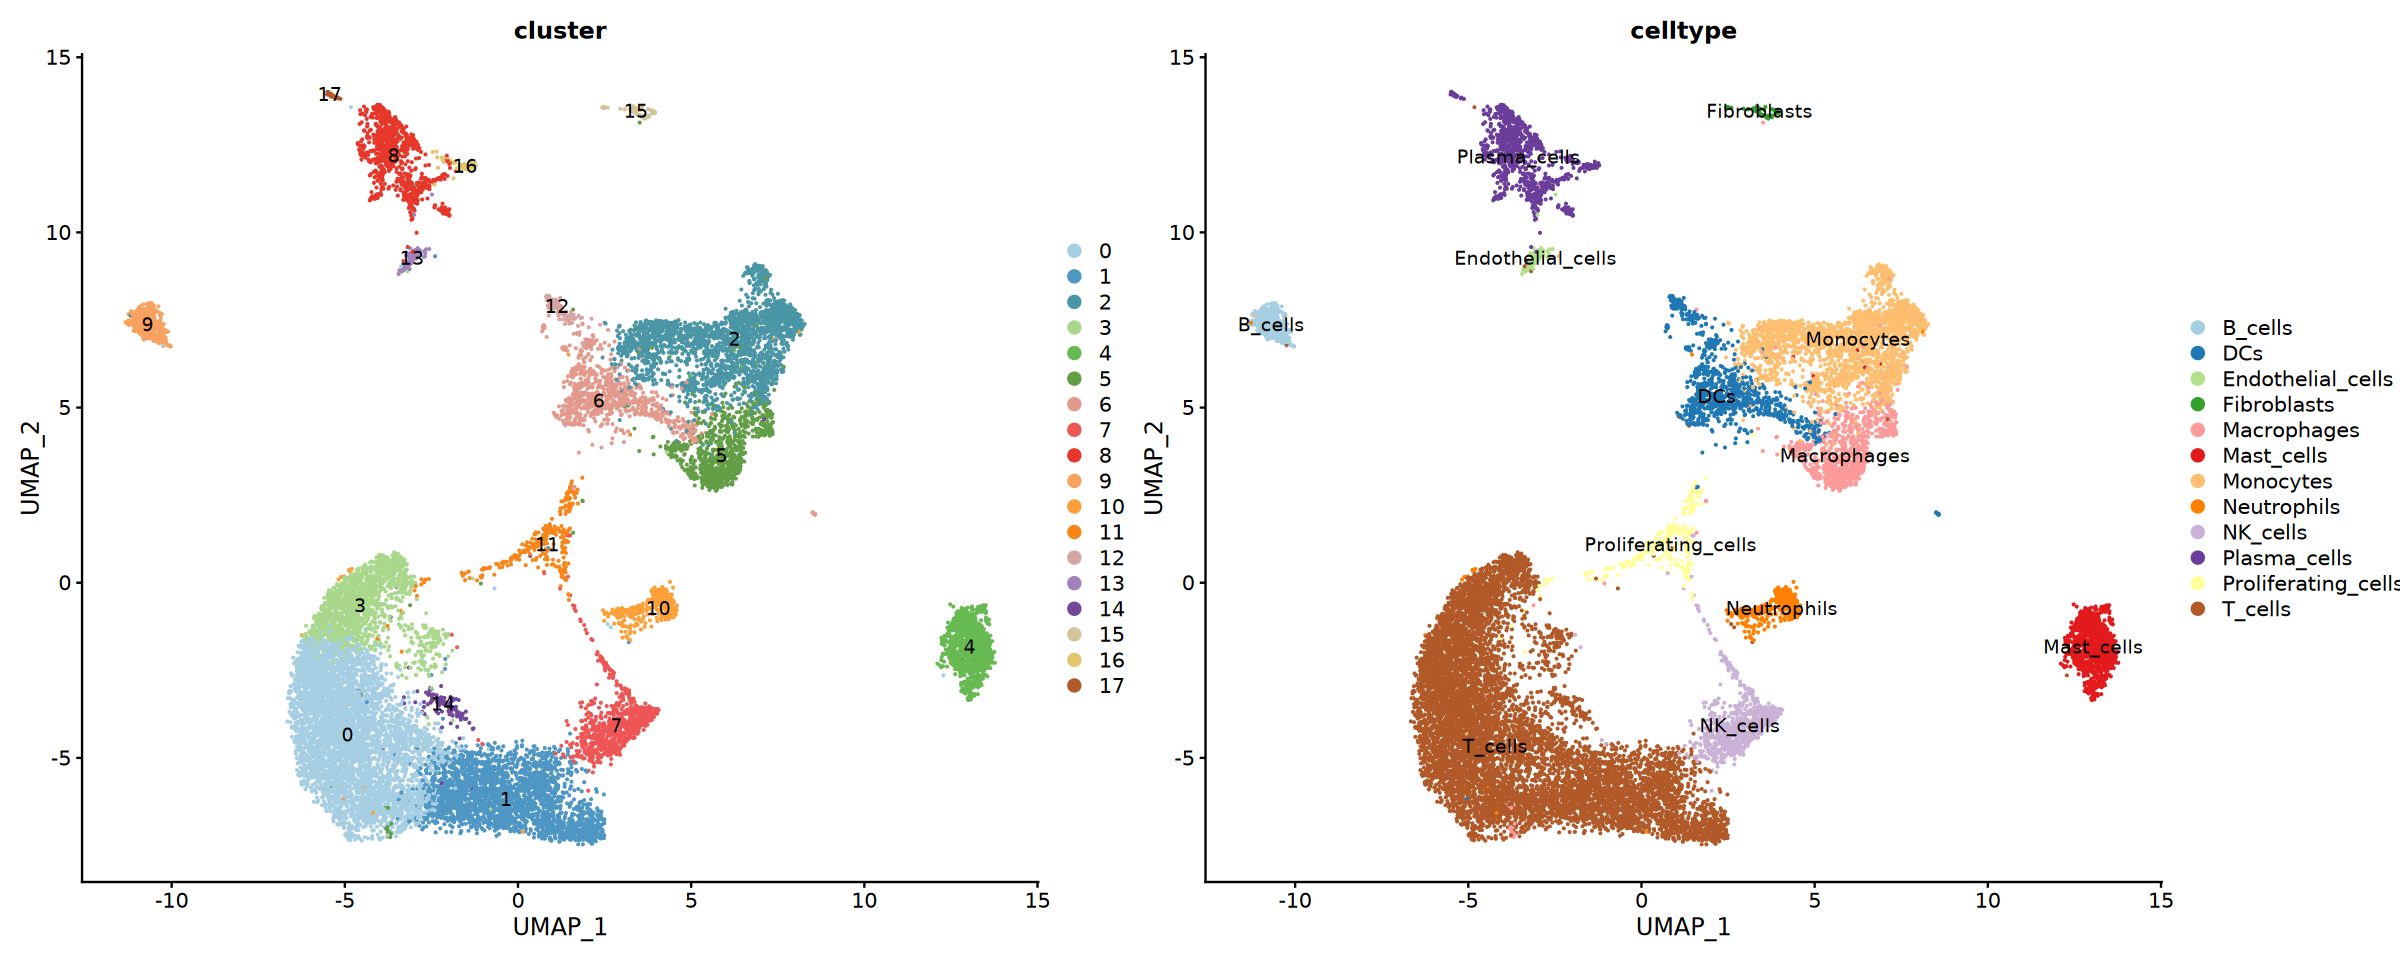
Final Cell Type Annotation
Parameter Configuration
Read the RDS file, add cell type names, and draw the UMAP graph of the final cell annotation results.
cat("=== Step 4: Final Cell Type Annotation ===\n")

# Perform final cell annotation
Final_Cell_Annotation <- TRUE

# Define path to the annotated Seurat object
annotated_seurat_path <- file.path(output_path, "Step3_Cell_Annotation.rds")

# Label naming for cell annotation information
anno_label <- "celltype"

# Define a named vector that maps each cluster ID to a biologically meaningful cell type label.
cat("Adding cell types...\n")
cluster_to_celltype <- c(
    "0" = "T_cells",
    "1" = "T_cells",
    "2" = "Monocytes",
    "3" = "T_cells",
    "4" = "Mast_cells",
    "5" = "Macrophages",
    "6" = "DCs",
    "7" = "NK_cells",
    "8" = "Plasma_cells",
    "9" = "B_cells",
    "10" = "Neutrophils",
    "11" = "Proliferating_cells",
    "12" = "DCs",
    "13" = "Endothelial_cells",
    "14" = "T_cells",
    "15" = "Fibroblasts",
    "16" = "Plasma_cells",
    "17" = "Plasma_cells"
)

# Define a list of marker genes for each cell type.
cat("Adding cell type markers...\n")
cell_system_markers <- list(
    B_cells = c("CD79A", "CD79B", "MS4A1"),
    DCs = c("CD74", "HLA-DPB1", "HLA-DPA1", "CD1C", "FCER1A", "CST3"),
    Endothelial_cells = c("PECAM1", "ICAM2", "CLDN5", "CDH5", "PCDH17"),
    Fibroblasts = c("DCN", "COL1A2", "COL1A1"),
    Macrophages = c("CD68", "C1QA", "CD163", "CCL3", "VCAN"),
    Mast_cells = c("CPA3", "ENPP3", "HDC", "GATA2"),
    Monocytes = c("LYZ", "CTSS", "CD14", "FCGR3A"),
    Neutrophils = c("S100A9", "S100A8", "FCGR3B", "CXCL8", "CSF3R"),
    NK_cells = c("NKG7", "GNLY", "KLRF1", "KLRD1"),
    Plasma_cells = c("JCHAIN", "MZB1", "IGHG1"),
    Proliferating_cells = c("TOP2A", "MKI67"),
    T_cells = c("CD3D", "CD3E", "CD3G", "CD2")
)Adding cell types...n Adding cell type markers...
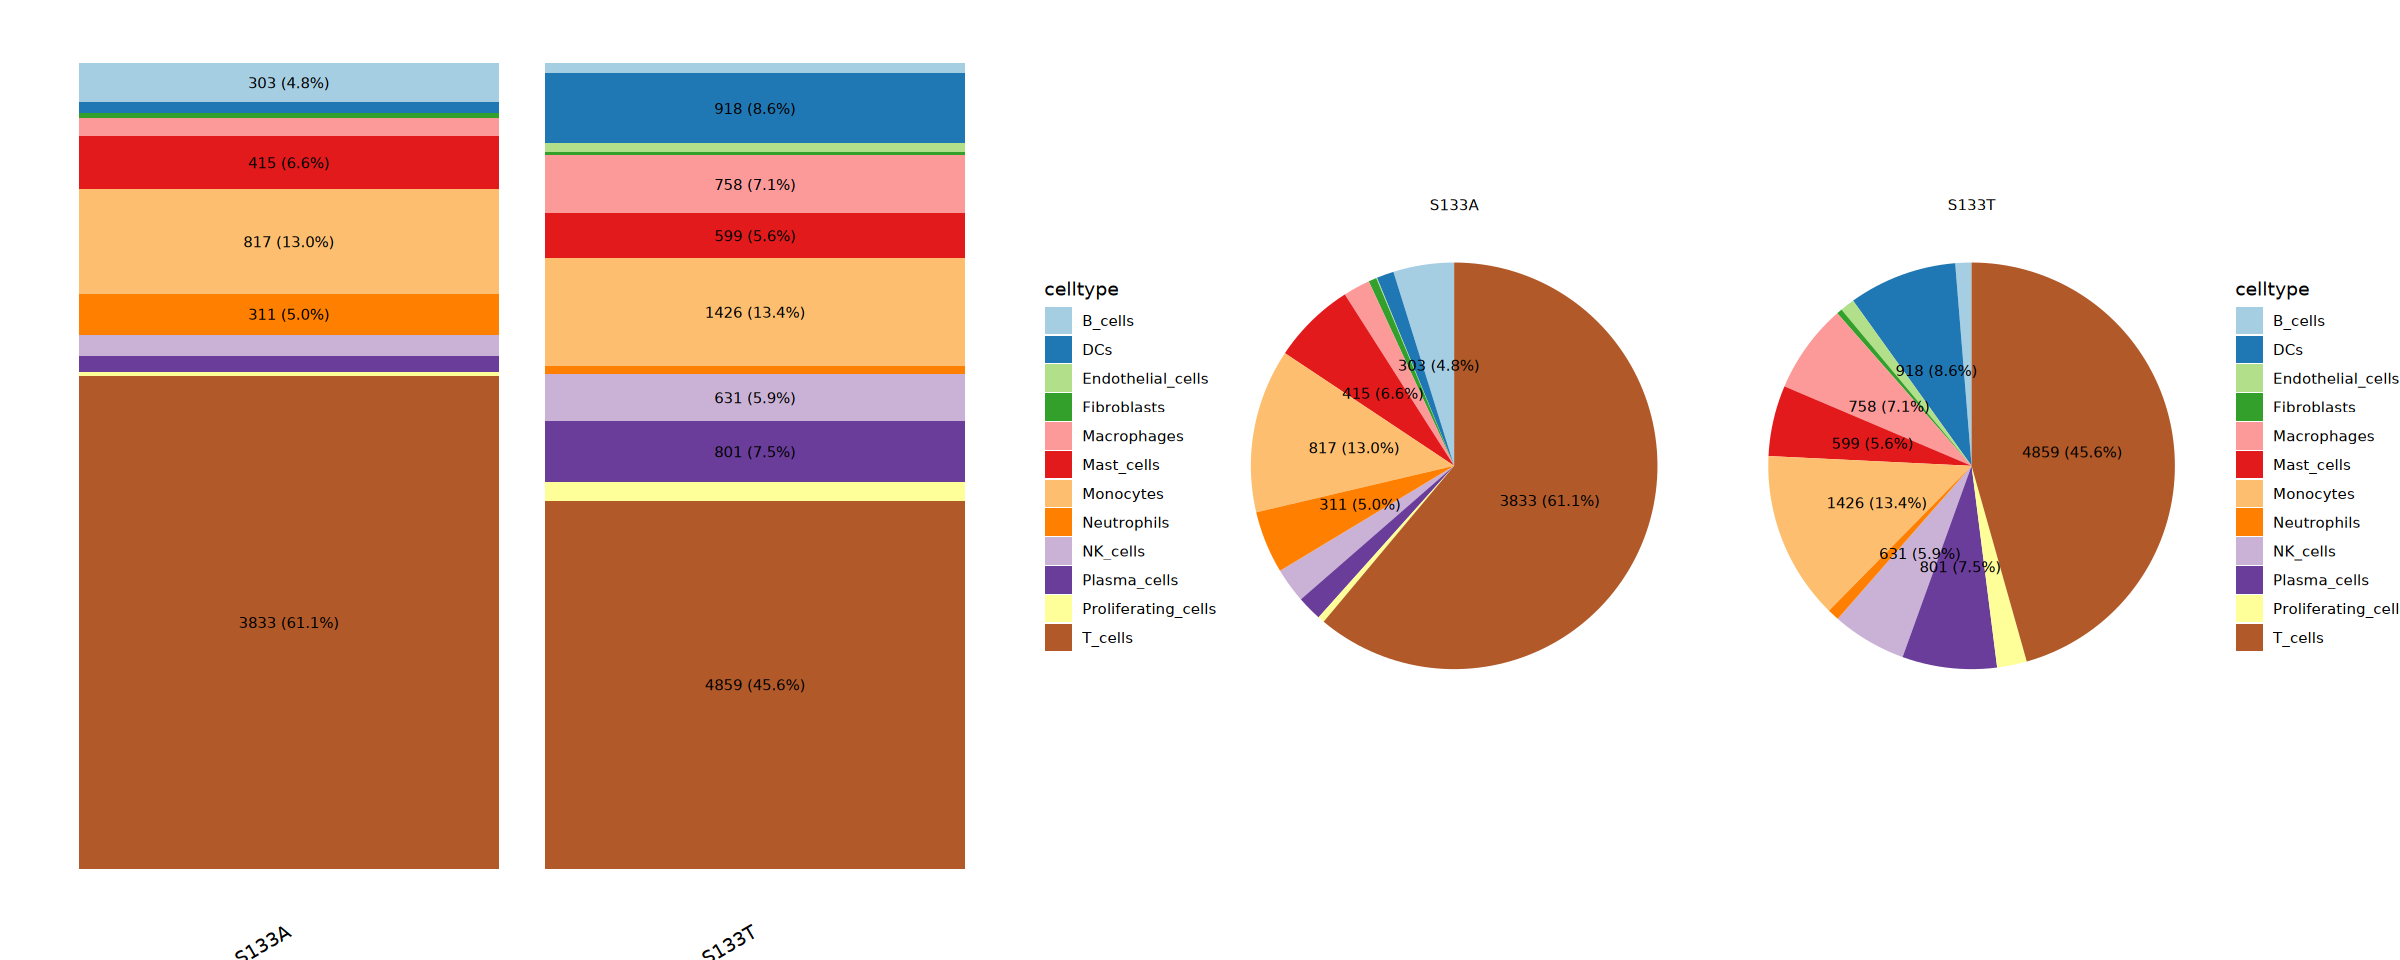
Create Cell Type Comparison Function
Function for comparing the number and proportion of cell types in different groups.
celltype_comp <- function(meta,
                          annotation_col = "celltype",
                          group = "sample",
                          plot_width = 20,
                          plot_height = 8,
                          label_min_prop = 0.03) {
  group_cols <- strsplit(group, ",")[[1]] |> trimws()

  old_opt <- options(repr.plot.width = plot_width, repr.plot.height = plot_height)

  df <- meta |>
    tidyr::unite("group_key", tidyselect::all_of(group_cols), sep = " | ", remove = FALSE) |>
    dplyr::count(group_key, annotation = .data[[annotation_col]], name = "n") |>
    dplyr::group_by(group_key) |>
    dplyr::mutate(prop = n / sum(n)) |>
    dplyr::ungroup() |>
    dplyr::mutate(label_text = ifelse(
      prop >= label_min_prop,
      paste0(n, " (", scales::percent(prop, accuracy = 0.1), ")"),
      NA
    ))

  p_bar <- ggplot(df, aes(x = group_key, y = prop, fill = annotation)) +
    geom_col() +
    geom_text(aes(label = label_text),
              position = position_stack(vjust = 0.5),
              color = "black", size = 3, na.rm = TRUE) +
    scale_y_continuous(labels = scales::label_percent(accuracy = 1)) +
    scale_fill_manual(values = celltype_discrete_colors) +
    labs(x = "group", y = "pro", fill = annotation_col) +
    theme_void() +
    theme(axis.text.x = element_text(angle = 30, hjust = 1))

  p_pie <- ggplot(df, aes(x = "", y = prop, fill = annotation)) +
    scale_fill_manual(values = celltype_discrete_colors) +
    geom_col(width = 1) +
    geom_text(aes(label = label_text),
              position = position_stack(vjust = 0.5),
              color = "black", size = 3, na.rm = TRUE) +
    coord_polar(theta = "y") +
    facet_wrap(~ group_key) +
    labs(fill = annotation_col) +
    theme_void()

    return(p_bar + p_pie)
}
Visualize the Final Cell Annotation Results
Draw UMAP plots of cell types and stack bar charts and pie charts of cell proportions in different groups.
if (Final_Cell_Annotation & file.exists(annotated_seurat_path)) {

    cat("Loading annotated Seurat object...\n")
    # Load the Seurat object saved from Step 3
    seurat_final <- readRDS(annotated_seurat_path)

    # Extract cluster identities from the specified resolution
    cluster_vector <- seurat_final[[resolution]][, 1]
    names(cluster_vector) <- rownames(seurat_final[[resolution]])

    # Assign cell type labels to each cell based on cluster identity
    seurat_final[[anno_label]] <- cluster_to_celltype[as.character(cluster_vector)]

    # Show a table of clusters vs. assigned cell types
    table(seurat_final@meta.data[[resolution]], seurat_final@meta.data[[anno_label]])

    cat("Creating final UMAP visualization...\n")

    # Set plotting dimensions (width and height)
    options(repr.plot.width = 20, repr.plot.height = 8)

    # Create UMAP plot colored by cluster
    umap_clusters <- DimPlot(seurat_final,
                           reduction = "umap",
                           group.by = resolution,
                           cols = discrete_colors,
                           label = TRUE,
                           label.size = 4) +
        ggtitle("cluster") +
        theme(plot.title = element_text(hjust = 0.5, size = 14))

    n_celltypes <- length(table(seurat_final[[anno_label]]))
    celltype_discrete_colors <- brewer.pal(min(n_celltypes, 12), discrete_colors_name)
    if (n_celltypes > 12) {
        celltype_discrete_colors <- colorRampPalette(discrete_colors)(n_celltypes)
    }

    # Create UMAP plot colored by assigned cell type
    umap_celltypes <- DimPlot(seurat_final,
                            reduction = "umap",
                            group.by = anno_label,
                            cols = celltype_discrete_colors,
                            label = TRUE,
                            label.size = 4) +
        ggtitle(anno_label) +
        theme(plot.title = element_text(hjust = 0.5, size = 14))

    # Combine both plots side by side
    combined_umap <- umap_clusters + umap_celltypes

    # Display the combined plot
    print(combined_umap)

    # Save the combined UMAP plot as a PDF
    ggsave(filename = file.path(output_path, "Step4_Final_Cell_Annotation_UMAP.pdf"),
           plot = combined_umap, width = 20, height = 8, dpi = 300)

    cat("Final UMAP saved: Step4_Final_Cell_Annotation_UMAP.pdf\n")

    cat("Creating final cell type proportion visualization...\n")

    combined_prop <- celltype_comp(seurat_final@meta.data,annotation_col = anno_label, group = "sample")

    print(combined_prop)

    ggsave(filename = file.path(output_path, "Step4_Final_Cell_Type_Proportion.pdf"),
           plot = combined_prop, width = 20, height = 8, dpi = 300)

    cat("Final Proportion saved: Step4_Final_Cell_Type_Proportion.pdf\n")

    # Save the fully annotated Seurat object for downstream analysis
    final_annotated_path <- file.path(output_path, "Step4_Final_Cell_Annotation.rds")
    saveRDS(seurat_final, final_annotated_path)

    cat("Final annotated Seurat object saved:", final_annotated_path, "\n")

}Creating final cell type proportion visualization...
Final Proportion saved: Step4_Final_Cell_Type_Proportion.pdf
Final annotated Seurat object saved: /home/demo-seekgene-com/workspace/project/demo-seekgene-com/CellAnnotation/result/Step4_Final_Cell_Annotation.rds
All System Analysis
Analysis of the final cell annotation results.
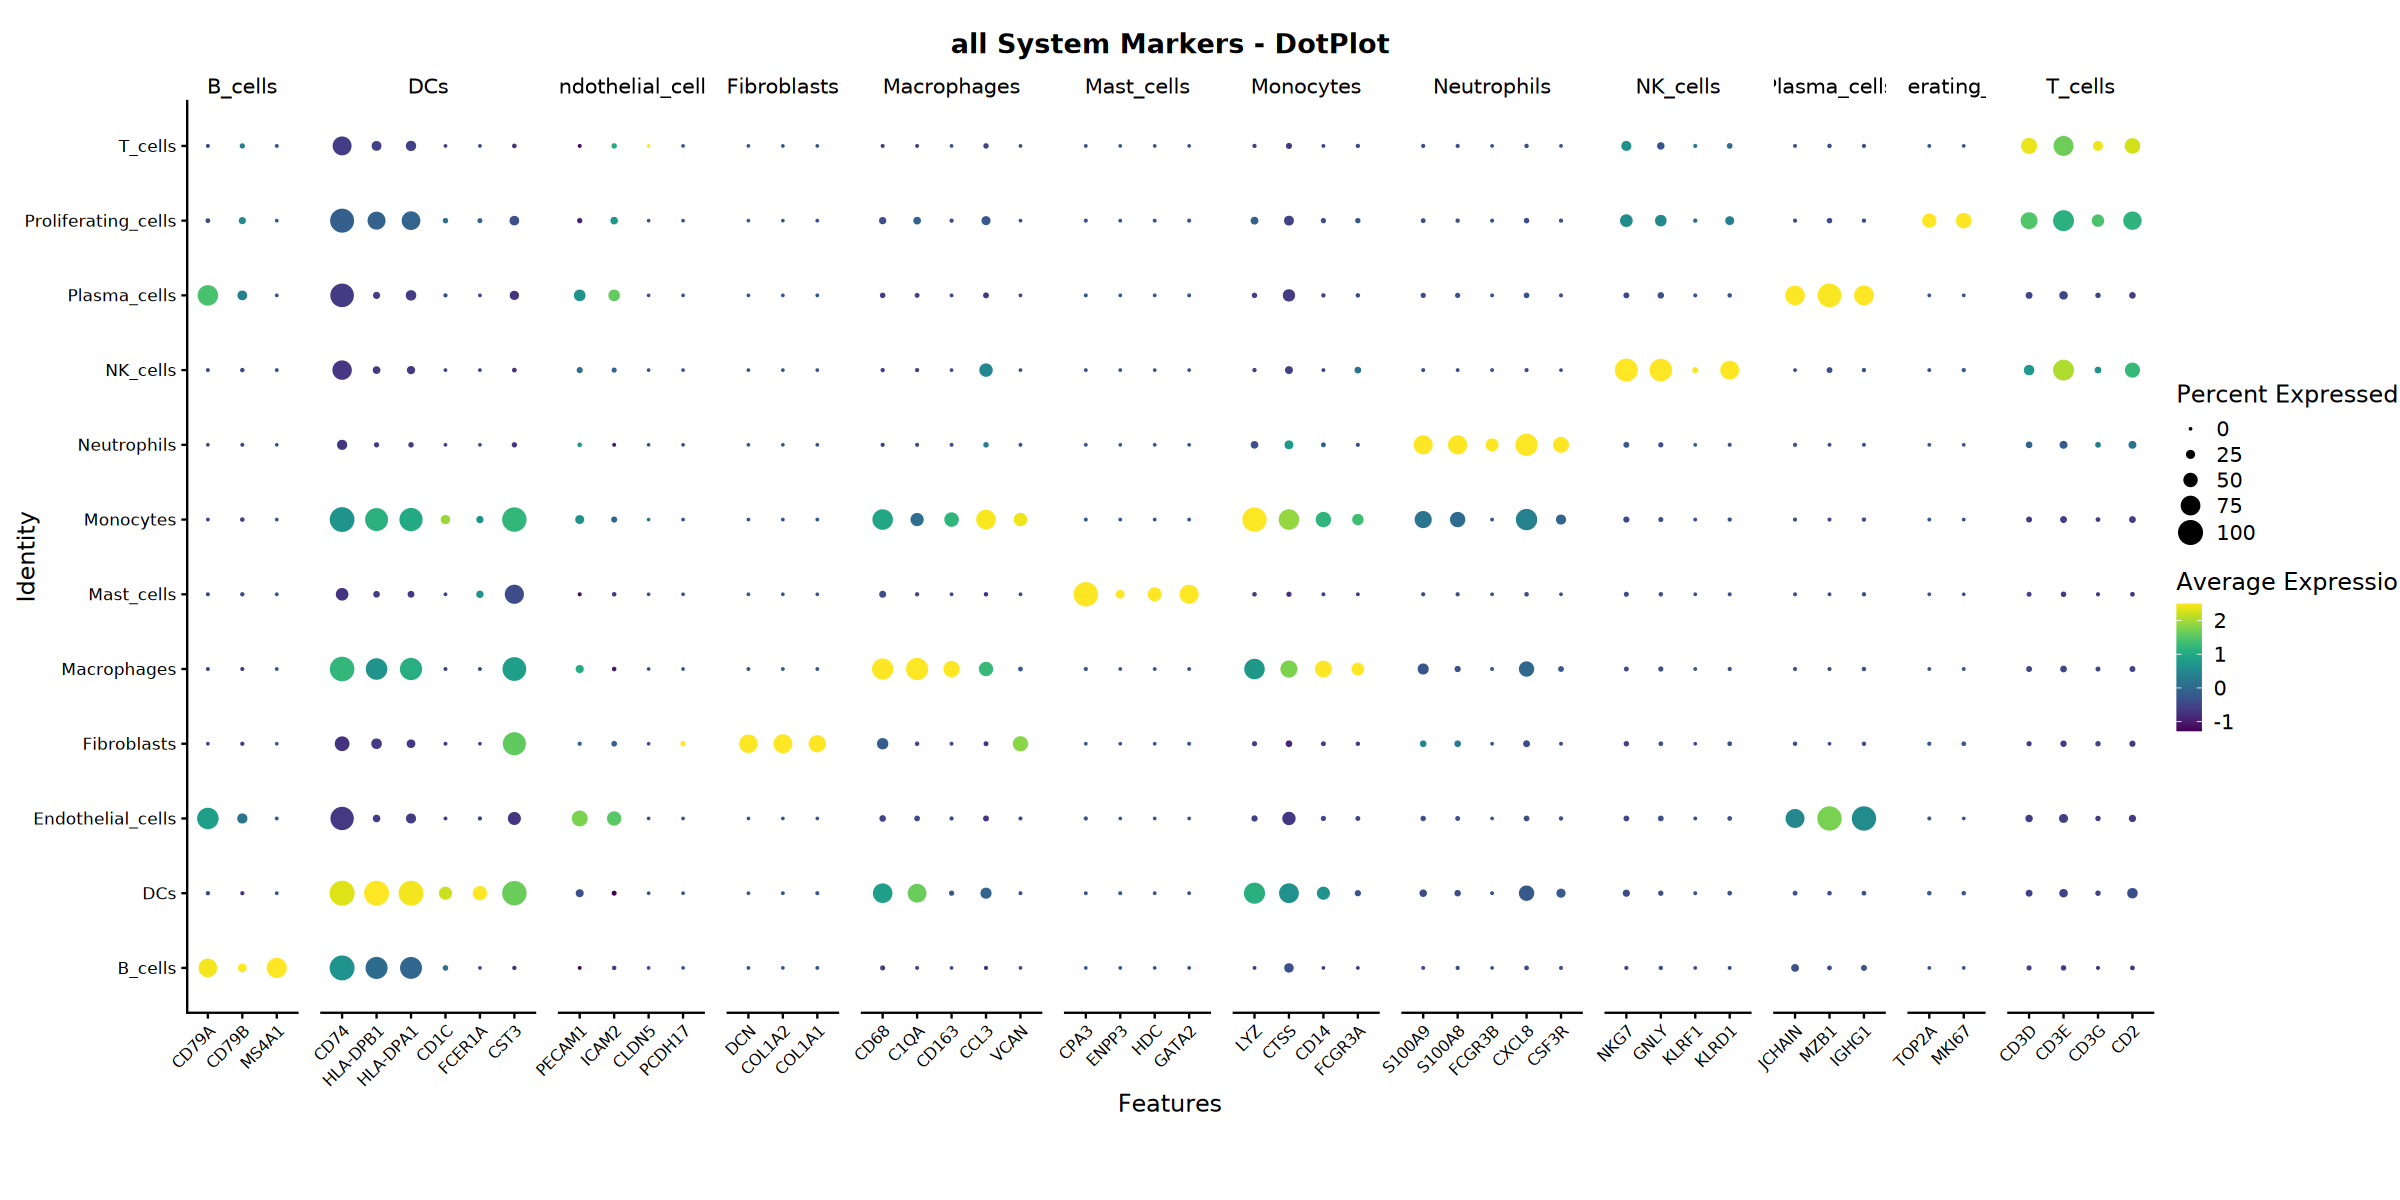
# Run the custom function `analyze_cell_system` to generate various plots for marker genes
if (Final_Cell_Annotation & file.exists(annotated_seurat_path)) {
    cat("Generating marker gene visualizations for each cell system...\n")
    seurat_obj <- analyze_cell_system(
        seurat_obj = seurat_final,
        groups = anno_label,
        markers = cell_system_markers,
        system_name = "all",
        create_heatmap = TRUE,
        create_violin = TRUE,
        create_feature = TRUE,
        create_scoring = TRUE,
        print_plot = TRUE,
        step = "Step4"
    )
}

cat("\n=== Analysis Complete ===\n")
cat("All results saved to:", output_path, "\n")
cat("Total files generated:", length(list.files(output_path)), "\n")=== all System Analysis ===
Found 47/48 marker genes
Creating dotplot with marker and gene set names...n
Warning message in FetchData.Seurat(object = object, vars = features, cells = cells):
“The following requested variables were not found: CDH5”
Scale for colour is already present.
Adding another scale for colour, which will replace the existing scale.
Dotplot saved: Step4_all_dotplot.pdf
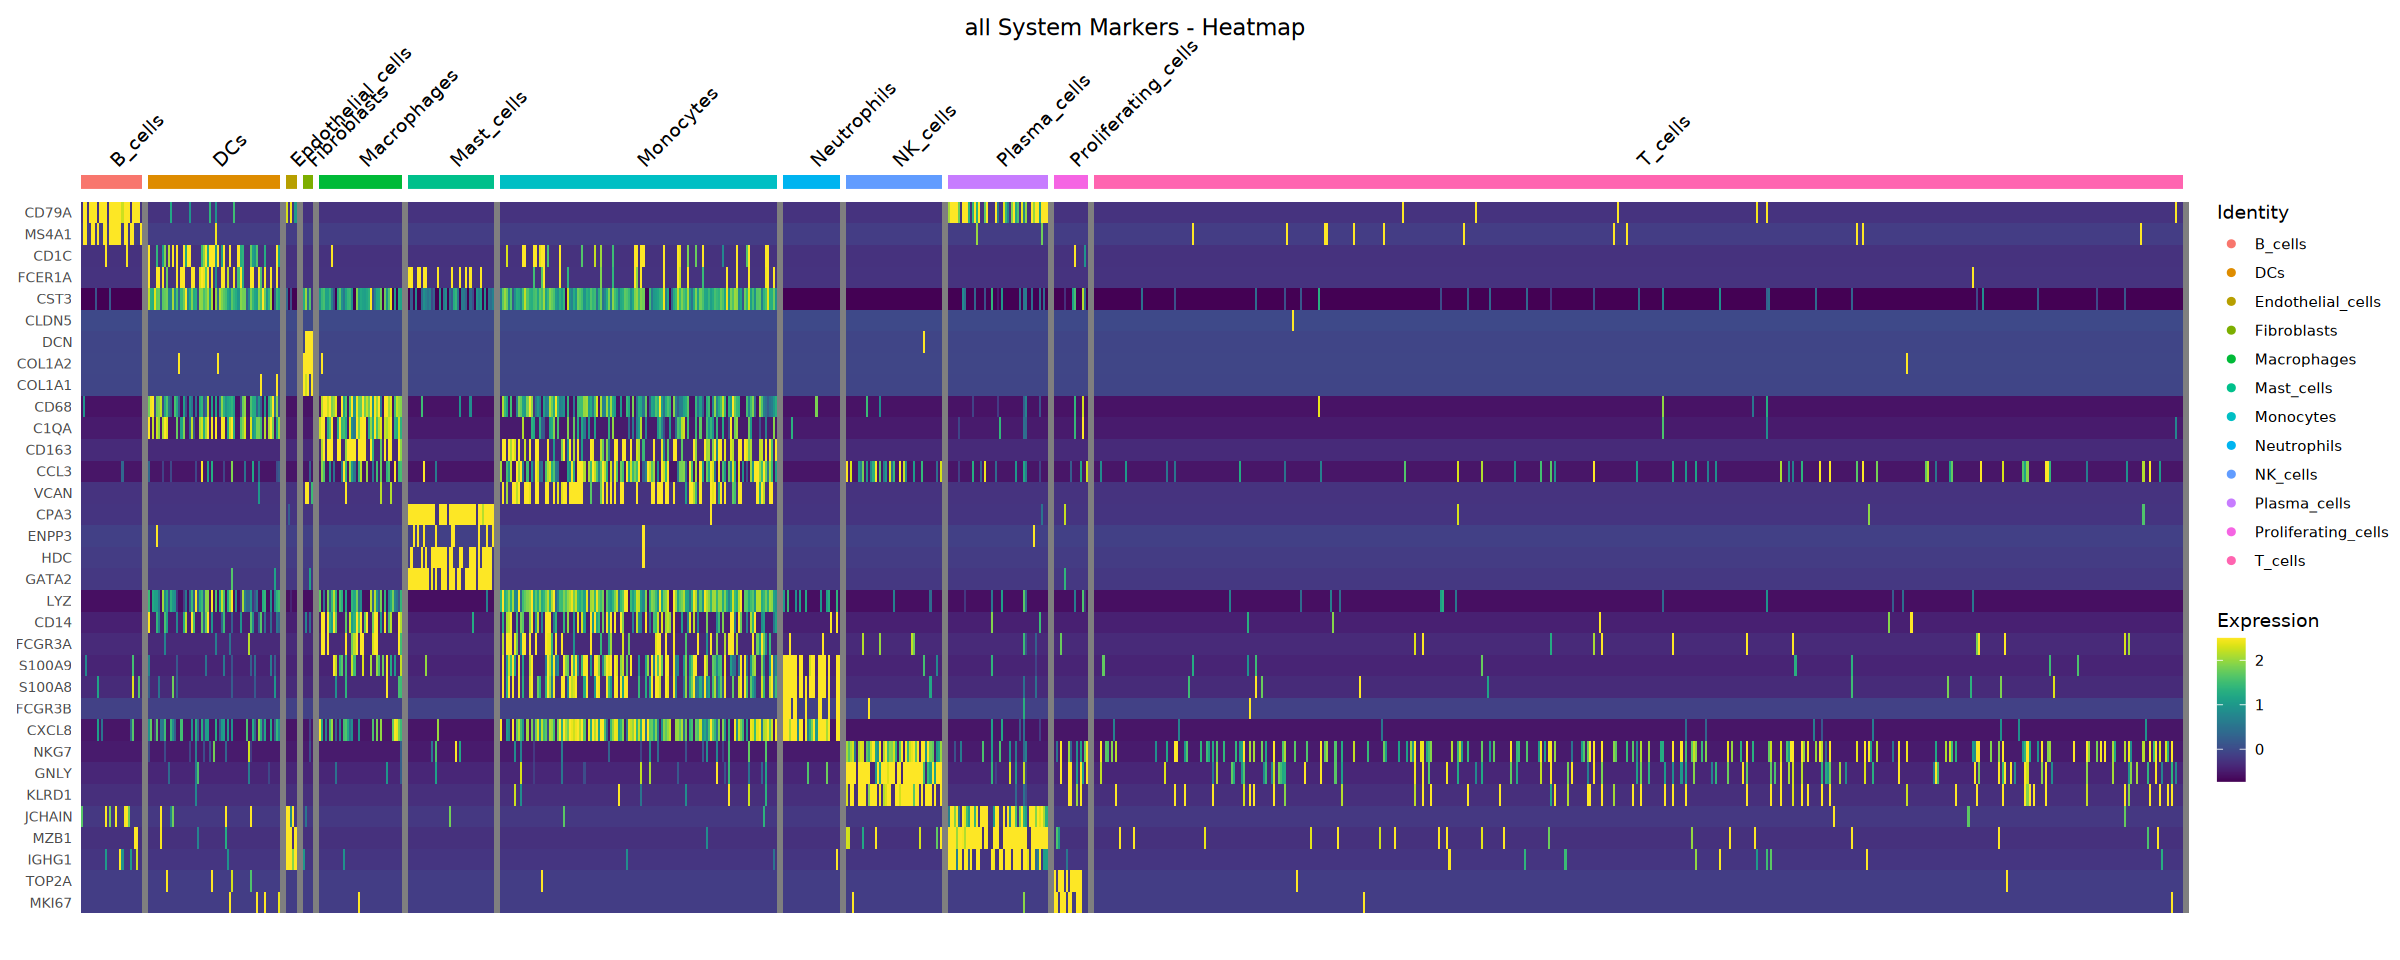
Creating heatmap...
Warning message in DoHeatmap(heatmap_object, features = available_genes, group.by = groups, :
“The following features were omitted as they were not found in the scale.data slot for the RNA assay: CD2, CD3G, CD3E, CD3D, KLRF1, CSF3R, CTSS, PCDH17, ICAM2, PECAM1, HLA-DPA1, HLA-DPB1, CD74, CD79B”
Scale for fill is already present.
Adding another scale for fill, which will replace the existing scale.
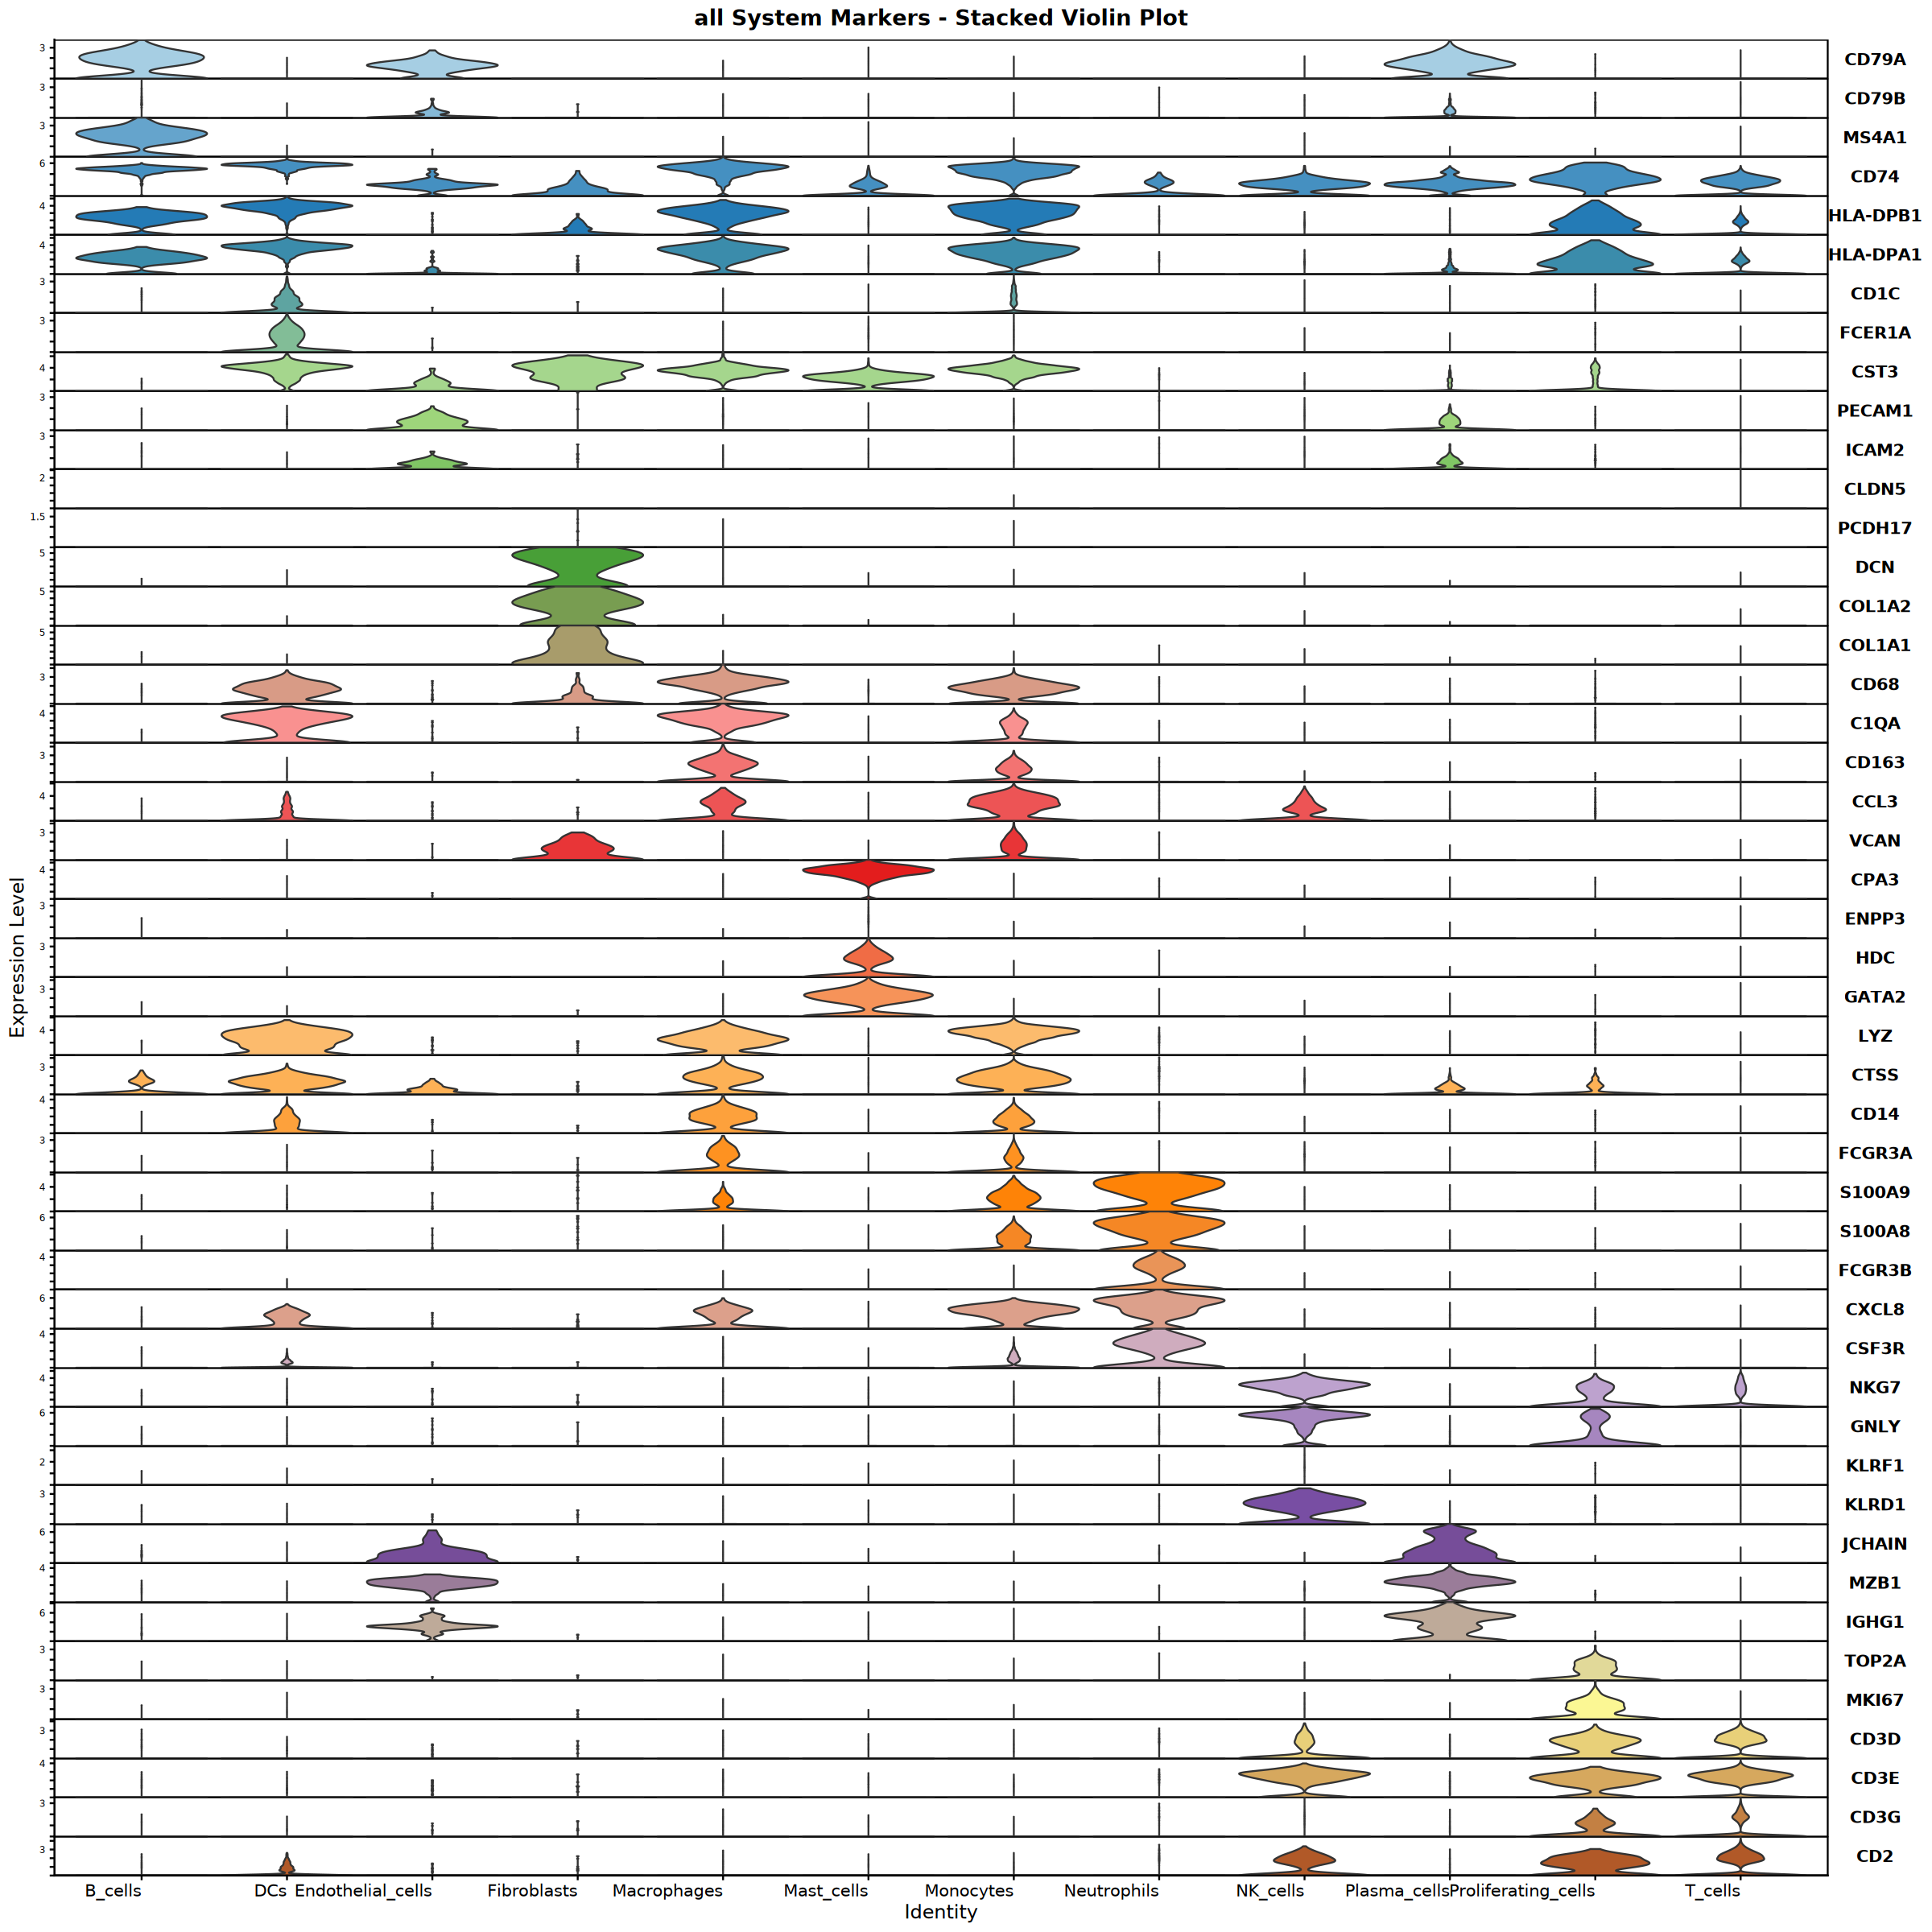
Heatmap saved: Step4_all_heatmap.pdf\nCreating stacked violin plot...
Violin plot saved: Step4_all_violin.pdf
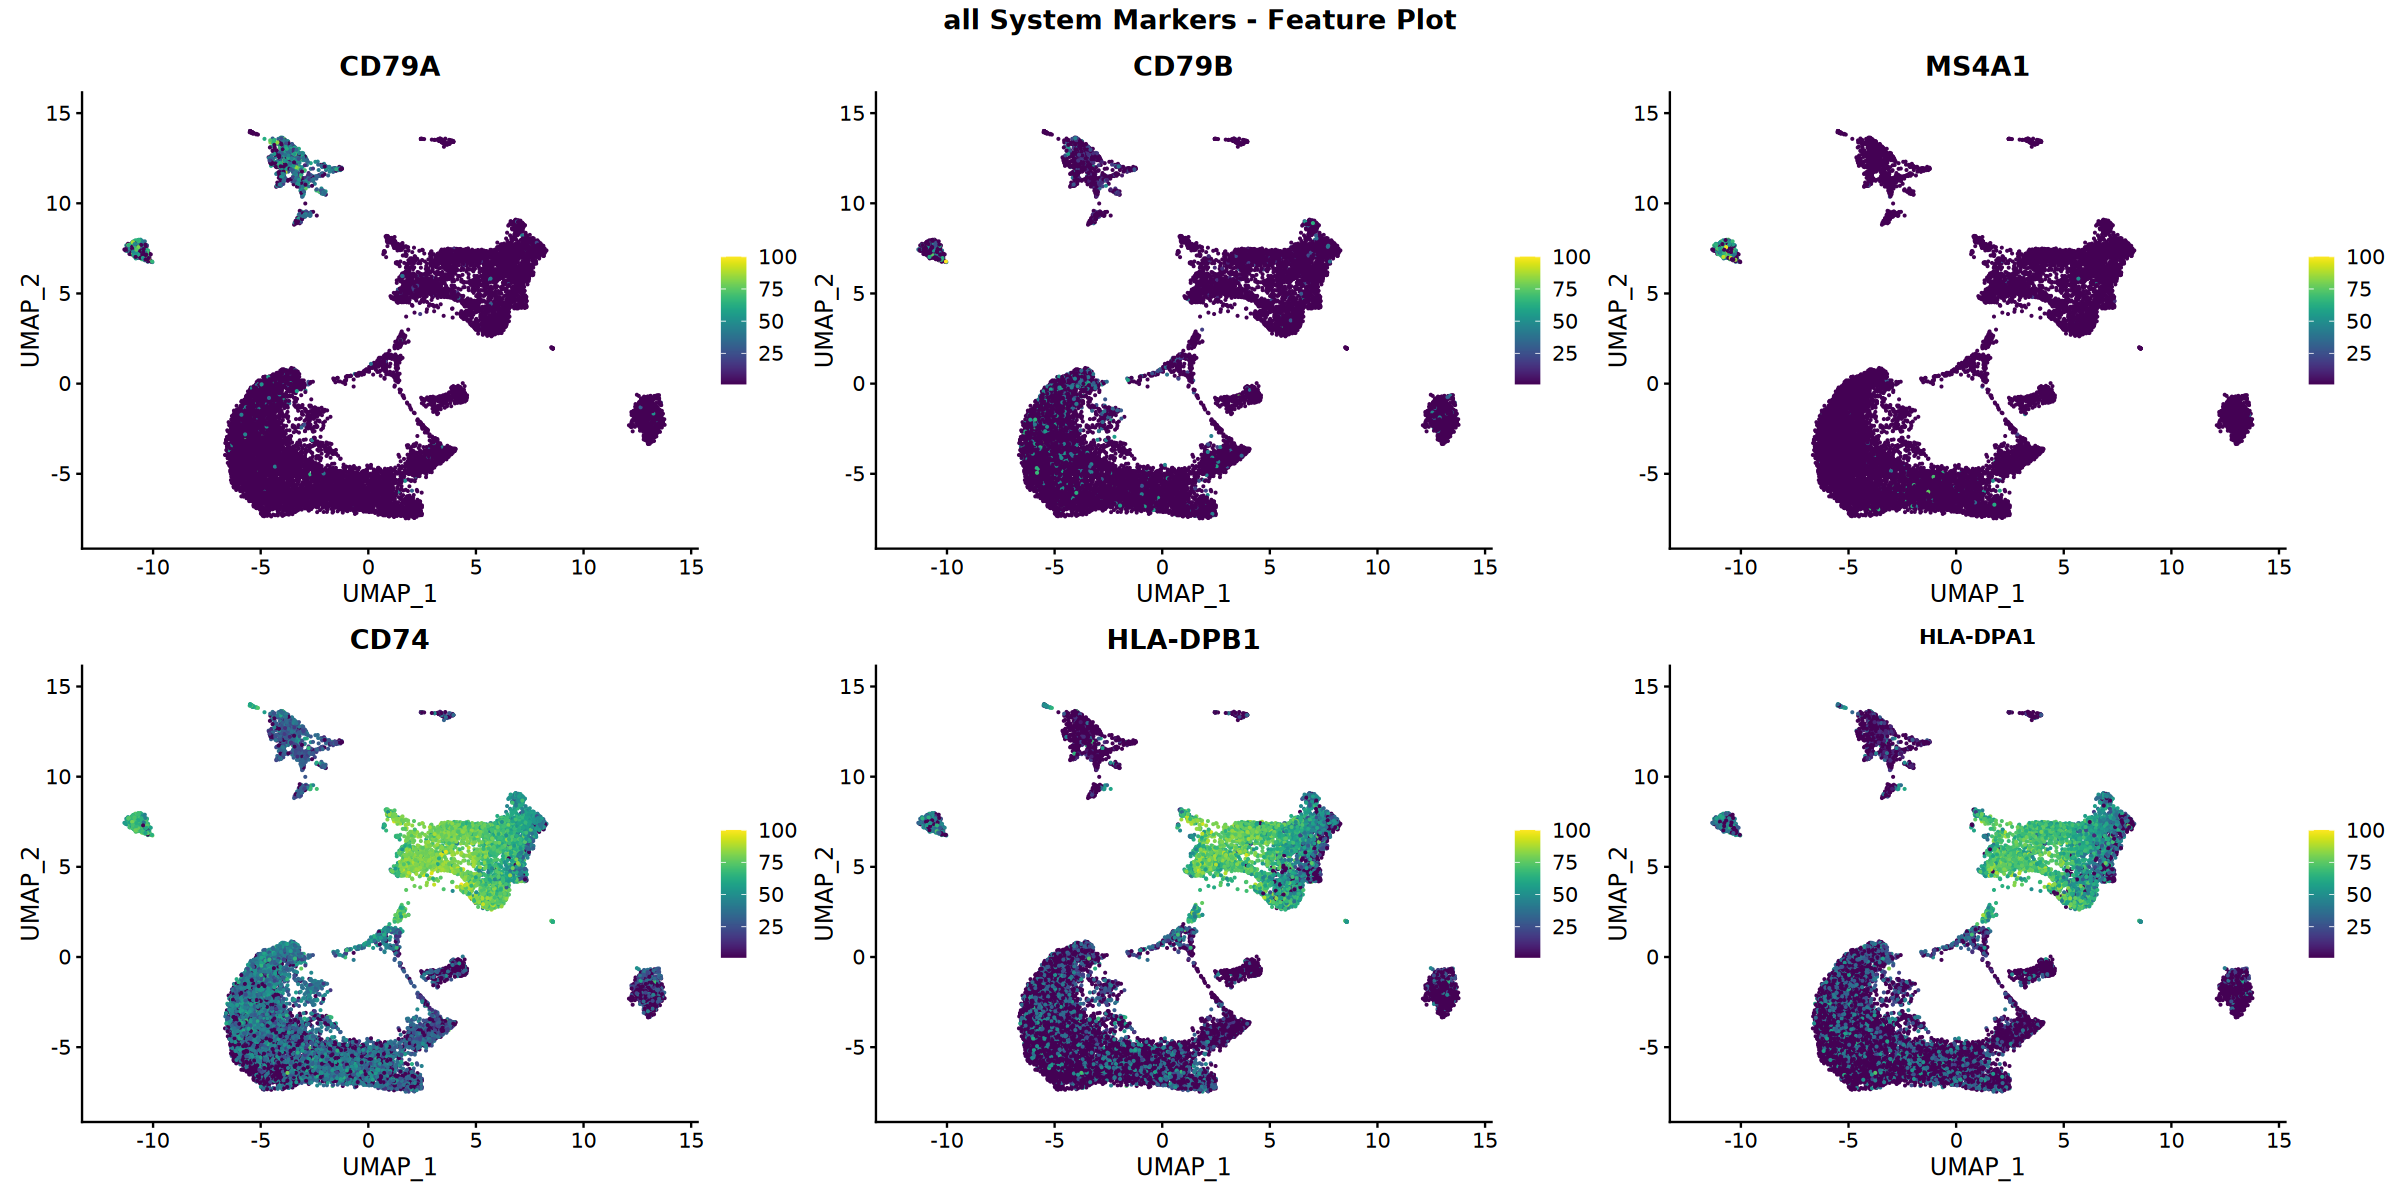
Creating top 6 genes featureplot...
Feature plot saved: Step4_all_top6_featureplot.pdf
Calculating gene set scores...
Added B_cells score
Added DCs score
Added Endothelial_cells score
Added Fibroblasts score
Added Macrophages score
Added Mast_cells score
Added Monocytes score
Added Neutrophils score
Added NK_cells score
Added Plasma_cells score
Added Proliferating_cells score
Added T_cells score
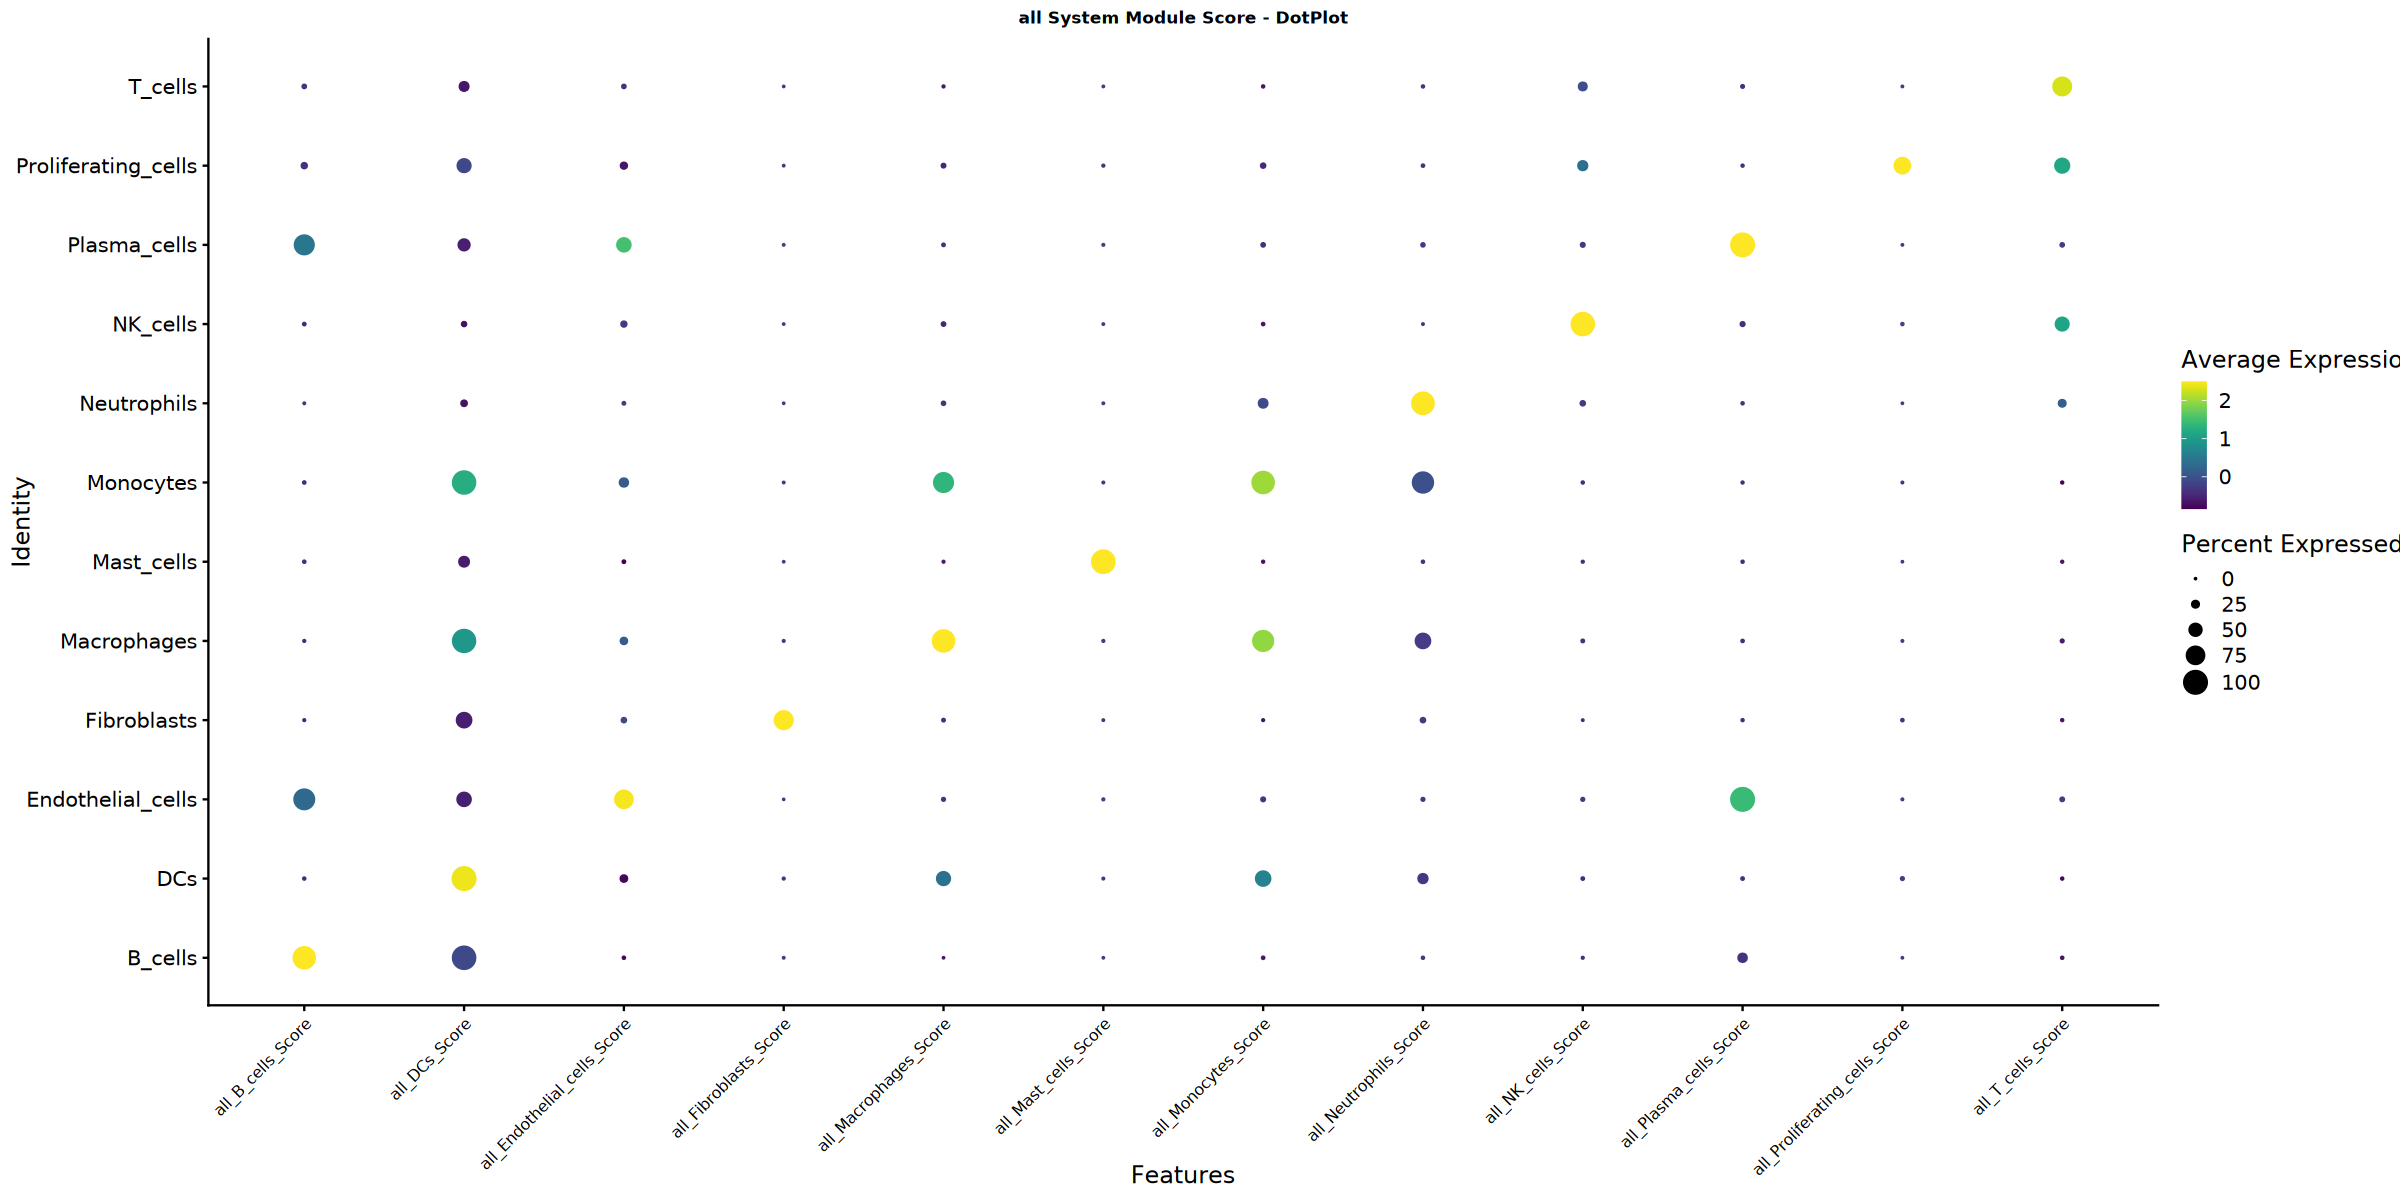
Creating gene set scoring dotplot...
[1m[22mScale for [32mcolour[39m is already present.
Adding another scale for [32mcolour[39m, which will replace the existing scale.
Score dotplot saved: Step4_all_score_dotplot.pdf
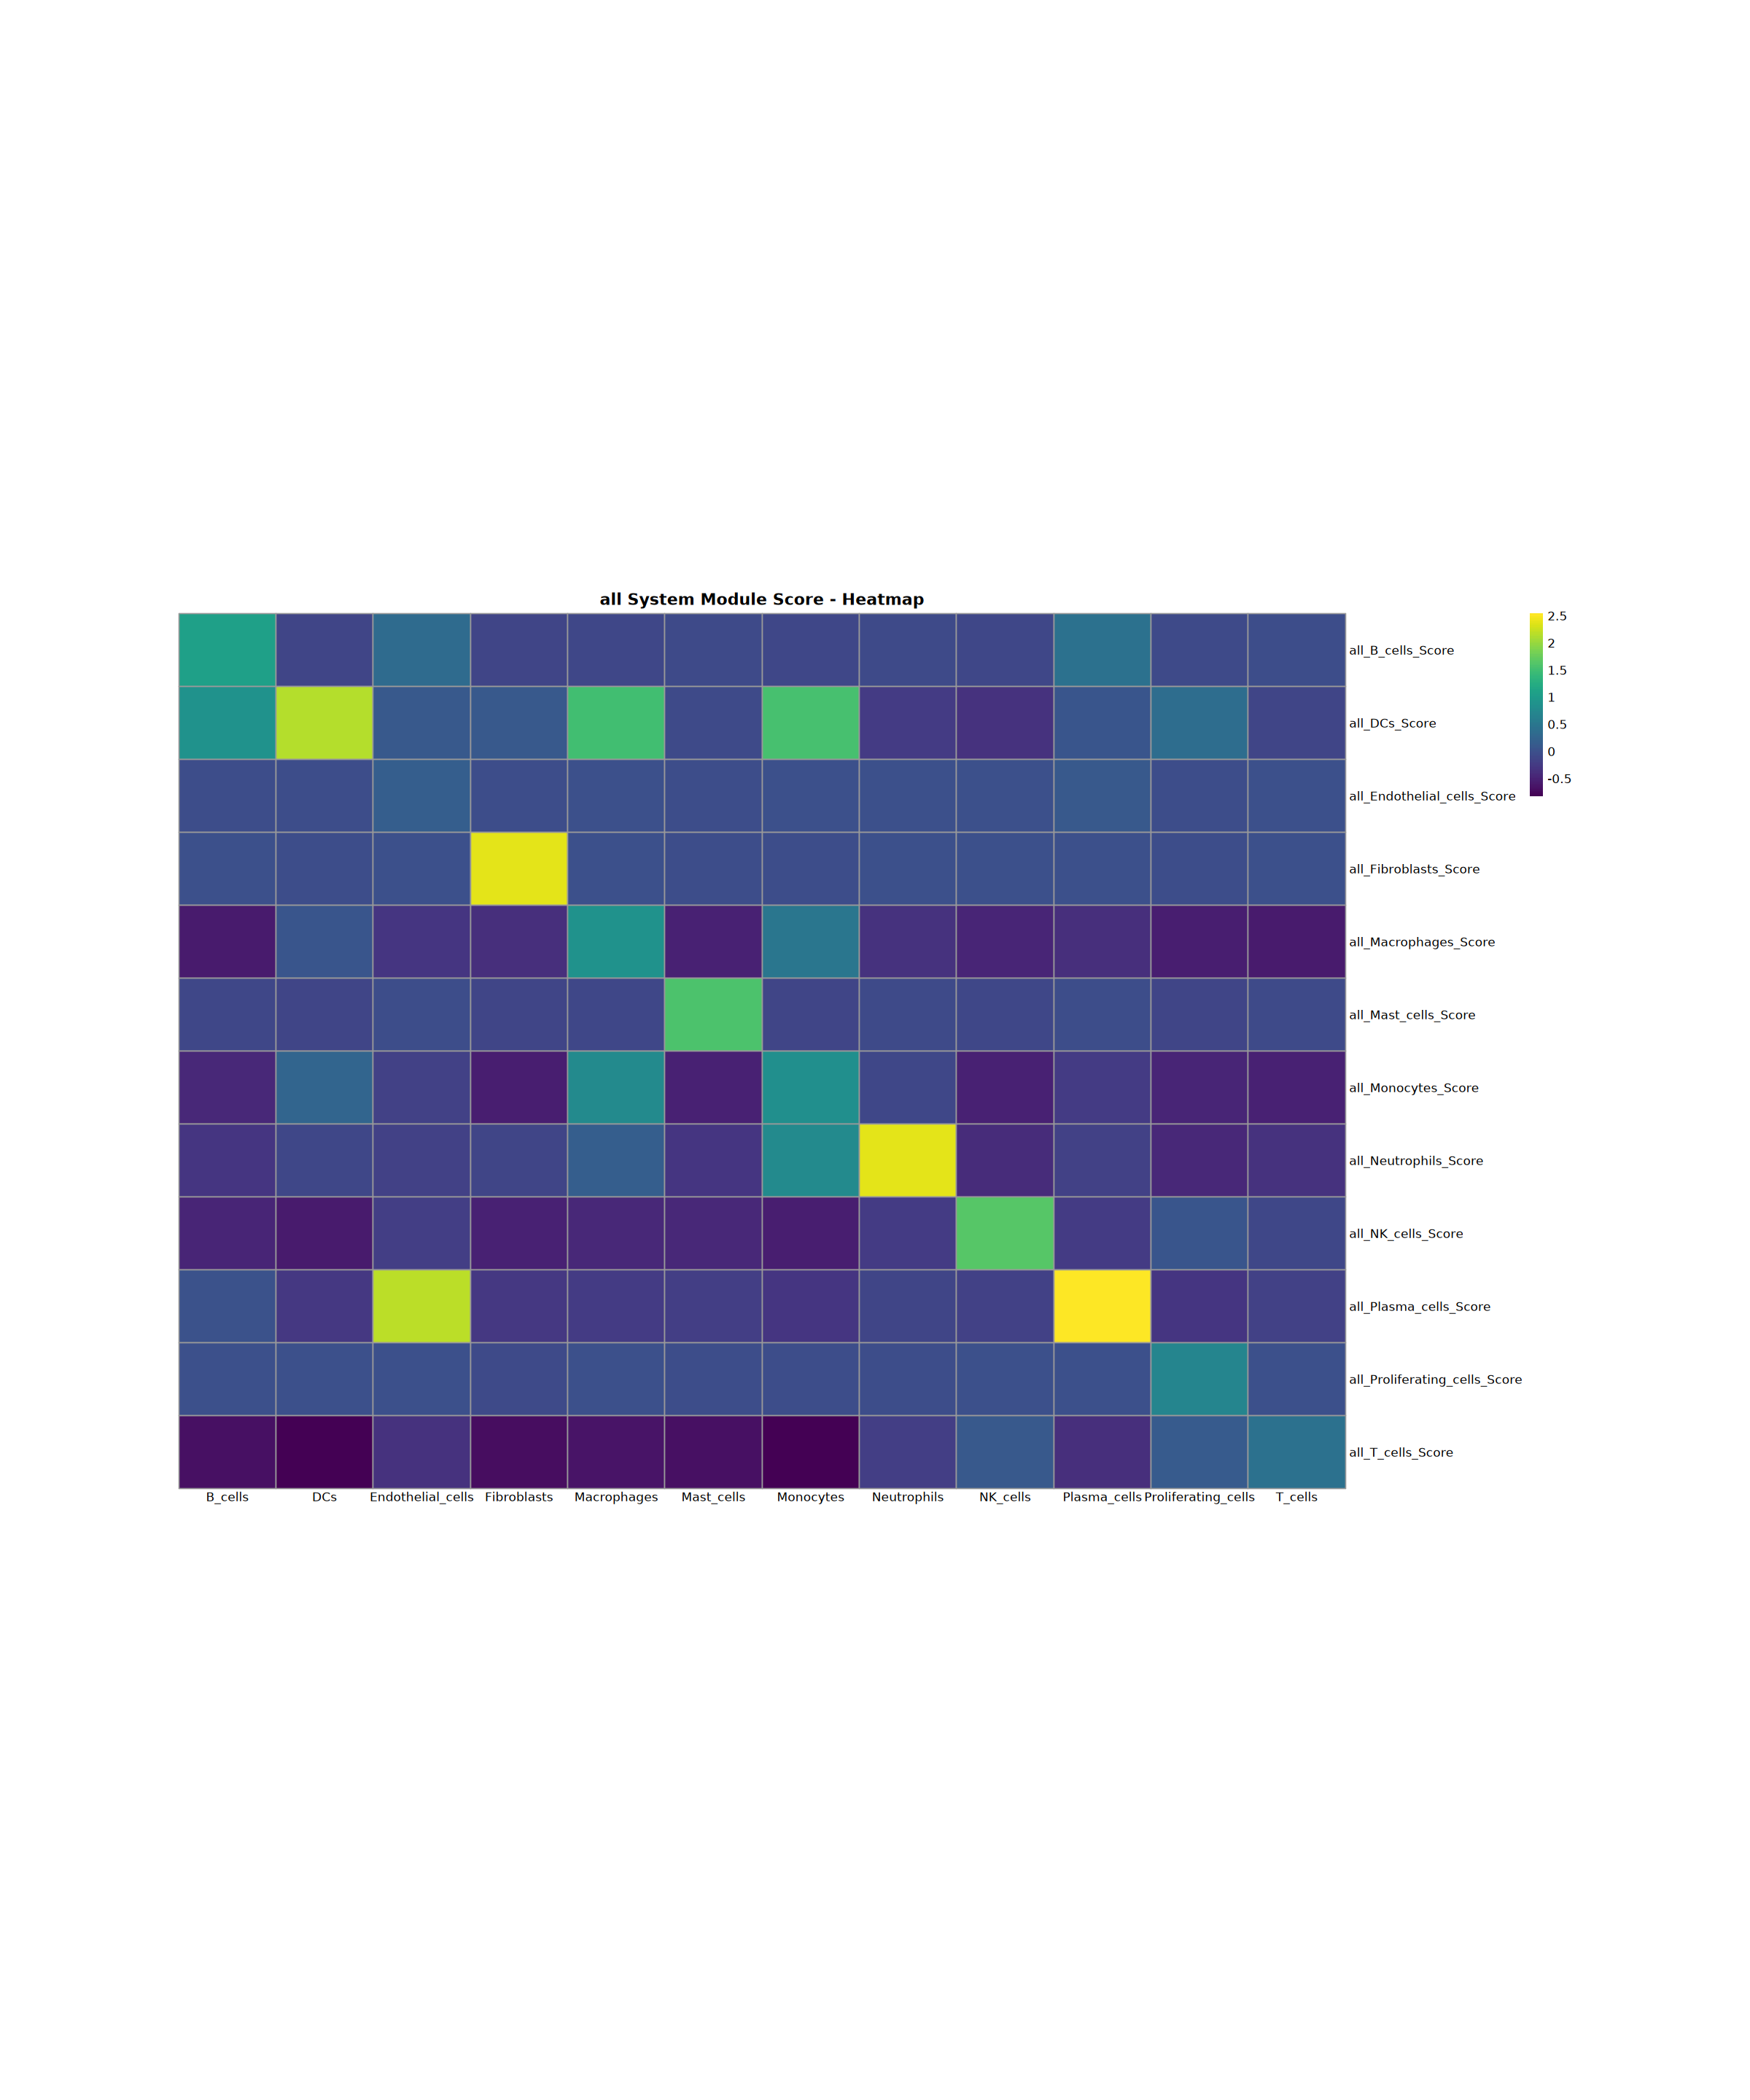
Creating gene set scoring heatmap...
Score heatmap saved: Step4_all_score_heatmap.pdf
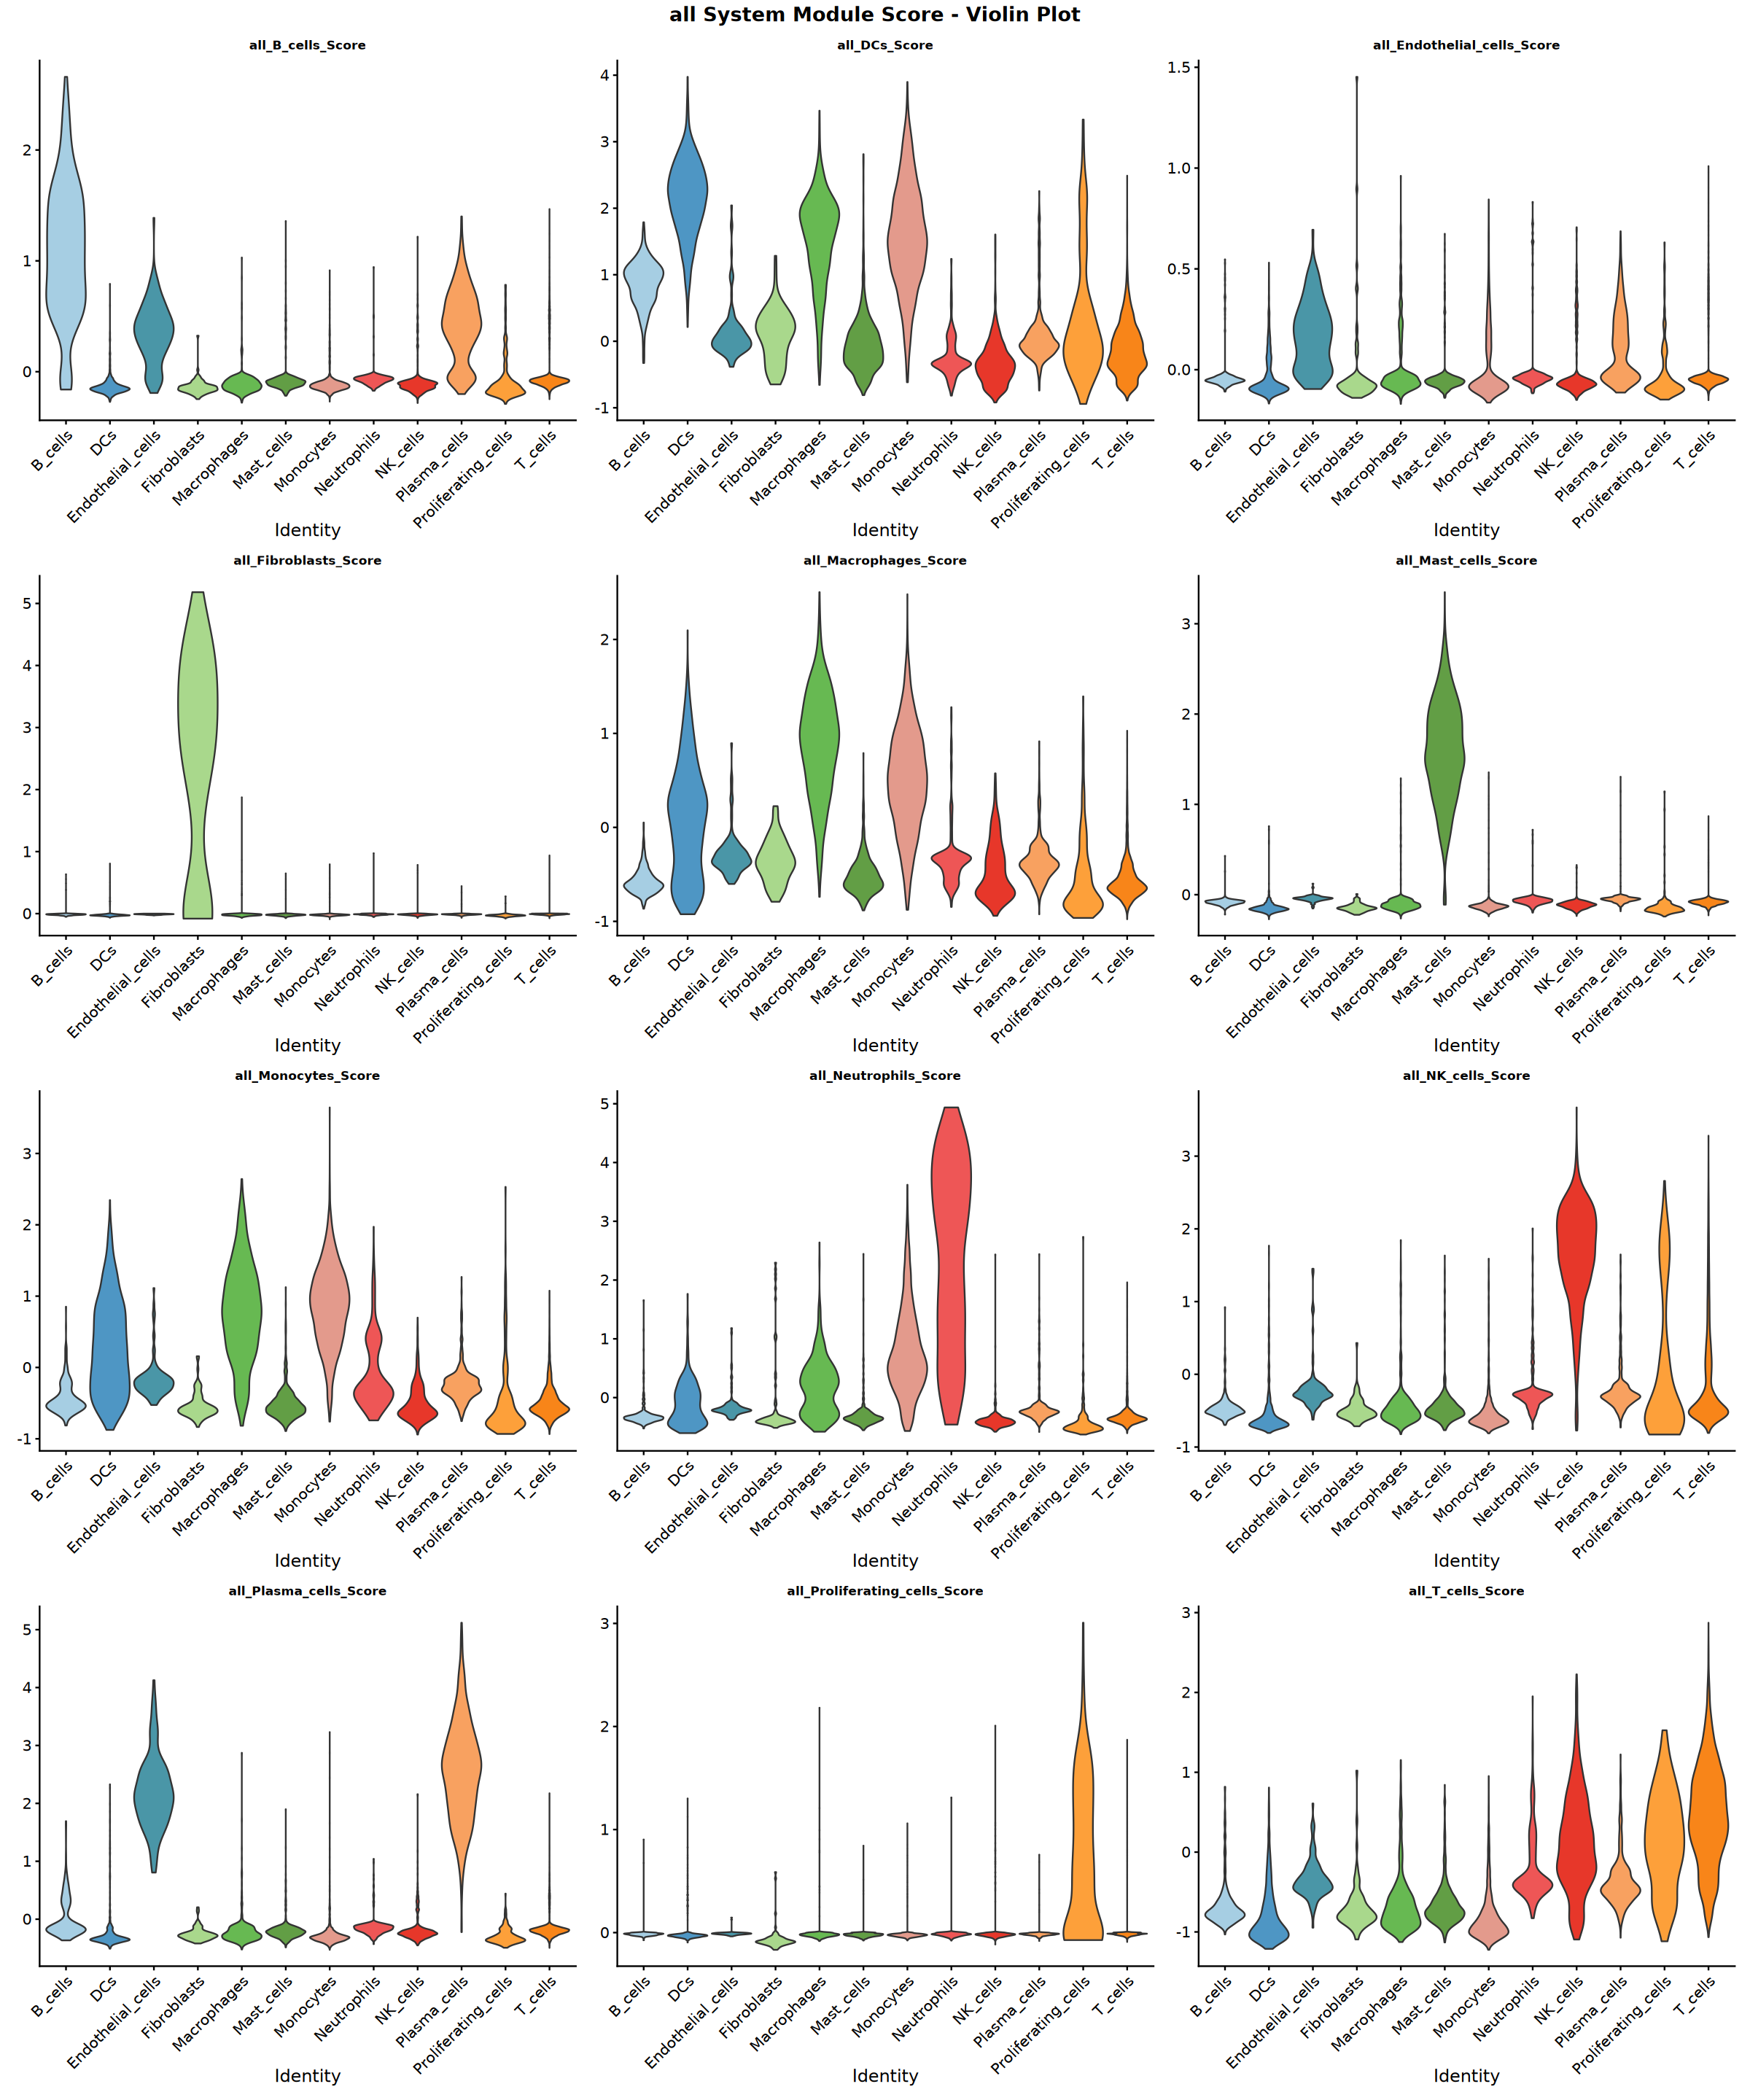
Creating gene set scoring violin plot...
Score violin plot saved: Step4_all_score_violin.pdf
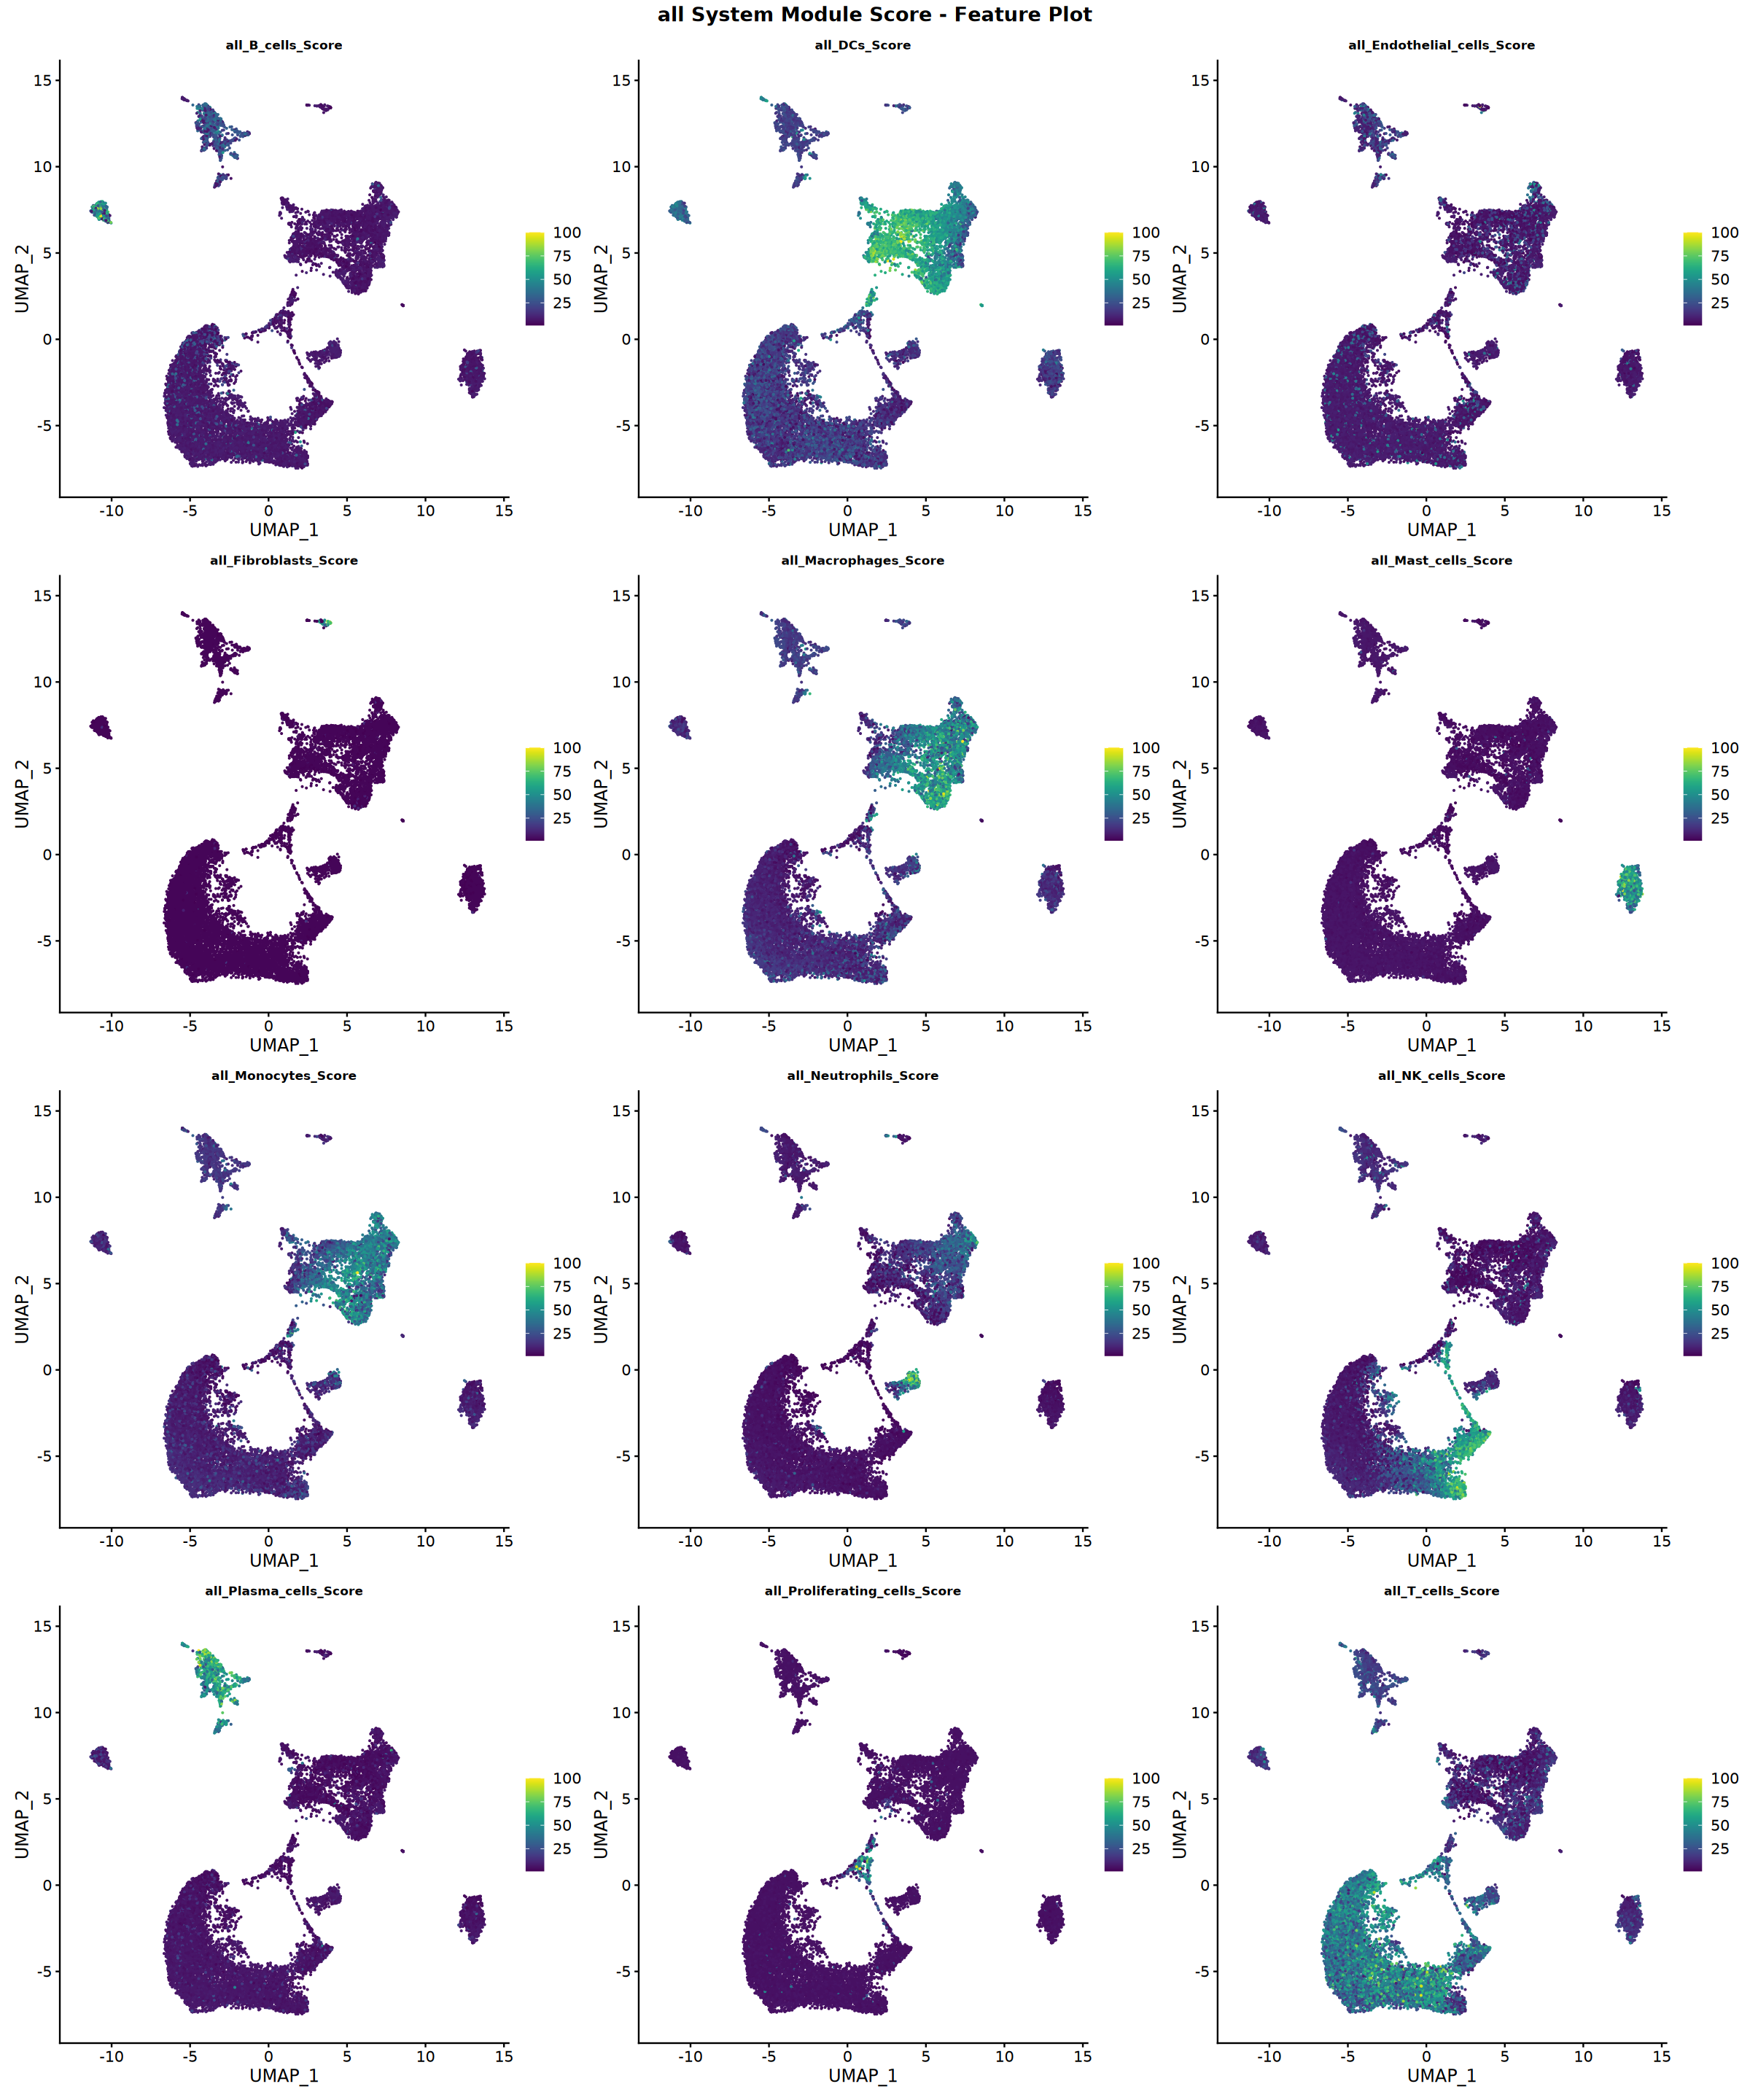
Creating gene set scoring featureplot...
Score feature plot saved: Step4_all_score_featureplot.pdf
all system analysis completed

=== Analysis Complete ===
All results saved to: /home/demo-seekgene-com/workspace/project/demo-seekgene-com/CellAnnotation/result
Total files generated: 39
Template Information
Template Launch Date: August 26, 2025
Last Updated: August 26, 2025
Contact: For questions, issues, or suggestions regarding this tutorial, please contact us through the "智能咨询(Intelligent Consultation)" service.
References
[1] Seurat Package*: https://github.com/satijalab/seurat.
[2] SingleR*: https://github.com/dviraran/SingleR. Liu X., Wu C., Pan L., et al. (2025). SeekSoul Online: A user-friendly bioinformatics platform focused on single-cell multi-omics analysis. The Innovation Life 3:100156. https://doi.org/10.59717/j.xinn-life.2025.100156