Single-Cell Spatial Microenvironment Analysis: Cell Niche Analysis and Clustering Tutorial
Time: 6 min
Words: 1.0k words
Updated: 2026-02-28
Reads: 0 times
Load Analysis Packages
python
import numpy as np
import pandas as pd
import scanpy as sc
import seaborn as sns
from sklearn.neighbors import NearestNeighbors
from sklearn.cluster import MiniBatchKMeans
import matplotlib.pyplot as plt
from matplotlib.pyplot import rc_context
import stlearn as st
output
/PROJ2/FLOAT/jinwen/apps/miniconda3/envs/COMMOT/lib/python3.10/site-packages/stlearn/tools/microenv/cci/het.py:192: NumbaDeprecationWarning: The keyword argument 'nopython=False' was supplied. From Numba 0.59.0 the default is being changed to True and use of 'nopython=False' will raise a warning as the argument will have no effect. See https://numba.readthedocs.io/en/stable/reference/deprecation.html#deprecation-of-object-mode-fall-back-behaviour-when-using-jit for details.
@jit(parallel=True, nopython=False)
@jit(parallel=True, nopython=False)
Read Matrix Data
- Before analysis, convert input.rds into three matrix files for reading
- Before analysis, cell types need to be annotated
python
adata = sc.read_10x_mtx("filtered_feature_bc_matrix/")
spatial = pd.read_csv('filtered_feature_bc_matrix/cell_locations.tsv',sep="\t",index_col=0)
spatial = spatial.loc[:,("x","y")]
selected_rows = spatial.loc[spatial.index.isin(adata.obs_names)]
selected_rows.columns = ["imagecol","imagerow"]
selected_rows = selected_rows.reindex(adata.obs_names)
# Using st.create_stlearn can import expression and spatial location into anndata object; if image import is desired, add image_path parameter. In SeekSpace technology, one pixel size is approximately 0.265385 microns, so scale=0.265385.
a = st.create_stlearn(count=adata.to_df(),spatial=selected_rows,library_id="N1", scale=0.265385,spot_diameter_fullres=10)
cluster_name = "celltype"
celltype = pd.read_csv("../../data/AY1748480899609/meta.tsv",index_col=0,sep = "\t")

celltype = celltype.loc[a.obs.index]
## meta_celltype_colums_name is the column name for cell types in the metadata of the original rds
meta_celltype_colums_name = "CellAnnotation"
a.obs[cluster_name] = celltype[meta_celltype_colums_name]
a.obs[cluster_name] = a.obs[cluster_name].astype('category')
#a = a[a.obs["celltype"].isin(["HSC","Fibroblasts"])]

#a.layers["raw_count"] = a.X
a.layers["counts"] = a.X
sc.pp.normalize_total(a, target_sum=1e4)
sc.pp.log1p(a)
sc.pp.calculate_qc_metrics(a, percent_top=None, log1p=False, inplace=True)- Step 1: Search neighbors using radius
- Step 2: Process neighbor indices (sort by distance + exclude self)
- Step 3: Calculate window sum (handle sparse regions)
- Step 4: Cluster neighborhood types
python
def cell_neighbors(adata,column,radius=20,n_clusters=10):
    spatial_coords = adata.obsm['spatial']
    onehot_encoding = pd.get_dummies(adata.obs[column])
    cluster_cols = adata.obs[column].unique()
    values = onehot_encoding[cluster_cols].values
    nbrs = NearestNeighbors(radius=radius,metric='euclidean').fit(spatial_coords)
    distances,indices = nbrs.radius_neighbors(spatial_coords,return_distance=True)
    sorted_indices = []
    for i in range(len(indices)):
        if len(indices[i]) == 0:
            sorted_indices.append(np.array([]))
            continue # Sort by distance and exclude self
        sorted_order = np.argsort(distances[i])
        neigh_indices = indices[i][sorted_order]
        mask = (neigh_indices != i)
        filtered_indices = neigh_indices[mask]
        sorted_indices.append(filtered_indices)
    def compute_window_sums(sorted_indices,values):
        windows = []
        for idx in range(len(sorted_indices)):
            neighbors = sorted_indices[idx]
            if len(neighbors) == 0: # Handle sparse regions: fill with self type
                window_sum = values[idx] # Self type
            else:
                window_sum = values[neighbors].sum(axis=0)
            # Normalize to proportional distribution
            window_sum_norm = window_sum / (window_sum.sum() + 1e-6) # Prevent division by zero
            windows.append(window_sum_norm)
        return np.array(windows)
    windows = compute_window_sums(sorted_indices,values)

    km = MiniBatchKMeans(n_clusters=n_clusters, random_state=0)
    labels = km.fit_predict(windows)
    adata.obs[f'CNs_{n_clusters}'] = [f'CN{i}' for i in labels] # Visualize Fold Change
    k_centroids = km.cluster_centers_
    tissue_avgs = values.mean(axis=0)
    fc = np.log2((k_centroids + 1e-6) / (tissue_avgs + 1e-6)) # Avoid division by zero
    fc_df = pd.DataFrame(fc,columns=cluster_cols)
    fc_df.index = [f'CN{i}' for i in range(n_clusters)]
    sns.set_style("white")
    g = sns.clustermap(fc_df,vmin=-2,vmax=2,cmap="vlag",row_cluster=False,col_cluster=True,linewidths=0.5,figsize=(6,6))
    g.ax_heatmap.tick_params(right=False,bottom=False)

    return adata

cell_neighbors(adata=a,column="celltype")
output
AnnData object with n_obs × n_vars = 20820 × 34506
obs: 'imagecol', 'imagerow', 'celltype', 'n_genes_by_counts', 'total_counts', 'CNs_10'
var: 'n_cells_by_counts', 'mean_counts', 'pct_dropout_by_counts', 'total_counts'
uns: 'spatial', 'log1p'
obsm: 'spatial'
layers: 'counts'
obs: 'imagecol', 'imagerow', 'celltype', 'n_genes_by_counts', 'total_counts', 'CNs_10'
var: 'n_cells_by_counts', 'mean_counts', 'pct_dropout_by_counts', 'total_counts'
uns: 'spatial', 'log1p'
obsm: 'spatial'
layers: 'counts'
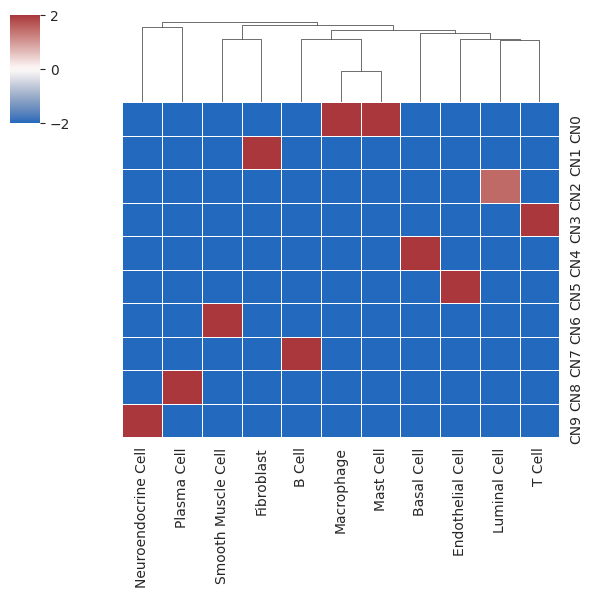
- Heatmap representing enrichment of cell types in different cell niches
- X-axis represents cell types; Y-axis represents clustered cell niches; color represents enrichment level
python
aoutput
AnnData object with n_obs × n_vars = 20820 × 34506
obs: 'imagecol', 'imagerow', 'celltype', 'n_genes_by_counts', 'total_counts', 'CNs_10'
var: 'n_cells_by_counts', 'mean_counts', 'pct_dropout_by_counts', 'total_counts'
uns: 'spatial', 'log1p'
obsm: 'spatial'
layers: 'counts'
obs: 'imagecol', 'imagerow', 'celltype', 'n_genes_by_counts', 'total_counts', 'CNs_10'
var: 'n_cells_by_counts', 'mean_counts', 'pct_dropout_by_counts', 'total_counts'
uns: 'spatial', 'log1p'
obsm: 'spatial'
layers: 'counts'
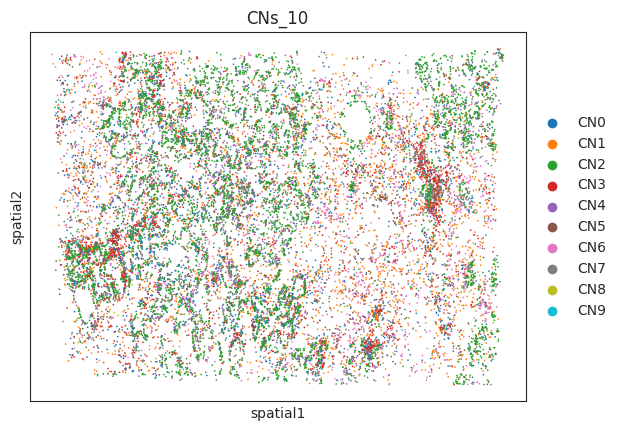
- Visualization of cell niches in space
python
sc.pl.embedding(a,"spatial",color=["CNs_10"])output
/PROJ2/FLOAT/jinwen/apps/miniconda3/envs/COMMOT/lib/python3.10/site-packages/scanpy/plotting/_tools/scatterplots.py:1235: FutureWarning: The default value of 'ignore' for the \`na_action\` parameter in pandas.Categorical.map is deprecated and will be changed to 'None' in a future version. Please set na_action to the desired value to avoid seeing this warning
color_vector = pd.Categorical(values.map(color_map))
color_vector = pd.Categorical(values.map(color_map))