ATAC + RNA multi-omics Monocle3 pseudotime and chromatin dynamics
Document Overview
ATAC_Monocle3 uses the Monocle3 tool to infer differentiation trajectories based on scATAC-seq single-omics data. Pseudotime analysis is used to reconstruct trajectories of cell development or differentiation processes, revealing dynamic changes in chromatin accessibility. Monocle3 calculates the distance from each cell to the starting point by selecting root cells, obtaining pseudotime to order the differentiation process of cells. In scATAC-seq analysis, pseudotime can intuitively reflect changes in chromatin accessibility and the dynamic processes of gene regulatory networks.
Significance of Pseudotime Analysis
Cell Differentiation and Epigenetic Dynamics
Cell differentiation is a continuous process involving progressive changes in epigenetic states. At single-cell resolution, we can observe:
- Cells at different differentiation stages coexist in the sample
- Chromatin accessibility patterns undergo systematic changes with the differentiation process
- The open/closed states of key Regulatory Elements (Peaks) are closely related to cell fate determination
How Does Pseudotime Analysis Help Resolve Epigenetic Dynamics
- Trajectory reconstruction: Through dimensionality reduction and graph learning, Monocle3 can identify continuous paths of cells in epigenetic space, connecting discrete cell states into directed developmental trajectories.
- Pseudotime inference: Based on specified starting cells (root cells), Monocle3 calculates the shortest path distance from each cell along the trajectory to the starting point, assigning each cell a pseudotime value that reflects its relative position in the differentiation process.
- Dynamic change identification: By comparing chromatin accessibility patterns at different pseudotime points, regulatory elements that dynamically open or close during differentiation can be identified, revealing temporal activation patterns of key transcription factor binding sites.
- Multi-omics integration: Pseudotime analysis results can be integrated with scRNA-seq data to reveal temporal associations between chromatin accessibility changes and gene expression changes, constructing dynamic gene regulatory networks.
TIP
scRNA-seq vs. scATAC-seq: How to Choose the Data Type for Pseudotime Analysis?
Single-cell multi-omics simultaneously obtains both scRNA-seq and scATAC-seq data types, both of which can be used for pseudotime analysis, though they reflect different biological levels:
- scRNA-seq: Mainly reflects dynamic changes at the gene expression level, more suitable for characterizing cell function and phenotypic transitions—focusing on the "result" perspective.
- scATAC-seq: Reveals temporal dynamics of chromatin accessibility. Its changes often precede transcription, providing earlier hints of key regulatory events than expression, suitable for mining regulatory mechanisms and fate determination-related nodes—focusing on the "cause" perspective.
Recommendations:
- Prefer gene expression/cell function change analysis → Recommend scRNA-seq
- Focus on epigenetic regulation or early developmental events → Recommend scATAC-seq
Synchronously analyzing and integrating pseudotime from both data types helps more comprehensively reveal cell developmental timing and regulatory mechanisms.
Implementation of Monocle3 Pseudotime Analysis on scATAC-seq Data
Monocle3's pseudotime analysis of scATAC-seq data mainly relies on extensions from the Cicero package. To address the extreme sparsity of single-cell chromatin accessibility data, Monocle3 uses LSI (Latent Semantic Indexing) for preprocessing, which is a core step in scATAC-seq analysis.
# Convert Seurat object to Monocle3 CDS object
library(SeuratWrappers)
cds <- as.cell_data_set(obj)

# Cell clustering
cds <- cluster_cells(cds, reduction_method = "UMAP")

# Trajectory learning
cds <- learn_graph(cds, use_partition = TRUE)

# Calculate pseudotime, specify root cells as trajectory starting point
# If root_cells is not specified, an interactive interface will be launched for selection
cds <- order_cells(cds, reduction_method = "UMAP", root_cells = root_cell_ids)

# Pseudotime trajectory visualization
plot_cells(cds, color_cells_by = "pseudotime", show_trajectory_graph = TRUE)
Key Parameter Details and Optimization Recommendations
- reduction_method: Specifies the dimensionality reduction method. It is recommended to use the UMAP dimensionality reduction result corresponding to ATAC data, and ensure its name is "UMAP" (currently Monocle3's
cluster_cellsonly supports UMAP format, otherwise it will error). - use_partition = TRUE: Whether to consider cell partitions. Enabling (TRUE) can be used to resolve cases with multiple independent developmental trajectories, helping to sort out complex differentiation paths; if only focusing on a single path, it can be set to FALSE.
- root_cells: Sets the starting cells for trajectory analysis, requires filling in one or more root cell IDs. Usually select cell types at developmental starting points (such as stem cells, progenitor cells). Reasonable setting of root cells helps ensure the biological significance of pseudotime direction.
Pseudotime Value Extraction
After analysis, pseudotime values can be written to the Seurat object for subsequent analysis:
# Add pseudotime information to Seurat object
obj <- AddMetaData(
  object = obj,
  metadata = cds@principal_graph_aux@listData$UMAP$pseudotime,
  col.name = "Pseudotime"
)

# Visualize pseudotime distribution
FeaturePlot(obj, "Pseudotime", pt.size = 0.1) +
  scale_color_viridis_c()
Pseudotime Analysis Results Display
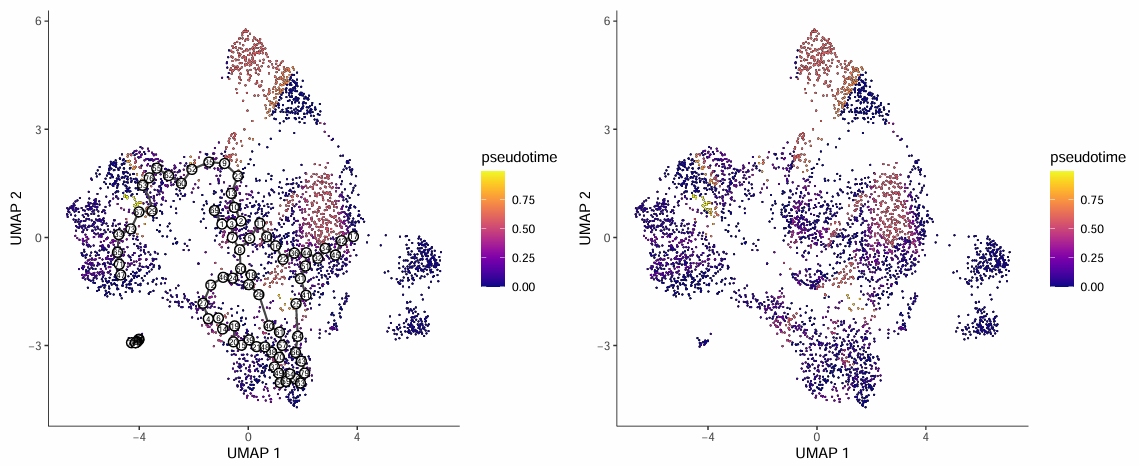
Pseudotime Trajectory Plot
The pseudotime trajectory plot displays the distribution of cells in UMAP dimensionality reduction space, colored according to pseudotime values:
- Each point in the figure represents a cell, and black lines represent trajectory branch paths inferred from pseudotime.
- Darker cell point colors represent cells closer to the developmental starting point; brighter colors represent cells at the developmental endpoint.
- White circles with numbers in the figure represent root (starting) nodes of the trajectory.
- Outlier cells not in the same partition as root cells are not calculated for pseudotime and are displayed in gray.
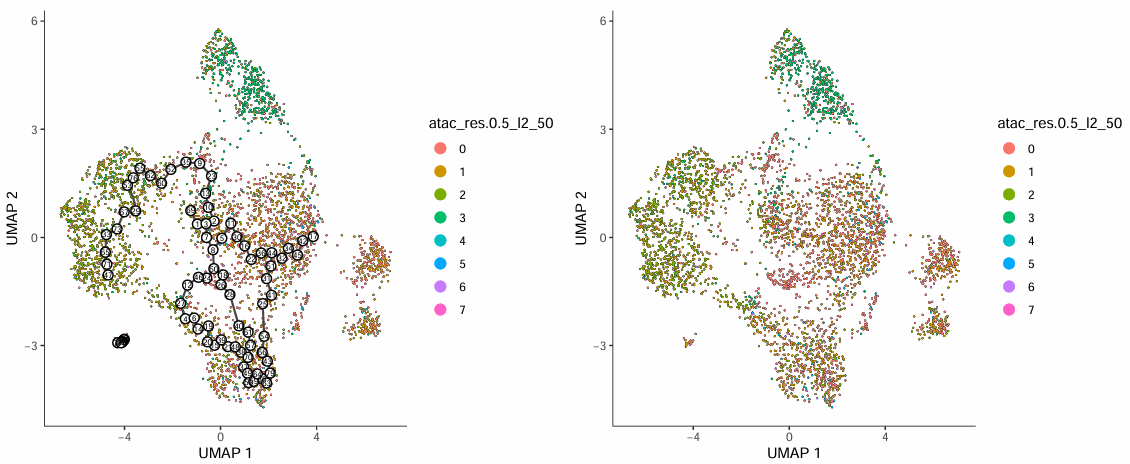
Cell Type Trajectory Plot
This plot displays the distribution pattern of pseudotime values in UMAP space:
- Each point in the figure represents a cell, different colors identify different cell populations, and black lines represent trajectory branch paths obtained from analysis.
- Numbers in black circles represent branch nodes of the trajectory, representing bifurcation positions of differentiation directions (analogous to tree branches); gray circles represent terminal differentiation states, corresponding to final outcomes of cell fate (similar to leaves).
- Numbers within circles are randomly assigned and do not represent developmental order; differentiation directions can be determined in combination with pseudotime values.
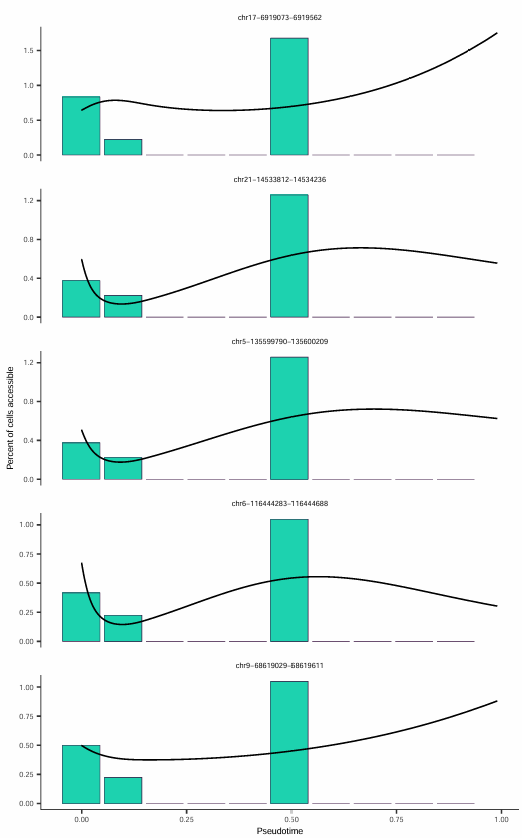
Accessibility Changes Along Pseudotime
Five Sites with Most Significant Accessibility Increase Over Time
For peaks of interest, their accessibility changes along pseudotime can be plotted:
This figure displays the five chromatin regions with the most significant accessibility increase on the pseudotime axis, with each subplot representing a chromatin accessibility site.
The x-axis represents pseudotime progression, and the y-axis represents the accessibility level of that site. The black curve is a smooth fitted line, intuitively displaying the overall trend of accessibility changes along pseudotime.
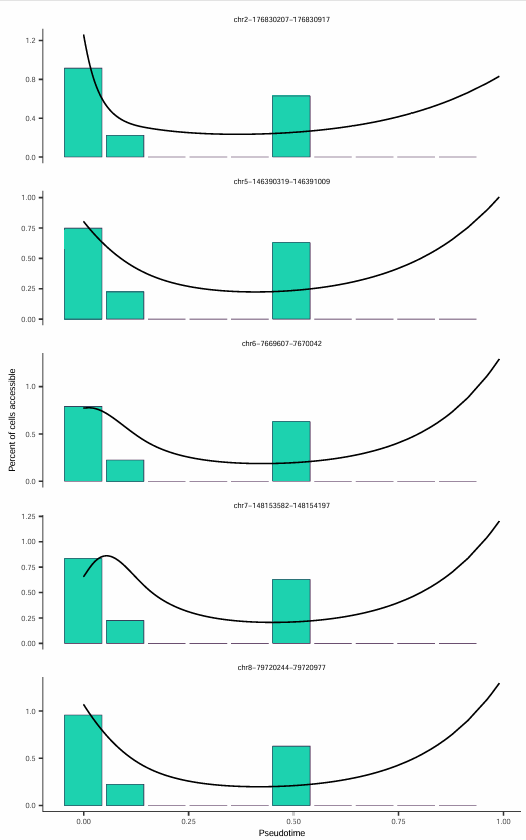
Five Sites with Most Significant Accessibility Decrease Over Time
Through Differential Accessibility Analysis, Peaks that significantly change during pseudotime can be identified:
This figure displays the five chromatin regions with the most significant accessibility decrease on the pseudotime axis, with each subplot representing a chromatin accessibility site.
The x-axis represents pseudotime progression, the y-axis represents the accessibility level of that site, and the black curve is a fitted smooth line showing the overall trend of changes along pseudotime.
Frequently Asked Questions
Q1: How to select appropriate root cells?
A: Selecting root cells is a key step in pseudotime analysis. Recommendations:
- Biological prior knowledge: Select starting cell types based on known biological knowledge (such as hematopoietic stem cells, progenitor cells, etc.)
- Trajectory starting point identification: In UMAP plots, select cell populations located at the starting points of trajectory branches
- Interactive selection: If the
root_cellsparameter is not specified, Monocle3 will launch an interactive interface, allowing users to manually select starting cells - Multi-trajectory analysis: For data containing multiple independent trajectories, root cells need to be specified separately for each trajectory
Q2: How to handle multiple independent developmental trajectories?
A: For data containing multiple independent trajectories (such as multi-lineage differentiation), the following strategies can be adopted:
- Partition analysis: Use the
use_partition = TRUEparameter, and Monocle3 will automatically identify different cell partitions - Separate analysis: According to cell type annotations, divide data into different subsets and perform pseudotime analysis separately
- Integrate results: After analysis is complete, pseudotime values from different trajectories can be separately added to the Seurat object for comparison
Q3: How to integrate pseudotime analysis results with other analyses?
A: Pseudotime analysis results can be integrated with various analyses:
- Differential accessibility analysis: Identify peaks that change along pseudotime, revealing dynamic regulatory elements
- Motif analysis: Perform motif enrichment on differential peaks to identify key transcription factors
- Multi-omics integration: Integrate with scRNA-seq data to reveal temporal associations between chromatin accessibility and gene expression
- Functional annotation: Combine with gene annotation to identify target genes affected by dynamic regulatory elements