scMethyl + RNA Multi-omics Quality Control Report Documentation
This document provides detailed explanations of the definitions, calculation methods, and interpretation guidelines for each metric in the SeekMethyl QC report. It is intended to help users understand sequencing data and library quality, and to serve as a reference for downstream analyses.
The report is divided into three main sections: Joint (multi-omics integrated analysis), RNA (transcriptome), and MET (methylation).
Joint Metrics
This section reports key quality and scale metrics for the cell population that (i) passes QC in both RNA and methylation modalities, and (ii) has barcodes that can be matched one-to-one across the two modalities.
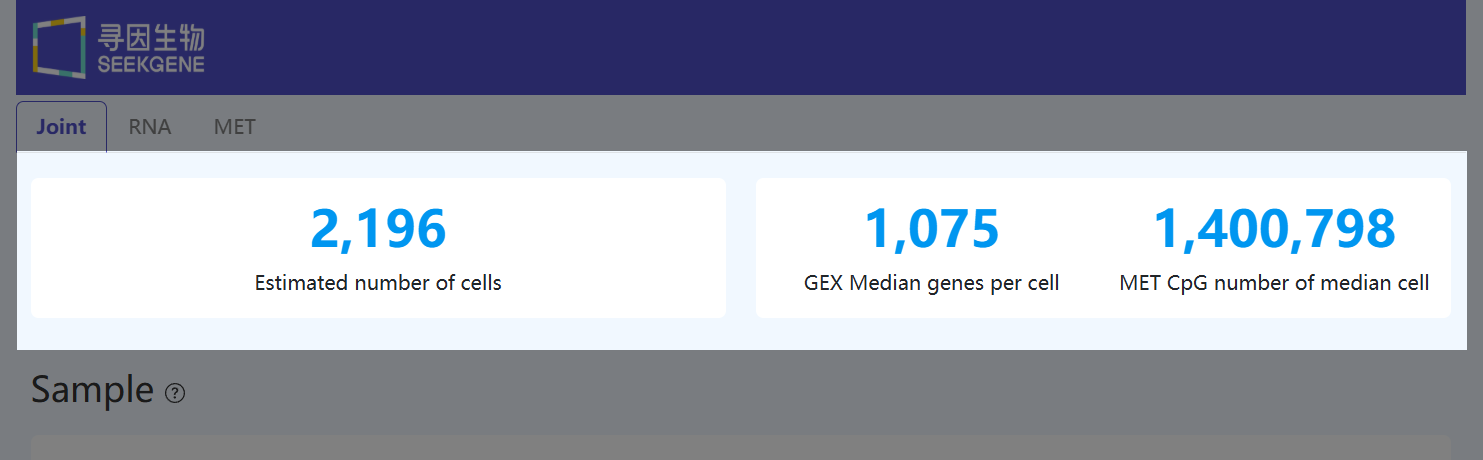
Estimated Number of Cells (Joint)
- Definition: The number of barcodes identified as valid cells in both RNA and methylation data.
- Calculation Method: Cells are called separately in RNA (based on genes and UMI counts) and in methylation (based on genomic coverage and CpG counts). The reported value is the size of the intersection of barcodes passing QC in both modalities.
- Interpretation: This metric represents the effective cell count available for integrated multi-omics analysis and forms the basis for joint analysis.
GEX Median Genes per Cell (Joint)
(This metric is defined identically to “Median Genes per Cell” in the RNA Cells module.)
- Definition: The median number of genes detected per valid cell.
- Calculation Method: For each valid cell, count the number of genes with at least one UMI, then take the median across cells.
- Interpretation: Reflects sensitivity and complexity of the RNA library. Higher values generally indicate better library quality and/or deeper sequencing, enabling detection of more lowly expressed genes.
MET CpG Number of Median Cell (Joint)
(This metric is defined identically to “CpG Number of Median Cell” in the MET Cells module.)
- Definition: The number of CpG sites detected in the cell with median genomic coverage.
- Calculation Method: Sort valid cells by genomic coverage, select the median-coverage cell, and count CpG sites that are covered by at least one filtered, successfully aligned read and yield a valid methylation call (counted separately for forward and reverse strands).
- Interpretation: Indicates methylation information content for a representative single cell. Higher values mean more CpG sites are detected within the covered regions and the cell carries richer single-cell methylation information.
Barcode Rank Plot for Joint Cell Calling (Joint)
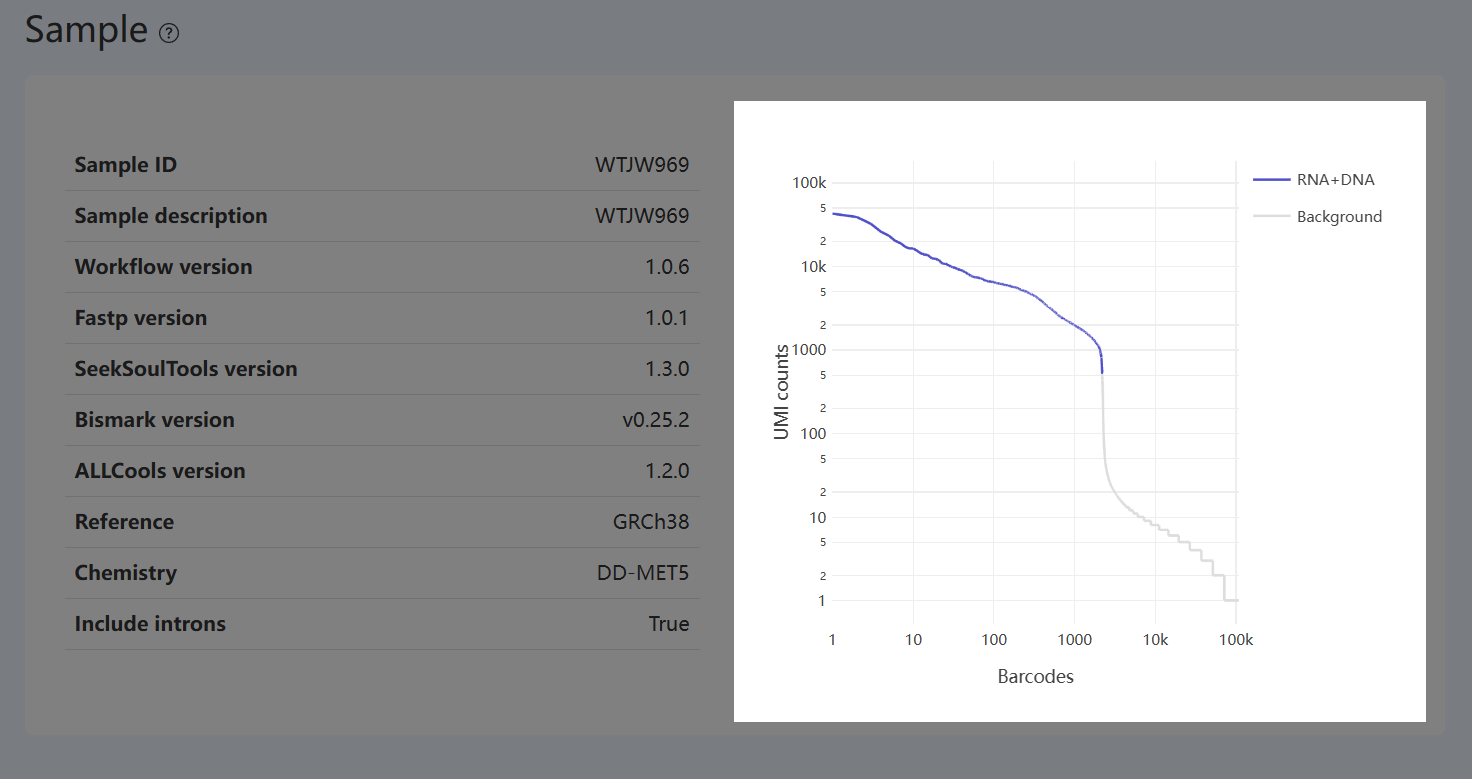
- Definition: This plot shows the distribution of the counting metric used for joint cell calling (UMI counts as an example) across all barcodes, ranked from high to low. The x-axis is the barcode rank (sorted position), and the y-axis is the corresponding count. Colors distinguish barcodes classified as RNA+DNA (barcodes that are called as cells and pass QC in both RNA and methylation, and can be matched one-to-one) versus Background.
- Interpretation: Provides a visual check of separation between barcode groups during joint cell calling.
- Overall trend: High-count regions are dominated by cell-associated barcodes, while background barcodes become more prevalent in the low-count region.
- RNA+DNA Curve: Its span within the global distribution indicates where jointly retained cells lie among all barcodes and their relative scale.
- Sanity check: The relationship between barcode types across high/low-count regions and the overall curve shape serves as an intuitive check of the joint calling/filtering result.
Feature-based Joint Cell Visualization (Joint)
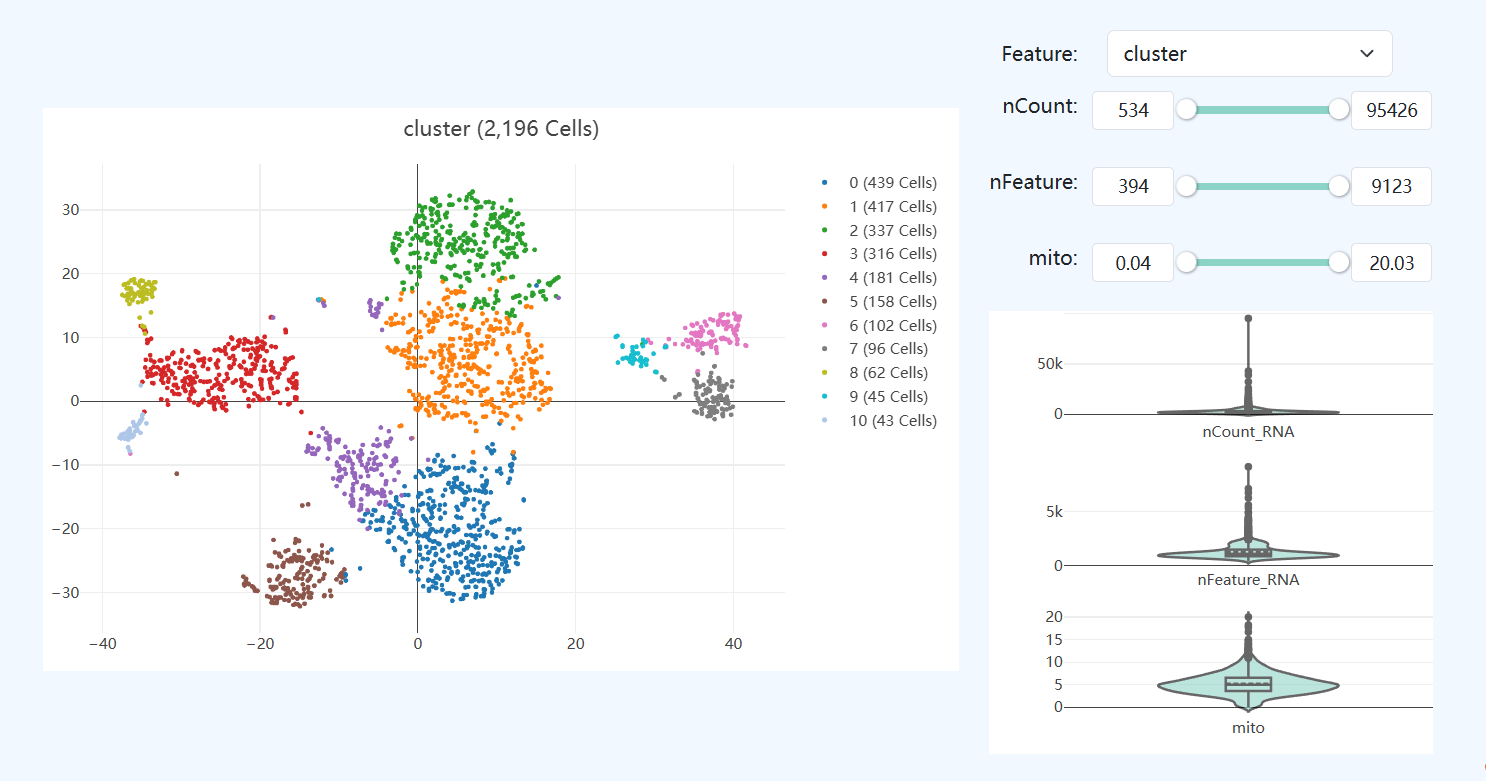
- Definition: This module visualizes joint cells in a unified low-dimensional embedding, colored by selectable features. Users can choose transcriptomic or methylation-related metrics from the Feature dropdown to inspect their distributions across cells. A summary distribution of the selected feature across all cells is shown on the right to aid overall assessment.
- Interpretation: Enables multi-omics visual assessment of consistency and heterogeneity of joint cells across quality metrics and biological features.
- Cluster: Selecting “cluster” displays the joint clustering results and spatial distribution of subclusters in the embedding.
- RNA Metrics: Switching to RNA features (e.g.,
nCount_RNA,nFeature_RNA,mito) helps evaluate differences in sequencing depth, gene detection capacity, and mitochondrial signal across cell groups. - Methylation Metrics: Switching to methylation features (e.g.,
CpG_number,CpG_methylation,CH_methylation) shows distributions of methylation information content and methylation levels across cells.
By switching features within the same embedding, users can assess whether joint cells exhibit systematic biases across modalities and can use this as a reference for subsequent filtering or interpretation of clustering.
RNA Metrics
This section summarizes sequencing quality, mapping performance, and key quantification metrics for the single-cell transcriptome library. It is used to assess overall RNA data quality and usability, and to determine whether the dataset is suitable for downstream analyses.
Sequencing (RNA)
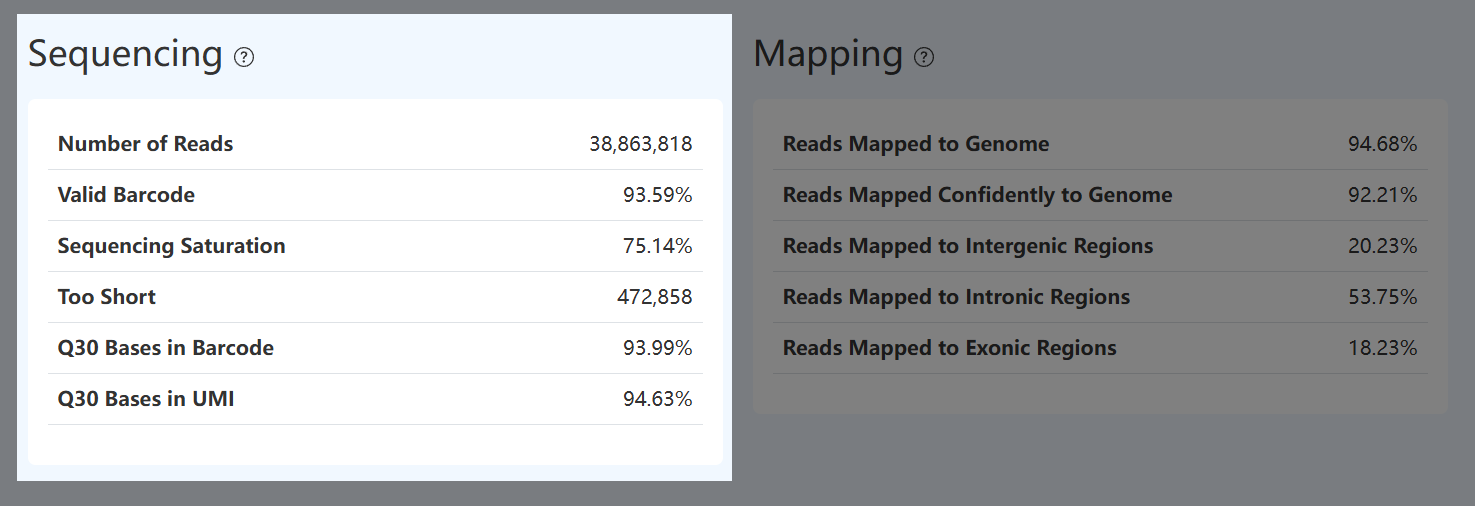
Number of Reads (RNA)
- Definition: Total number of valid paired-end read pairs retained after fastp QC.
- Calculation Method: Run fastp QC on raw sequencing data and count read pairs passing filters.
- Interpretation: Represents the usable sequencing yield after QC and serves as a basic input for downstream analysis. It should be interpreted together with Valid Barcode rate, Fraction Reads in Cells, and sequencing saturation, rather than using sequencing yield alone as a proxy for data quality.
Valid Barcode (RNA)
- Definition: Fraction of read pairs (after fastp QC) whose barcode sequences match the cell barcode whitelist.
- Calculation Method: Count read pairs whose barcodes match the whitelist either directly (no correction) or after allowing limited base error correction, then divide by Number of Reads.
- Interpretation: Reflects barcode synthesis quality, sequencing accuracy, and whitelist matching. If low, interpret together with Barcode Q30 and Fraction Reads in Cells to distinguish sequencing-quality issues from library structure or whitelist mismatch.
Sequencing Saturation (RNA)
- Definition: Measures the degree of molecular re-sequencing (duplicate sampling) at the current sequencing depth.
- Calculation Method: Computed from reads used for UMI counting as Sequencing Saturation = 1 − (number of unique UMIs / number of reads usable for UMI counting).
- Interpretation: Describes the relationship between sequencing depth and library complexity; interpret jointly with per-cell UMI and gene counts. Higher saturation means a larger fraction of additional reads are duplicates and further sequencing yields limited new information; lower saturation suggests many molecules remain unsampled and additional sequencing can still recover more transcript information.
Too Short (RNA)
- Definition: Number of reads filtered out because their length falls below the minimum retention threshold after adapter trimming.
- Calculation Method: After adapter removal, count reads discarded due to length below the preset minimum.
- Interpretation: Reflects the number of RNA reads removed for being too short after adapter trimming. A high number often indicates substantial adapter contamination, short inserts, or degradation during library preparation, reducing usable reads and potentially affecting mapping efficiency and quantification.
Q30 Bases in Barcode (RNA)
- Definition: Fraction of bases in barcode sequences with Phred quality score ≥ Q30.
- Calculation Method: Count barcode bases with Phred ≥ 30 and divide by total barcode bases.
- Interpretation: Measures barcode read quality. Higher values support more accurate barcode assignment and typically improve valid barcode detection; low values may reduce the number of called cells.
Q30 Bases in UMI (RNA)
- Definition: Fraction of bases in UMI sequences with Phred quality score ≥ Q30.
- Calculation Method: Count UMI bases with Phred ≥ 30 and divide by total UMI bases.
- Interpretation: Measures UMI read quality. Higher values improve UMI identification accuracy and deduplication reliability, increasing confidence in transcript quantification.
Mapping (RNA)
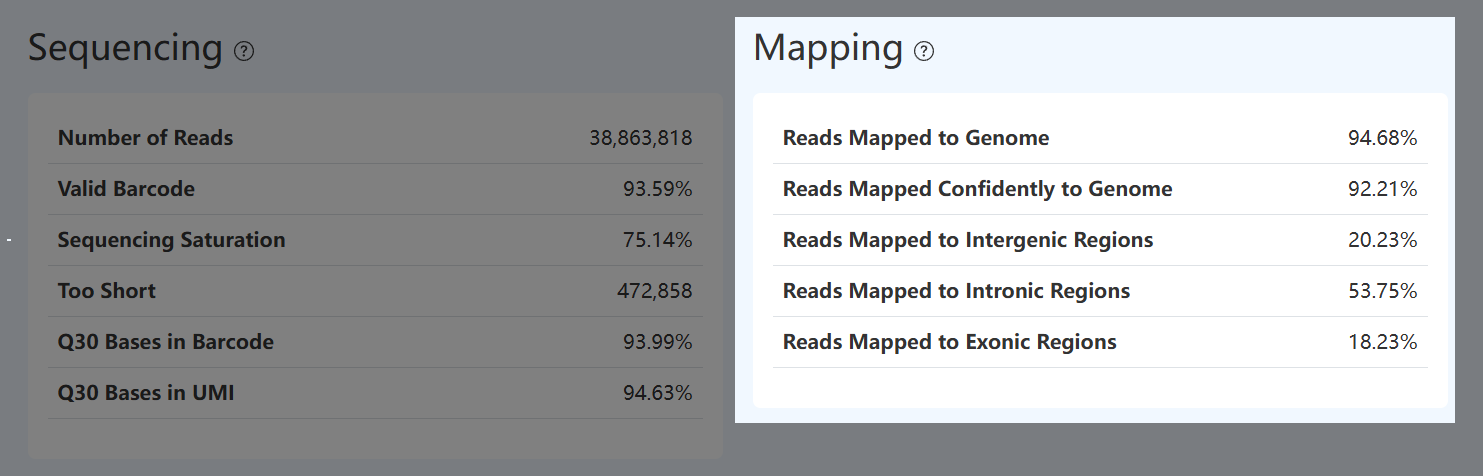
Reads Mapped to Genome (RNA)
- Definition: Fraction of RNA reads that successfully map to the reference genome among reads used for mapping.
- Calculation Method: After barcode detection and filtering of too-short reads, count reads entering alignment; divide the number of reads mapped to the reference genome (including uniquely and multi-mapped reads) by the total aligned-attempt reads.
- Interpretation: Reflects how well valid RNA reads match the reference genome and library specificity. High mapping generally indicates appropriate sample origin and a suitable reference genome. Low mapping may result from contamination, high low-complexity content, or reference mismatch; interpret together with unique mapping rate and exonic/intronic mapping distributions.
Reads Mapped Confidently to Genome (RNA)
- Definition: Fraction of RNA reads that map uniquely and confidently to a single genomic location.
- Calculation Method: Select reads with high mapping quality and a single best alignment location, then divide by total reads used for mapping.
- Interpretation: Indicates the fraction of reads usable for reliable gene expression quantification. Low unique mapping can reflect repetitive content, insufficient sequencing quality, or reference mismatch; interpret with overall mapping rate and exonic mapping rate.
Reads Mapped to Exonic Regions (RNA)
- Definition: Fraction of genome-mapped RNA reads that map to annotated exonic regions.
- Calculation Method: Count reads mapped to exons and divide by total reads mapped to the genome.
- Interpretation: Reflects enrichment for mature mRNA. Higher values generally indicate libraries dominated by mature transcripts and are favorable for gene expression quantification.
Reads Mapped to Intronic Regions (RNA)
- Definition: Fraction of genome-mapped RNA reads that map to annotated intronic regions.
- Calculation Method: Count reads mapped to introns and divide by total reads mapped to the genome.
- Interpretation: Reflects the proportion of unspliced or nuclear RNA. Values depend on species, sample type, and library protocol; interpret together with exonic mapping to distinguish mature mRNA from nuclear transcriptional signal.
Reads Mapped to Intergenic Regions (RNA)
- Definition: Fraction of genome-mapped RNA reads that map to annotated intergenic regions.
- Calculation Method: Count reads mapped to intergenic regions and divide by total reads mapped to the genome.
- Interpretation: Measures the fraction of reads outside known gene annotations. Elevated values may reflect incomplete annotation, annotation/reference mismatch, non-coding transcription, or non-specific mapping; interpret with overall mapping rate and exon/intron distributions.
Cells (RNA)
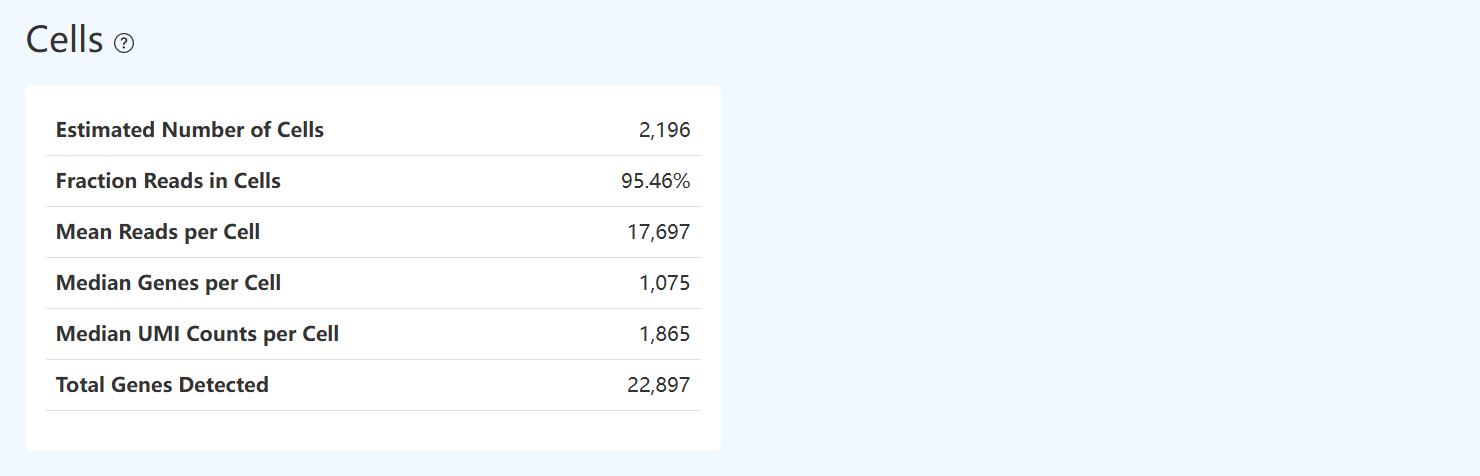
Estimated Number of Cells (RNA)
- Definition: Number of valid cell barcodes identified from RNA data using UMI deduplication and a cell-calling algorithm.
- Calculation Method: Use the barcode UMI count distribution and a cell-calling procedure to distinguish real cells from background (e.g., empty droplets), then count the barcodes called as cells.
- Interpretation: Indicates how many cells are successfully identified in RNA data. It is affected by loaded cell number, sequencing depth, and cell-calling parameters, and should be evaluated together with Mean Reads per Cell and Fraction Reads in Cells.
Fraction Reads in Cells (RNA)
- Definition: Fraction of genome-mapped RNA reads that originate from barcodes called as valid cells.
- Calculation Method: Among reads mapped to the genome, count reads assigned to valid cell barcodes and divide by total genome-mapped reads.
- Interpretation: Measures the proportion of signal truly coming from cells, and is important for assessing ambient RNA and empty-droplet effects. Higher values indicate most reads come from real cells; lower values suggest substantial background RNA, empty droplets, or free RNA from lysed cells.
Mean Reads per Cell (RNA)
- Definition: Mean number of sequencing reads assigned to each valid cell barcode.
- Calculation Method: Sum reads originating from valid cell barcodes and divide by the number of valid cells.
- Interpretation: Reflects how sequencing depth is distributed across cells. Higher values generally provide more per-cell information and can stabilize quantification, but should be interpreted alongside saturation and library complexity.
Median Genes per Cell (RNA)
- Definition: Median number of genes detected per valid cell.
- Calculation Method: For each valid cell, count genes with at least one UMI, then take the median across cells.
- Interpretation: Reflects sensitivity and complexity of the RNA library; higher values typically indicate better library quality and/or deeper sequencing.
Median UMI Counts per Cell (RNA)
- Definition: Median number of unique UMIs detected per valid cell.
- Calculation Method: For each valid cell, count unique UMIs (each UMI counted once), then take the median.
- Interpretation: Represents typical transcript molecule capture per cell. Higher values indicate richer quantifiable transcript information, but should be evaluated with sequencing depth and library complexity.
Total Genes Detected (RNA)
- Definition: Total number of distinct genes detected across all valid cells.
- Calculation Method: Aggregate UMI-deduplicated gene detections across all valid cells and count unique genes.
- Interpretation: Reflects breadth of gene expression coverage. Higher values indicate more gene species detected, but must be interpreted considering cell number, sequencing depth, and sample type.
Sequencing Depth and Saturation Analysis(RNA)
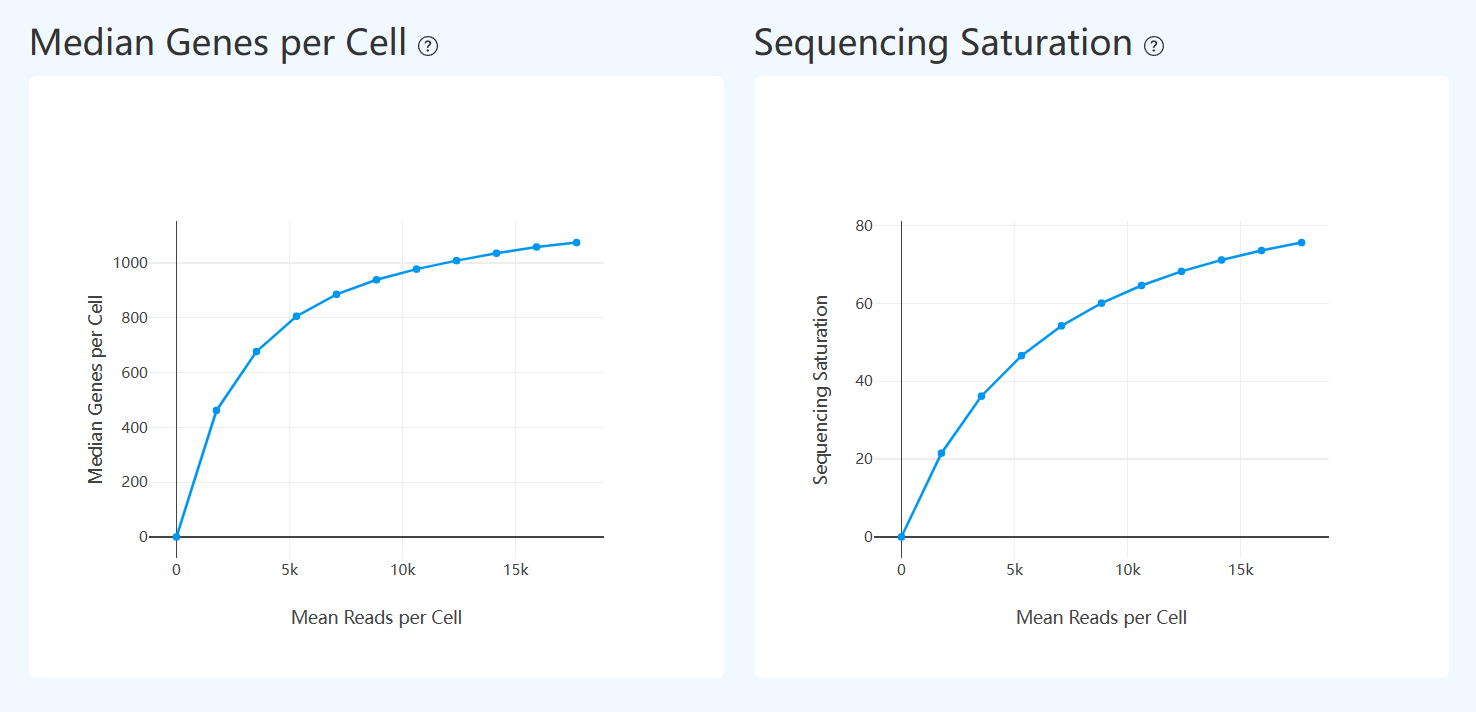
Median Genes per Cell (RNA)
- Definition: After downsampling RNA sequencing data, shows how Median Genes per Cell changes under different Mean Reads per Cell conditions. The x-axis is mean reads per cell, and the y-axis is the corresponding median genes detected per cell.
- Interpretation: Evaluates the effect of sequencing depth on gene detection and its saturation trend. Typically, median genes increase with depth; when the curve flattens, incremental reads yield diminishing gains. This helps assess whether current depth approaches the library complexity limit and informs whether additional sequencing is warranted.
Sequencing Saturation (RNA)
- Definition: After downsampling, shows how Sequencing Saturation changes with increasing sequencing depth. The x-axis represents the downsampled information level (referenced to per-cell gene detection), and the y-axis is sequencing saturation, reflecting duplicate fraction.
- Interpretation: Assesses the relationship between sequencing depth and library complexity. Saturation generally increases with depth as duplicates rise; when the curve flattens, marginal benefit of additional sequencing becomes limited. Interpret together with downsampling curves for genes or UMIs to judge whether depth is near the complexity ceiling.
Methylation Metrics
This section reports core QC metrics for single-cell methylation libraries, including sequencing quality, conversion efficiency, mapping performance, and methylation levels. These metrics are used to assess reliability and usability of methylation data for downstream analyses.
Sequencing (MET)
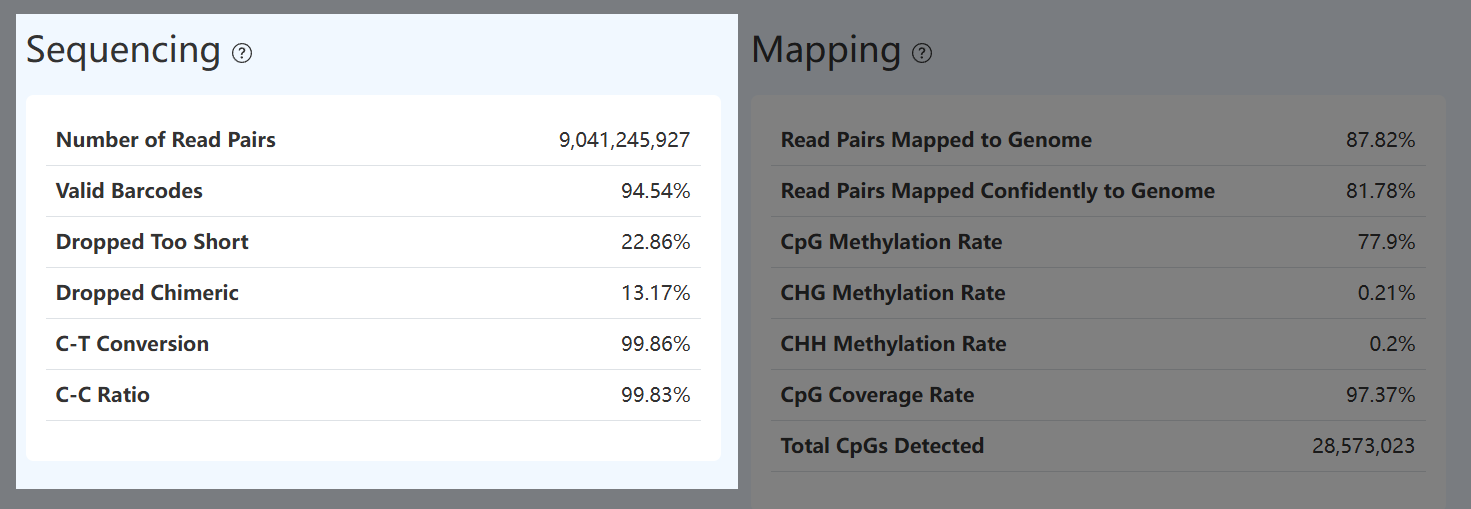
Number of Read Pairs (MET)
- Definition: Total number of methylation sequencing read pairs retained after fastp QC.
- Calculation Method: Run fastp QC on raw methylation sequencing data and count retained paired read pairs.
- Interpretation: Reflects overall sequencing yield. Interpret together with Valid Barcode, genome mapping rate, and Fraction Read Pairs in Cells to determine how effectively yield converts into usable information.
Valid Barcode (MET)
- Definition: Fraction of methylation read pairs (after fastp QC) whose barcode sequences match the cell barcode whitelist.
- Calculation Method: Count read pairs whose barcodes match the whitelist directly or after allowed base correction, then divide by Number of Read Pairs.
- Interpretation: Reflects retention and identification of cell barcodes in the methylation library. If low, besides insufficient digestion/ligation efficiency during library prep causing barcode fragment damage/loss, users can also inspect fastp results or abnormal enrichment of C at read starts to help diagnose structural abnormalities or conversion-related issues.
Dropped Too Short (MET)
- Definition: Fraction of read pairs discarded because R1 (20 bp) or R2 (60 bp) is shorter than the minimum length threshold after adapter trimming.
- Calculation Method: Count read pairs filtered due to either mate being below the minimum length threshold after adapter removal, then divide by Number of Read Pairs.
- Interpretation: Reflects insert length and integrity of the methylation library. High values usually indicate short inserts, residual adapters, or fragment degradation, leading to loss of usable read pairs.
Dropped Chimeric (MET)
- Definition: Among read pairs that meet structural requirements (valid barcode, R1 ≥ 20 bp, R2 ≥ 60 bp), the fraction filtered as chimeric molecules or conversion artifacts due to abnormal CH-context methylation site patterns.
- Calculation Method: After barcode validation and minimum-length filtering, apply CH-context methylation pattern rules and count read pairs removed as abnormal, then divide by the number of structurally qualified read pairs.
- Interpretation: Reflects the proportion of chimeras and abnormal-conversion reads introduced during experiment/amplification. High values suggest substantial non-authentic methylation signal, potentially from PCR chimeras, conversion anomalies, or library structural issues.
C-T Conversion (MET)
- Definition: Efficiency of converting unmethylated cytosines (C) to thymines (T) during bisulfite conversion.
- Calculation Method: For structurally complete read pairs usable for methylation calling (i.e., correctly identifying 7F, 17L, and ME structure sequences), compute on the Forward strand the fraction of known unmethylated C sites on 17L/ME that are converted to T.
- Interpretation: A core methylation QC metric. Low conversion causes unmethylated C to be miscalled as methylated, introducing false positives; interpret together with CHG/CHH methylation rates.
C-C Ratio (MET)
- Definition: Fraction of methylated cytosines (C) correctly retained as C during conversion, reflecting conversion specificity.
- Calculation Method: For structurally complete read pairs, compute on the Reverse strand the fraction of known methylated C sites on 17L/ME that remain C (not incorrectly converted to T).
- Interpretation: A core specificity metric. Low values suggest over-conversion, where methylated C is incorrectly converted and methylation signal is lost (false negatives); interpret jointly with C–T conversion.
Mapping (MET)
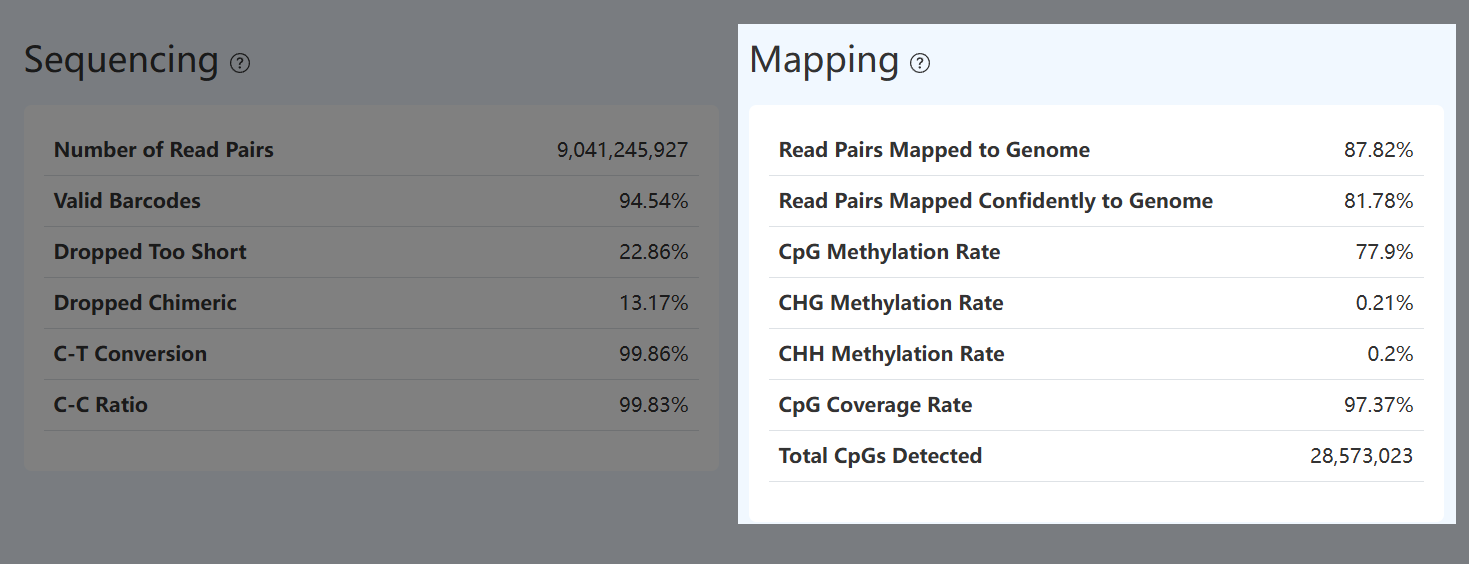
Read Pairs Mapped to Genome (MET)
- Definition: Fraction of read pairs that successfully map to the reference genome among read pairs entering genome alignment.
- Calculation Method: After barcode validation, too-short filtering, and CH-abnormal filtering, count read pairs entering Bismark alignment; divide mapped read pairs by total aligned-attempt read pairs. Computed from the Bismark alignment report.
- Interpretation: Reflects genome mapping efficiency at the usable-read level. Low mapping may be due to contamination, insufficient adapter trimming, or overly long inserts affecting alignment; interpret together with unique mapping rate and Valid Barcode.
Read Pairs Mapped Confidently to Genome (MET)
- Definition: Fraction of aligned methylation read pairs that map uniquely and confidently to a single genomic location.
- Calculation Method: From read pairs entering Bismark alignment, count those with a single best alignment and divide by total aligned-attempt read pairs. Computed from the Bismark report.
- Interpretation: Reflects mapping certainty and positional reliability. Low unique mapping may indicate contamination, library structural issues, overly long inserts, or high repetitive content; interpret with overall mapping and downstream coverage metrics.
CpG Methylation Rate (MET)
- Definition: Mean methylation level of CpG sites genome-wide.
- Calculation Method: Using uniquely mapped read pairs, count methylated C calls in CpG context and divide by total signal (C + T) in CpG context. Computed from Bismark methylation statistics.
- Interpretation: Reflects global CpG methylation state. Large deviations may indicate abnormal sample type, conversion issues, or library problems; interpret with C–T conversion and C–C ratio.
CHG Methylation Rate (MET)
- Definition: Mean methylation level of cytosines in CHG context.
- Calculation Method: Using uniquely mapped read pairs, count methylated C calls in CHG context and divide by total signal (C + T) in CHG context. From Bismark statistics.
- Interpretation: Reflects background non-CpG methylation. In most human/mouse somatic tissues it is typically very low (usually < 1%). Elevated values may indicate incomplete conversion, or presence of cell types with non-CpG methylation (e.g., neurons); interpret with C–T conversion and CpG methylation rate.
CHH Methylation Rate (MET)
- Definition: Mean methylation level of cytosines in CHH context.
- Calculation Method: Using uniquely mapped read pairs, count methylated C calls in CHH context and divide by total signal (C + T) in CHH context. From Bismark statistics.
- Interpretation: Similar to CHG: typically very low (usually < 1%) in most human/mouse somatic tissues. Elevation suggests incomplete conversion or presence of specific cell types; interpret with C–T conversion and CpG methylation rate.
CpG Coverage Rate (MET)
- Definition: Fraction of theoretical CpG sites in the reference genome that are detected at least once.
- Calculation Method: Aggregate methylation data across all cells (treated as bulk), count CpG sites detected at least once, and divide by the total number of theoretical CpG sites in the reference genome (excluding mitochondrial chromosome and unplaced contigs).
- Interpretation: Reflects genome-wide breadth of CpG coverage. Higher values indicate broader CpG detection and support more comprehensive/stable methylation pattern analysis.
Total CpGs Detected (MET)
- Definition: Total number of distinct CpG sites detected at least once after aggregating all cells.
- Calculation Method: Aggregate across all cells (bulk-like) and count unique CpG sites covered by at least one valid aligned read and passing methylation calling.
- Interpretation: Reflects the effective CpG site space captured. Influenced by sequencing depth, cell number, and CpG distribution in the reference genome; theoretical CpG counts differ substantially between species, so interpret together with CpG Coverage Rate.
Cells (MET)
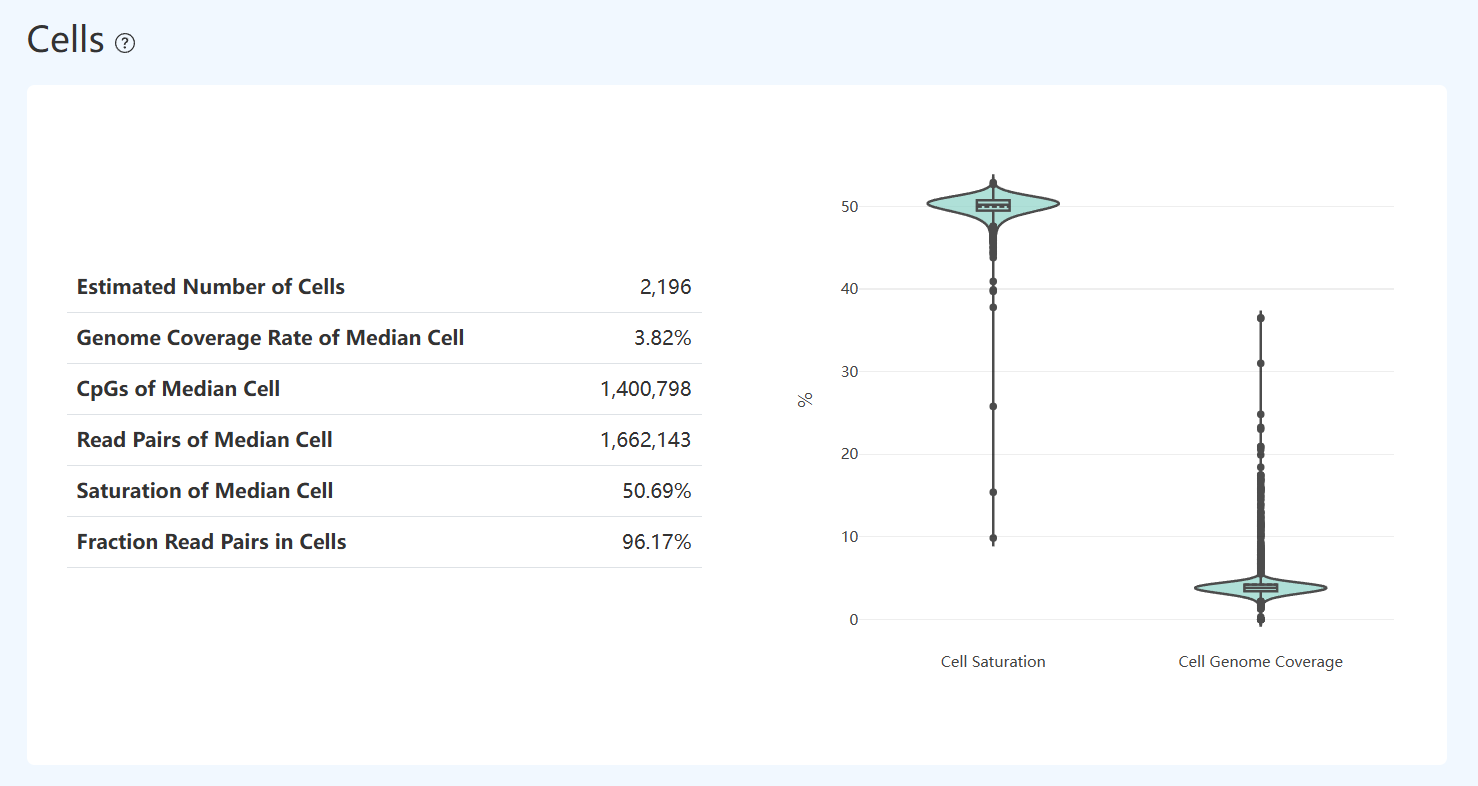
Genome Coverage Rate of Median Cell (MET)
- Definition: The genome coverage proportion for the median-coverage cell among all valid cells.
- Calculation Method: Calculate the genome coverage proportion for each cell (valid reads coverages divided by reference genome size), sort cells by coverage proportion, and select the cell at the median position.
- Interpretation: Reflects genome mapping efficiency at the usable-read level. Low mapping may be due to contamination, insufficient adapter trimming, or overly long inserts affecting alignment; interpret together with unique mapping rate and Valid Barcode.
CpGs of Median Cell (MET)
- Definition: Number of CpG sites detected in the median-coverage cell.
- Calculation Method: Sort valid cells by genomic coverage, select the median cell, and count CpG sites covered by at least one filtered, successfully aligned read and yielding a valid methylation call (counted separately for forward and reverse strands).
- Interpretation: Reflects methylation information content for a representative cell; higher values indicate richer CpG detection within the covered regions.
Read Pairs of Median Cell (MET)
- Definition: Number of uniquely and confidently mapped read pairs to the reference genome within the median-coverage valid cell.
- Calculation Method: Select the median-coverage cell; within its read pairs, count those with a unique best alignment that successfully map to the genome. Derived from the Bismark alignment report.
- Interpretation: Reflects the amount of high-quality sequencing data available for methylation analysis in a representative cell. Higher values generally mean more usable methylation information, but interpret with genome coverage and CpG counts.
Saturation of Median Cell (MET)
- Definition: Assesses whether methylation sequencing for the median-coverage cell is approaching saturation at the DNA molecule level.
- Calculation Method: For the median-coverage cell, count deduplicated unique DNA molecules over covered CpG sites and divide by total reads used to detect those sites, then compute Saturation = 1 − (unique DNA molecules / total reads).
- Interpretation: Reflects the relationship between sequencing depth and library complexity for a representative cell. Higher saturation indicates more duplication and limited gains from deeper sequencing; lower saturation suggests many molecules remain unsampled and more sequencing may yield additional usable methylation calls.
Fraction Read Pairs in Cells (MET)
- Definition: Among read pairs that map uniquely and confidently to the genome, the fraction originating from valid cell barcodes.
- Calculation Method: Among all uniquely mapped read pairs, count those assigned to valid cell barcodes and divide by total uniquely mapped read pairs; computed from alignment and cell-calling results.
- Interpretation: Measures the proportion of signal truly coming from valid cells, and is important for assessing background noise and invalid barcode impact. In DD-MET3 dual-tag experiments, barcode matching/identification can incur intrinsic losses, so this metric is often relatively low and should be interpreted together with Valid Barcode and mapping rate.
Cell Saturation & Genome Coverage Distribution(MET)
- Definition: The violin plots on the right show distributions of per-cell Cell Saturation and Cell Genome Coverage across all valid cells; boxplots indicate median and interquartile range, and points represent individual cells.
- Interpretation: Provides a quick view of consistency and variability across cells in duplication (Cell Saturation) and genome coverage breadth (Cell Genome Coverage).
- More concentrated distributions: Typically indicate smaller between-cell differences and better overall consistency.
- More dispersed distributions or many outliers: Indicate cells with large differences; further evaluate using that cell’s read pairs, CpG counts, and filtering-related metrics.
Single-cell Methylation Level and Information Content(MET)
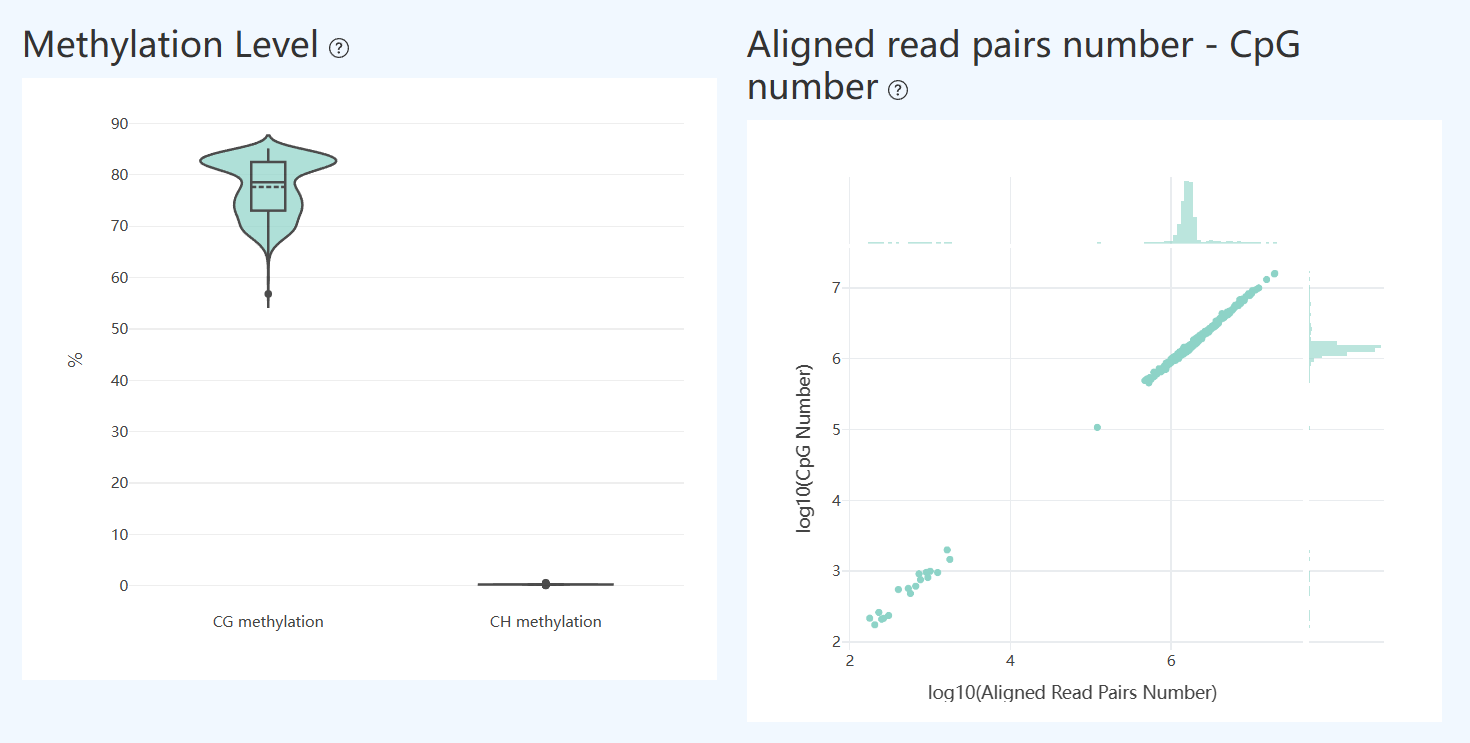
Methylation Level(MET)
- Definition: Violin plots show the distribution of single-cell methylation rates for CG (CpG) and CH (non-CpG, including CHG/CHH); boxplots indicate median and interquartile range, and points represent individual cells.
- Interpretation: Used to assess global methylation state and between-cell consistency. CG methylation is typically relatively concentrated in major cell populations, indicating stable global methylation; CH methylation is usually low background.
- Abnormal case 1 (elevated CH): If CH shifts upward overall or shows a pronounced long tail, this may indicate insufficient conversion efficiency or elevated background noise (though it may also reflect biological properties of certain cell types).
- Abnormal case 2 (dispersed CG): If CG is highly dispersed or contains many outliers, this often occurs with uneven cell quality or insufficient coverage; check single-cell coverage and the number of valid CpG sites.
Aligned read pairs number – CpG number(MET)
- Definition: Scatter plot shows, per cell, the relationship between the number of uniquely and confidently mapped read pairs (x-axis) and the number of detected CpG sites (y-axis). The plot uses log scales and includes marginal distributions to summarize overall patterns.
- Interpretation: Evaluates how effectively sequencing yield converts into methylation information at the single-cell level.
- Expected trend: Uniquely mapped read pairs and CpG counts should show a stable positive correlation, indicating sequencing supports CpG detection.
- Deviations/outliers: Cells clearly off the main trend often indicate quality differences, high duplication or low-complexity read fractions, or insufficient effectiveness in alignment and methylation calling. Such cells should be further assessed using coverage, saturation, and filtering fractions.