Single-Cell Spatial Transcriptomics Quality Control Report Documentation
This document details the definitions, calculation methods, and interpretation guidelines for various metrics and charts in the spatial transcriptomics quality control report generated by the SeekSpace Tools software. It aims to help users understand the sequencing data and library quality, providing a reference for subsequent data analysis.
The report is mainly divided into two parts:
- Spatial (Sequencing & Positioning): Contains QC summaries and diagnostic plots such as Summary, RNA Library, RNA Mapping, Spatial Library, Depth/Saturation Curves, and Barcode Rank Plots.
- Analysis (Analysis Results): Contains dimensionality reduction clustering (t-SNE), tissue spatial distribution, marker gene display, differentially expressed genes by cluster, etc.
Joint Metrics
This section displays the core quality control metrics combining spatial transcriptomics and single-cell features, used to comprehensively evaluate the valid cells and gene capture on the tissue section.
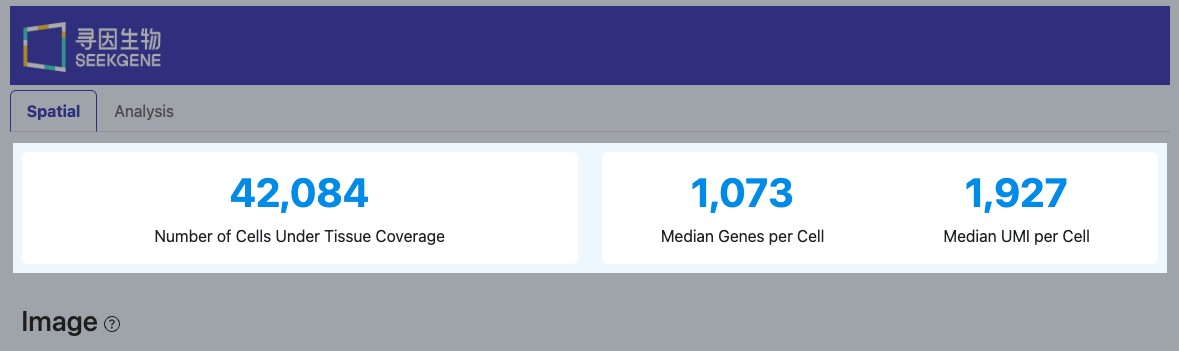
Number of Cells Under Tissue Coverage
(This metric has the same definition as "Number of Cells Under Tissue Coverage" in the Summary module)
- Definition: The number of valid cell barcodes that ultimately fall within the tissue coverage area.
- Calculation Method: After determining the tissue area, only cell barcodes with a unique center point located within the tissue coverage area are retained.
- Interpretation: This metric directly corresponds to the cell scale "actually used for counting and downstream analysis".
- If this value is much smaller than the Number of Cells with Unique Center: Focus on troubleshooting tissue area recognition, image/point misalignment (Adjustment), and whether the section tissue completely covers the capture area.
Median Genes per Cell
(This metric has the same definition as "Median Genes per Cell" in the Summary module)
- Definition: Among the valid cells within the tissue coverage, the median number of different genes detected per cell.
- Calculation Method: Aggregate the gene expression matrix of all cells within the tissue coverage, count the number of genes with at least 1 UMI count per cell, and take the median of this distribution across all cells.
- Interpretation: This metric is a core standard for evaluating the detection sensitivity of the RNA library and the complexity of single-cell information. A higher value generally indicates better library quality and sufficient sequencing depth, capturing more low-to-medium abundance transcripts.
- If cell count is sufficient but this metric is low: It is recommended to troubleshoot in this order: (1) Is sequencing depth insufficient (check Mean Reads per Cell, or if the downsampling curve hasn't reached a plateau); (2) Is there severe RNA degradation (judge based on the mapping rate, Too Short proportion, and abnormal exon/intron distribution in the Mapping module); (3) Are the cells themselves of poor quality or is ambient RNA contamination severe (check if Fraction Reads in Cells has decreased).
Median UMI per Cell
(This metric has the same definition as "Median UMI per Cell" in the Summary module)
- Definition: Among the valid cells within the tissue coverage, the median total number of UMIs contained per cell.
- Calculation Method: Aggregate the expression matrix of all cells within the tissue coverage, count the total number of UMIs assigned to each cell, and take the median of this distribution across all cells.
- Interpretation: This metric reflects the overall transcript molecular abundance captured by a single valid cell, serving as a direct reflection of library conversion efficiency and overall expression levels. It generally correlates positively with Median Genes per Cell.
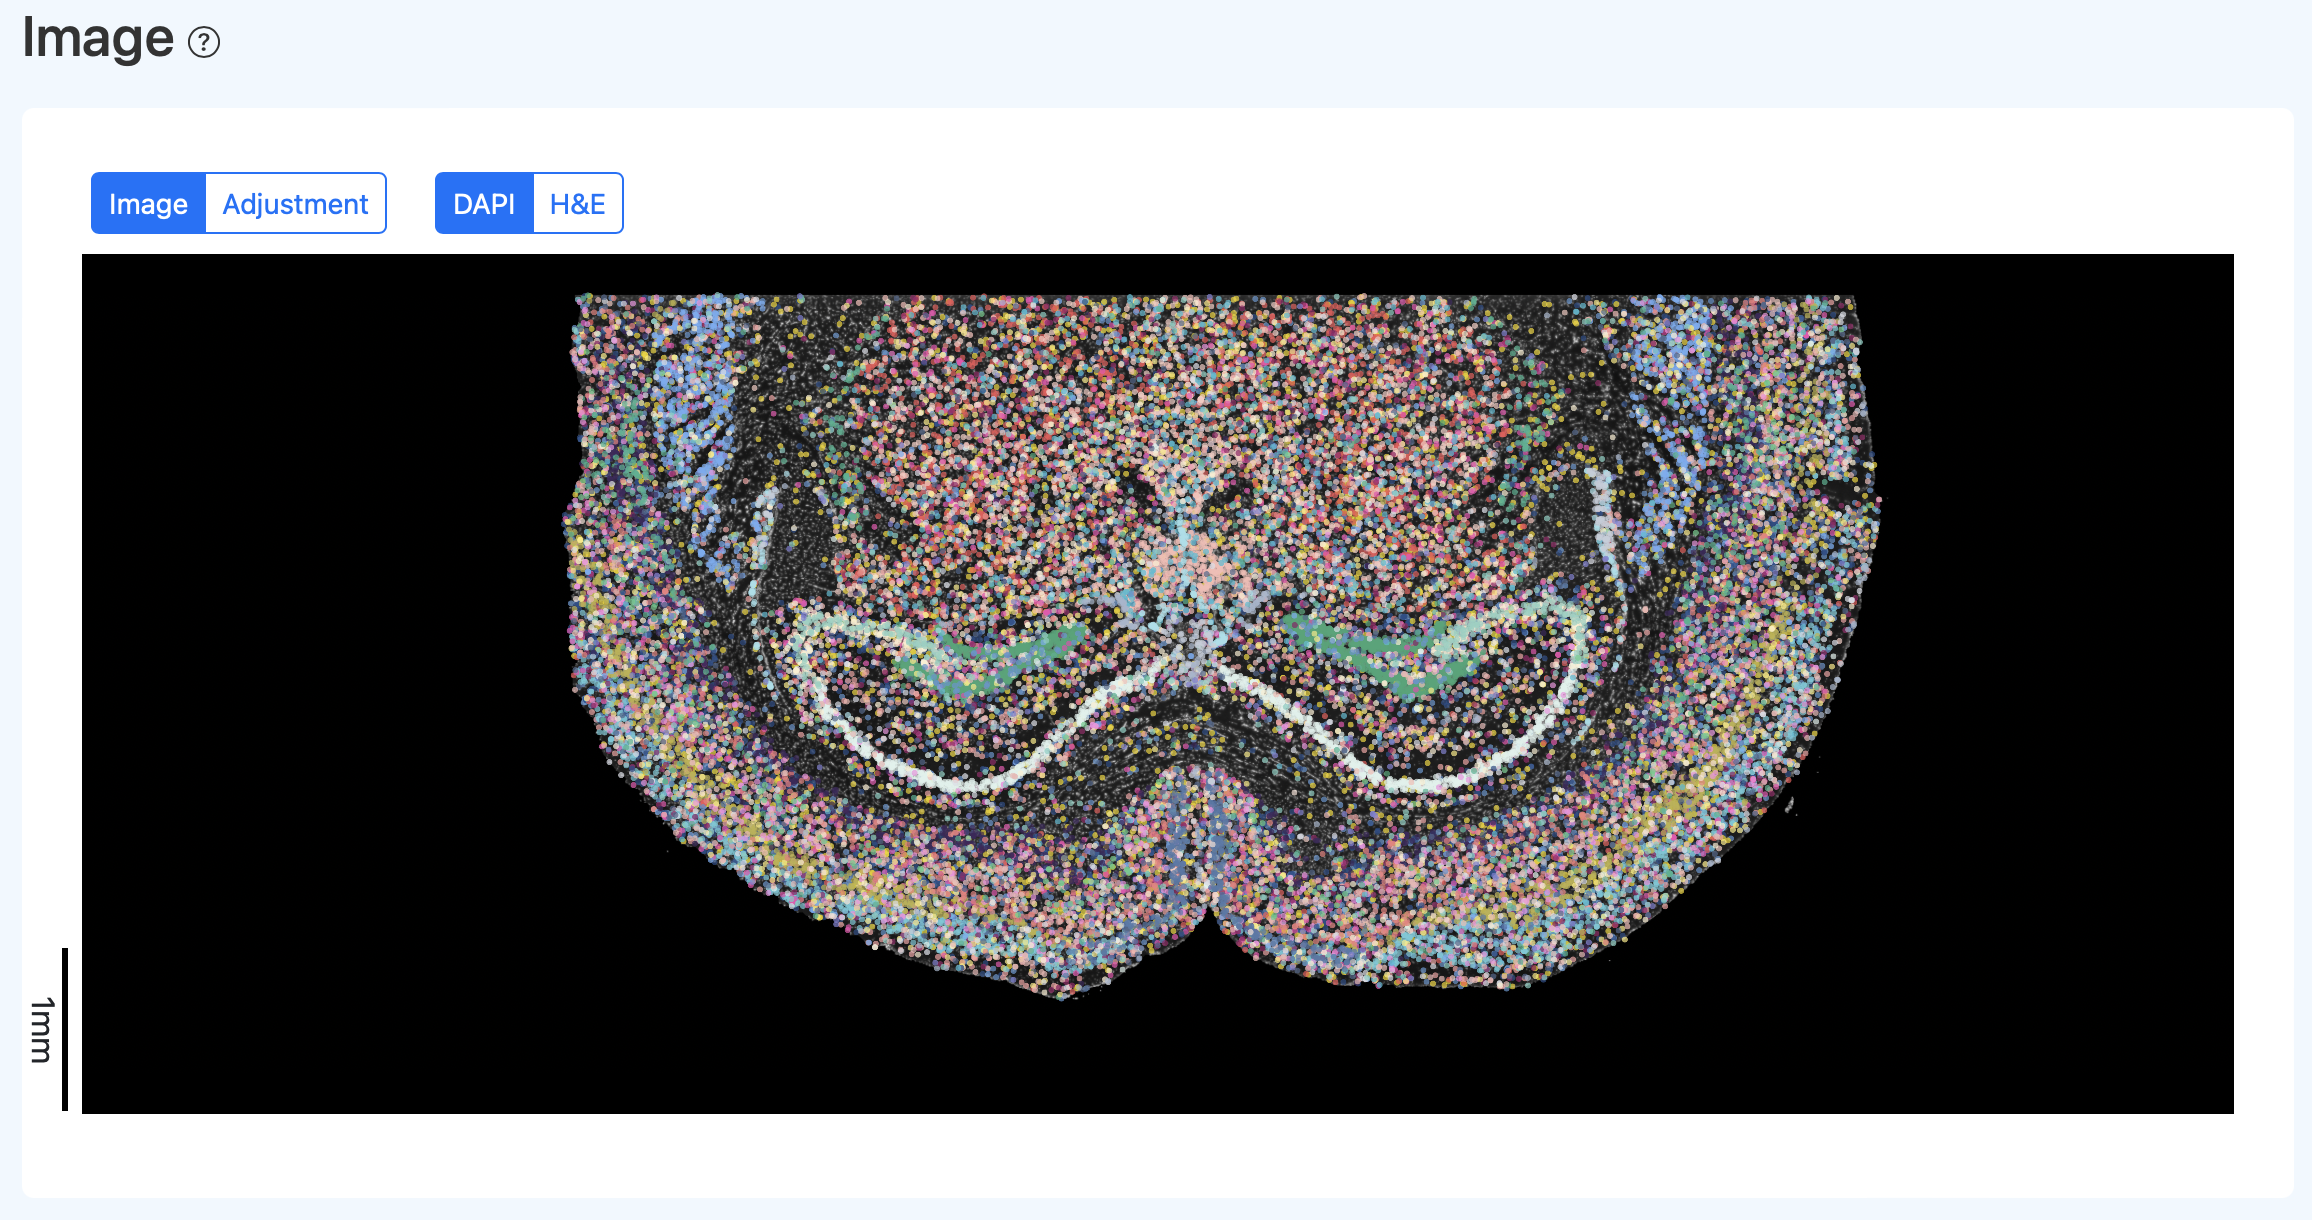
Interactive Spatial Visualization
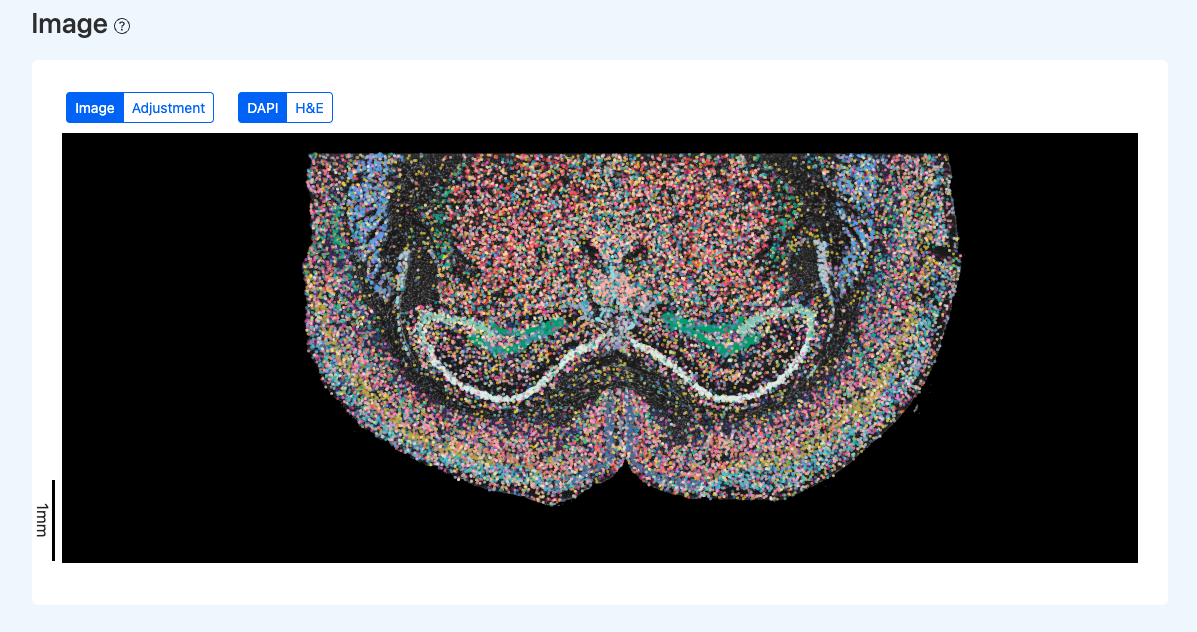
Illustration Notes:
- Click H&E to switch the background to the H&E image (if included in the report).
- Click Adjustment to enter the manual calibration interface for SeekSpace_Quality_Control_Report_Documentation.src and cell points. See the "Manual Calibration (Adjustment)" section for details.
Summary
This section summarizes the core quality control metrics of the spatial transcriptomics sequencing data, aiming to help users macroscopically evaluate the overall experimental quality, cell yield scale, and data information richness. It is recommended to prioritize assessing overall data usability through this module, and subsequently combine it with the RNA and Spatial modules for deeper metric diagnosis and anomaly troubleshooting.
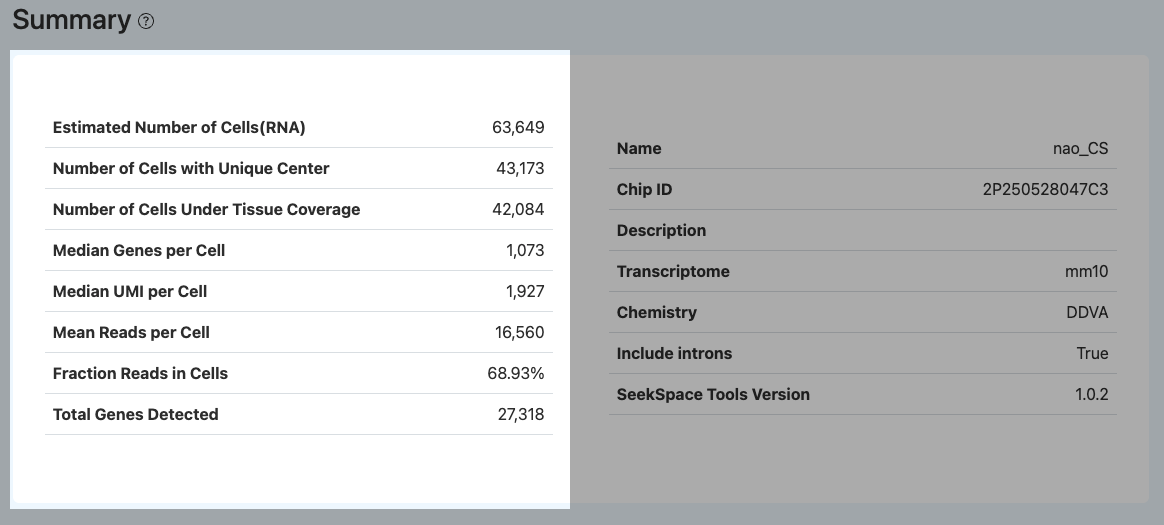
Estimated Number of Cells (RNA)
- Definition: The number of Barcodes determined as valid cells in the RNA library.
- Calculation Method: Based on the RNA UMI count distribution of each Barcode, valid cells are filtered out using the
forceCellmethod by default. First, the top 80k Barcodes with the highest total UMI counts are selected as the candidate population, then low-quality Barcodes with UMI < 200 are filtered out, and the remaining are the valid cells in the RNA library. - Interpretation: This metric reflects the scale of cells in the RNA library available for subsequent analysis. Its value is influenced by factors such as sample input amount, cell viability, lysis efficiency, sequencing depth, and cell calling thresholds.
- If this value is significantly low: It is recommended to prioritize checking tissue section quality, sequencing data volume (combining Number of Reads and Mean Reads per Cell), and Barcode sequencing quality (Valid Barcode, Q30).
Number of Cells with Unique Center
- Definition: The number of valid cell Barcodes that can be successfully calculated and assigned a unique spatial center coordinate (Cell Center) during the spatial positioning process.
- Calculation Method: For Barcodes determined as valid cells, the system estimates the cell center by combining the physical distribution and clustering features of their corresponding Spatial Barcodes on the chip. If the distribution can fit a uniquely clear center coordinate, the cell is included in this count.
- Interpretation: This metric reflects the accuracy of cell positioning on the spatial chip. Ideally, this value should reach over 50% of the Estimated Number of Cells (RNA).
- If the proportion of this value is low: It usually indicates ambiguity or scatter in spatial Barcode positioning. It is recommended to check the Accurate Spatial UMIs and Mean Spatial UMIs per Cell metrics in the Spatial module to investigate abnormal conditions like spatial signal diffusion.
Number of Cells Under Tissue Coverage
- Definition: The number of valid cell Barcodes that ultimately fall within the recognized Tissue Covered Area and have a unique center point.
- Calculation Method: After completing image registration and tissue area determination, the system further filters out cells from the "cells with unique center" set whose center coordinates are located within the tissue polygon contour.
- Interpretation: This metric directly represents the true scale of cells "actually usable for spatial expression quantification and downstream spatial feature analysis".
- If this value is much lower than the Number of Cells with Unique Center: It means a large number of identified cells are scattered outside the tissue area. Focus on checking whether tissue contour recognition is accurate, whether there is a severe misalignment between the image and the spatial point array (can be checked via Adjustment), and whether the section tissue failed to completely cover the effective capture area of the chip.
Median Genes per Cell
- Definition: Among the valid cells within the tissue coverage, the median number of different genes detected per cell.
- Calculation Method: Aggregate the gene expression matrix of all cells within the tissue coverage, count the number of genes with at least 1 UMI count per cell, and take the median of this distribution across all cells.
- Interpretation: This metric is a core standard for evaluating the detection sensitivity of the RNA library and the complexity of single-cell information. A higher value generally indicates better library quality and sufficient sequencing depth, capturing more low-to-medium abundance transcripts.
- If cell count is sufficient but this metric is low: It is recommended to troubleshoot in this order: (1) Is sequencing depth insufficient (check Mean Reads per Cell, or if the downsampling curve hasn't reached a plateau); (2) Is there severe RNA degradation (judge based on the mapping rate, Too Short proportion, and abnormal exon/intron distribution in the Mapping module); (3) Are the cells themselves of poor quality or is ambient RNA contamination severe (check if Fraction Reads in Cells has decreased).
Median UMI per Cell
- Definition: Among the valid cells within the tissue coverage, the median total number of UMIs contained per cell.
- Calculation Method: Aggregate the expression matrix of all cells within the tissue coverage, count the total number of UMIs assigned to each cell, and take the median of this distribution across all cells.
- Interpretation: This metric reflects the overall transcript molecular abundance captured by a single valid cell, serving as a direct reflection of library conversion efficiency and overall expression levels. It generally correlates positively with Median Genes per Cell.
Mean Reads per Cell
- Definition: Reflects the scale of sequencing data volume allocated on average to each valid cell within the tissue coverage.
- Calculation Method: Total valid Reads in the RNA library (Number of Reads) divided by the number of valid cells within the tissue coverage (Number of Cells Under Tissue Coverage).
- Interpretation: This metric does not refer to the absolute number of Reads actually captured within the cell, but is used to macroscopically assess whether the current overall sequencing depth is sufficient. Increasing this value generally helps improve Median Genes/UMI.
- Note: This metric is not always better when higher. If the Mean Reads per Cell is already very high, but the improvement in Median Genes/UMI tends to stagnate, and Sequencing Saturation is approaching saturation, it indicates that the library complexity has reached its limit or the proportion of duplicate sequence reads is too high, and the informational gain from further increasing sequencing volume is limited.
Fraction Reads in Cells
- Definition: Among the Reads successfully mapped to the reference genome and assigned to known gene annotation regions, the proportion of Reads ultimately belonging to valid cells within the tissue coverage.
- Calculation Method: The sum of gene count Reads assigned to cells within the tissue coverage divided by the sum of all Reads successfully mapped to the genome and transcript annotation regions.
- Interpretation: This metric measures the purity of "valid single-cell signals" in the sequencing data and is an important standard for evaluating Ambient RNA contamination and background noise.
- If this proportion is low: It usually indicates a high amount of background free RNA. Common causes include cell rupture, too few truly valid cells within the tissue coverage, or improper cell calling thresholds (too broad or too strict).
Total Genes Detected
- Definition: The total number of non-redundant (distinct) genes cumulatively detected across the entire population of valid cells within the tissue coverage.
- Calculation Method: Merge the expression matrices of all cells within the tissue coverage and count the number of unique genes that have at least 1 UMI count across the entire population.
- Interpretation: This metric reflects the breadth of the transcriptome that can be covered by the entire spatial sample at the current sequencing depth. Its value is significantly influenced by species characteristics, tissue type complexity, and sequencing depth. It usually needs to be comprehensively evaluated in conjunction with the total cell count and per-cell metrics.
- If the valid cell count is sufficient but the total gene count remains low: It is recommended to focus on checking whether the reference genome/annotation file versions match, whether the overall genome mapping rate is normal, and the RNA integrity of the sample itself.
RNA Metrics
This section displays the sequencing quality, mapping status, and key quantitative metrics of the single-cell transcriptome library, used to evaluate the overall quality and usability of the RNA data, and to assist in judging whether it meets the needs of downstream spatial analysis.
RNA Library (Sequencing & Barcode Quality)
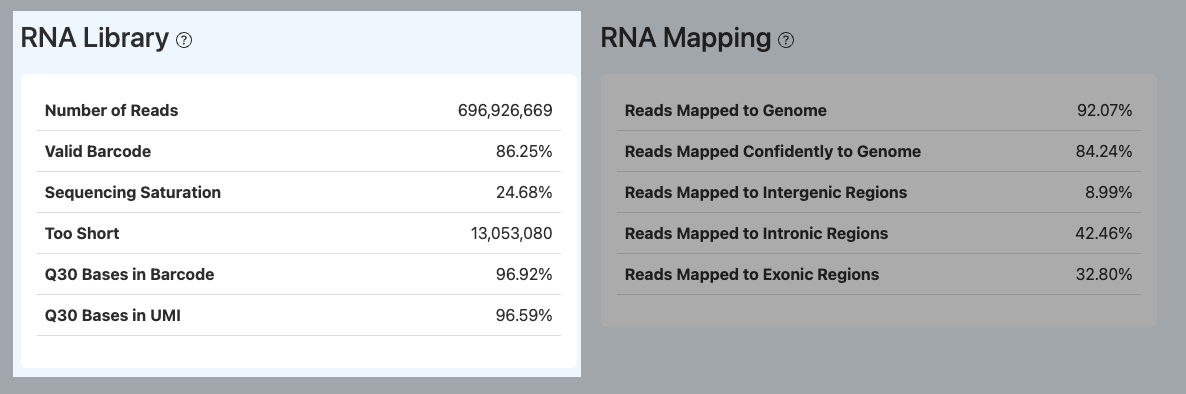
Number of Reads
- Definition: The total number of valid RNA reads retained after fastp quality control.
- Interpretation: This metric reflects the effective sequencing data scale available for subsequent analysis after QC, which is the foundational input for downstream analysis. It generally needs to be judged comprehensively alongside the valid Barcode proportion, Fraction Reads in Cells, and sequencing saturation, to avoid evaluating data validity based solely on absolute sequencing volume.
Valid Barcode
- Definition: Among the sequencing reads of the RNA library, the proportion of reads whose Barcode sequence can accurately match the known cell whitelist.
- Calculation Method: Count the number of reads whose Barcode sequences successfully match the whitelist either directly without error correction or after allowing limited base error correction, and divide by the total Number of Reads.
- Interpretation: This metric reflects Barcode synthesis quality, sequencing accuracy, and whitelist matching. It is generally recommended to be > 80% (or at least not lower than 75%). When this metric is low, it is recommended to analyze it together with the Barcode Q30 value and Fraction Reads in Cells to distinguish sequencing quality issues from the impact of library structure or mismatched whitelist parameters.
Sequencing Saturation
- Definition: Used to evaluate the degree to which transcript molecules in the library are repeatedly sequenced at the current sequencing depth.
- Calculation Method: Sequencing Saturation = 1 − (Number of unique UMIs / Number of reads available for UMI counting).
- Interpretation: This metric is used to reflect the relationship between sequencing depth and library complexity. An increase in saturation indicates an increasing proportion of duplicate molecules in newly added sequencing reads, meaning further deepening of sequencing will yield limited improvement in new molecular information; whereas a low saturation indicates that many molecules in the library remain insufficiently sampled, and increasing sequencing depth will still help acquire more new transcript information.
Too Short
- Definition: The number and proportion of reads filtered out because their sequence length fell below the minimum retention threshold (e.g., < 60 bp) after adapter removal or trimming.
- Interpretation: This metric reflects the insert fragment length and structural integrity in the RNA library. When this proportion is high, it usually indicates excessive adapter remnants, short insert fragments, or fragment degradation during library construction, which may further affect subsequent mapping efficiency and quantitative analysis results.
Q30 Bases in Barcode / Q30 Bases in UMI
- Definition: Among the valid reads of the RNA library, the proportion of bases in the Barcode and UMI sequences whose sequencing quality value (Phred score) reaches or exceeds Q30 (i.e., base calling error rate ≤ 0.1%).
- Interpretation: This metric reflects the sequencing quality level of the core tag sequences. A higher Q30 proportion indicates higher reading accuracy, helping to improve the identification rate of valid Barcodes and the accuracy of UMI molecular deduplication; when this metric is low, it will directly pull down the Valid Barcode proportion and indirectly affect the reliability of cell identification and transcript quantification.
RNA Mapping
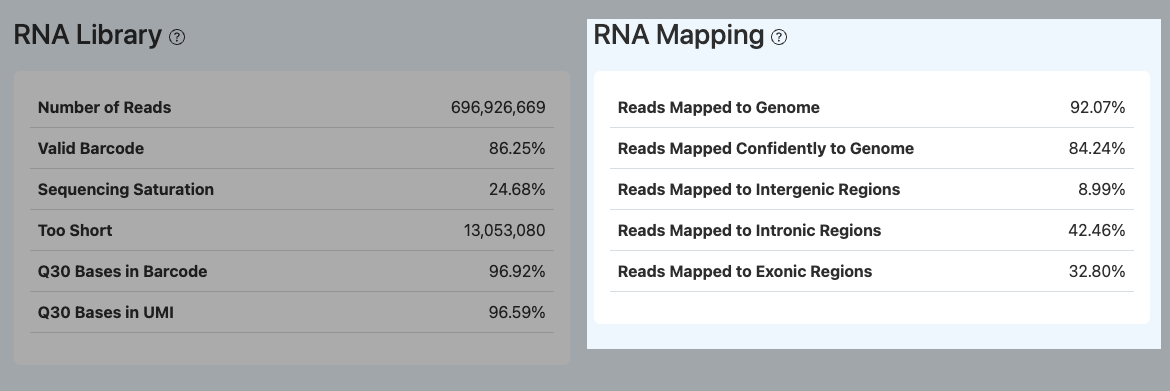
Reads Mapped to Genome
- Definition: Among the RNA reads participating in genome mapping, the proportion of reads successfully mapped to the reference genome (including unique and multiple mappings).
- Interpretation: This metric reflects the matching between valid RNA reads and the reference genome, as well as library specificity. A high mapping rate usually indicates a clear sample origin and a reasonable reference genome selection (generally recommended > 80%). When the mapping rate is low, it may be related to sample contamination (such as microorganisms or other species), a high proportion of low-complexity sequences, poor read quality, or mismatched reference genome versions.
Reads Mapped Confidently to Genome
- Definition: Among the RNA reads participating in genome mapping, the proportion of reads that can uniquely map to reference genome locations with high confidence.
- Interpretation: This metric reflects the proportion of reads usable for reliable gene expression quantitative analysis. When the unique mapping rate is low (e.g., below 50%), it may be related to a high proportion of repetitive sequences, insufficient sequencing quality, or mismatched reference genomes, directly impacting the stability of downstream quantitative analysis.
Reads Mapped to Exonic / Intronic / Intergenic Regions
- Definition: Among the RNA reads successfully mapped to the reference genome, the respective proportions of reads mapped to annotated exonic, intronic, or intergenic regions.
- Interpretation:
- Exonic: Reflects the enrichment level of mature mRNA signals. A high proportion generally indicates good mature transcript signals, which is beneficial for gene expression quantification.
- Intronic: Reflects the proportion of unspliced or nuclear RNA signals. An elevated proportion may be related to excessive nuclear RNA extraction, active unspliced transcription, or the
include intronsparameter being enabled during analysis. - Intergenic: Reflects the proportion of reads falling outside known gene annotation regions. An elevated value requires alertness to incomplete genome annotations, mismatched reference versions, non-coding transcripts, or non-specific mapping/contamination.
Spatial Metrics (Spatial Library & Positioning)
This module primarily evaluates the structural integrity of the spatial sequencing library, the positioning accuracy and complexity of the Spatial Barcodes, and the consistency between spatial signals and transcriptome cell calling. It is the core component determining the quality and usability of spatial transcriptomics data.
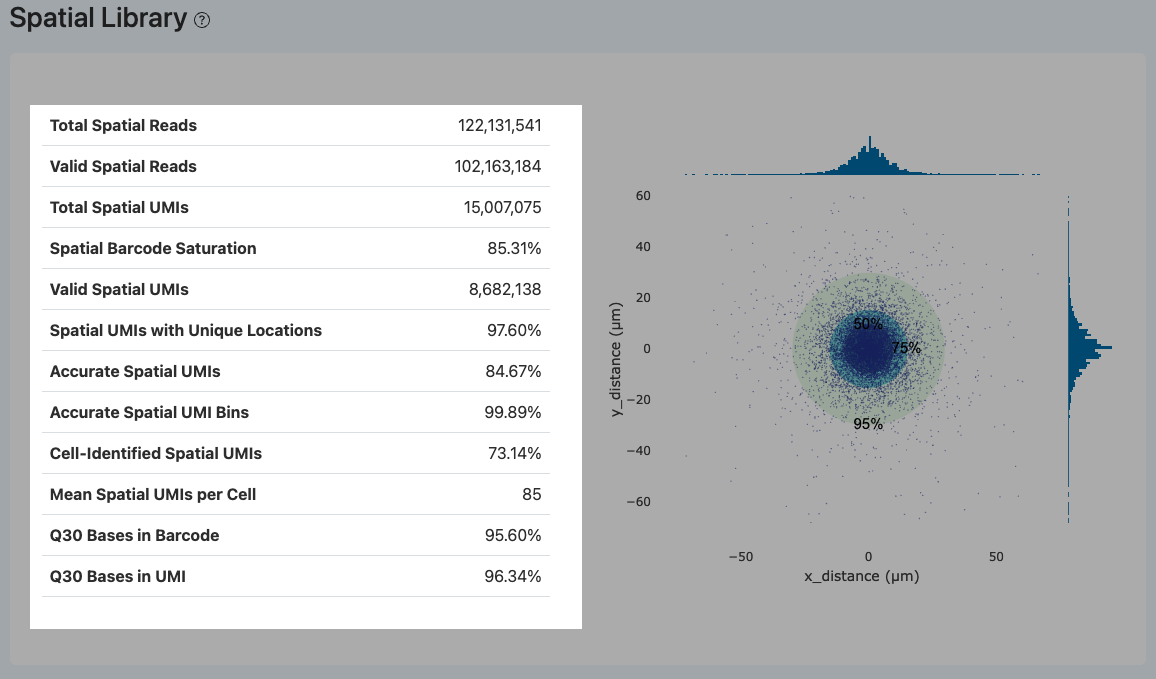
Total Spatial Reads
- Definition: The total number of raw reads generated in the spatial sequencing library.
- Interpretation: This metric reflects the foundational sequencing data volume of the spatial library and serves as the baseline for evaluating sequencing depth and subsequent usable data conversion.
Valid Spatial Reads
- Definition: The number of reads meeting the specified structure of the spatial library and their proportion among total reads.
- Calculation Method: Count the number of reads where Read 1 contains a valid cell Barcode and Read 2 has a length of at least 32 bp to allow successful extraction of the Spatial Barcode.
- Interpretation: This metric directly reflects the basic structural usability of the spatial library's sequencing data.
- If this proportion is significantly low: It usually indicates incorrect sequencing read length settings, mismatched library structures, poor sequencing quality, or abnormal fragments mixed in during library construction.
Total Spatial UMIs
- Definition: The total number of independent spatial UMI molecules obtained after extracting from valid spatial reads and performing molecular tag (UMI) deduplication.
- Calculation Method: Deduplicate and count reads with identical (Cell Barcode, UMI, Spatial Barcode) combinations.
- Interpretation: Reflects the overall captured information volume of the spatial library. This value is the absolute number of molecules after preliminary deduplication, but it still needs to be combined with subsequent positioning accuracy metrics to evaluate its actual valid spatial signal.
Spatial Barcode Saturation
- Definition: A metric reflecting spatial library complexity, used to evaluate whether further increasing the sequencing data volume under the current library complexity can effectively yield new spatial UMI molecules.
- Calculation Method: Spatial Barcode Saturation = 1 - (Total Spatial UMIs / Valid Spatial Reads).
- Interpretation:
- Higher value: Indicates a high proportion of PCR duplicates in the sequencing reads, meaning the library is approaching saturation and the marginal benefit of deeper sequencing is limited.
- Lower value: Indicates high remaining library complexity. If the number of spatial UMIs is insufficient, deeper sequencing can effectively increase the spatial information content.
Valid Spatial UMIs
- Definition: The number of UMIs possessing a valid spatial Barcode, meaning they can successfully match known spatial locations within the chip library (HDMI library).
- Interpretation: This metric reflects the scale of molecules that can establish an initial spatial correspondence.
- Low proportion: Common causes include suboptimal spatial library construction or short read fragments from the expression library mistakenly mixing into the spatial library. Joint investigation with structural QC metrics like Valid Spatial Reads and Too Short is recommended.
Spatial UMIs with Unique Locations
- Definition: Among valid spatial UMIs, the proportion whose spatial Barcode can unambiguously map to a single physical coordinate location on the chip.
- Interpretation: If a spatial barcode lacks uniqueness, the corresponding UMI cannot be reliably assigned to a true spatial coordinate and will be filtered out.
- Low proportion: Suggests high ambiguity in spatial barcodes, which will severely impact the accurate estimation of cell center points and the faithful reconstruction of spatial gene expression.
Accurate Spatial UMIs
- Definition: Among valid spatial UMIs, the proportion determined to be "accurate spatial UMIs" after spatial grid filtering to remove distinct aggregation artifacts.
- Calculation Method: The entire chip area is divided into regular grids (bins), and the UMI count within each bin is calculated. If a bin's UMI density exceeds 20 times the average density of all bins, it is flagged as a technical artifact or contamination and excluded. The remaining UMIs are counted as accurate spatial UMIs.
- Interpretation: This metric is designed to filter out potential localized systemic artifacts on the spatial side.
- Low proportion: Usually indicates abnormal physical aggregation of spatial signals. Comprehensive troubleshooting requires checking Accurate Spatial UMI Bins and the spatial distance distribution plot.
Accurate Spatial UMI Bins
- Definition: After dividing the chip into grids (bins), the proportion of bins determined to be "accurate" (non-artifact) out of all bins via artifact detection.
- Calculation Method: Accurate Spatial UMI Bins = Accurate Bins Counts / Total Bins Counts.
- Interpretation: This metric assesses whether the spatial signal is evenly and reliably distributed from a macroscopic spatial scale.
- Low proportion: Clearly points to abnormal physical aggregation of spatial signals, reflecting potentially severe local contamination or positioning errors.
Cell-Identified Spatial UMIs
- Definition: Among accurate spatial UMIs, the proportion of UMIs carrying a cell Barcode that has also been successfully identified as a "valid cell" in the transcriptome (RNA) library.
- Interpretation: This metric measures the concordance between cell identification and spatial positioning across the multi-omics data.
- Low proportion: May suggest that the RNA-side cell calling threshold is inappropriate (too broad or too strict), spatial positioning signals are unstable, or there is a significant mismatch in data quality and cell capture efficiency between the two libraries.
Mean Spatial UMIs per Cell
- Definition: The average number of accurate spatial UMIs allocated to each cell, calculated across all Barcodes identified as valid cells.
- Calculation Method: Calculate the average number of spatial UMIs for all Barcodes that have accurate spatial UMIs and are identified as cells.
- Interpretation: Directly reflects the richness of spatial information at the single-cell resolution. A low value will lead to inaccurate cell positioning or cause some cells to fail to compute a unique center.
- Troubleshooting: It can be combined with the "proportion of cells with a unique center among RNA cells" (e.g., Number of Cells with Unique Center related metrics) to comprehensively determine whether it is an anomaly in spatial library construction.
Q30 Bases in Barcode / UMI (Spatial Side)
- Definition: Among the sequencing reads of the spatial library, the proportion of bases in the spatial Barcode and UMI sequences whose quality score reaches or exceeds Q30 (i.e., base calling error rate ≤ 0.1%).
- Interpretation: A high Q30 proportion typically indicates higher accuracy in reading spatial Barcodes and UMIs. This not only helps improve the identification rate of valid spatial Barcodes and the stability of spatial positioning, but also enhances the accuracy of UMI molecular deduplication; when this metric is low, it will directly cause a decrease in the Valid Spatial Reads proportion and affect the reliability of downstream spatial quantitative results.
Distance Distribution
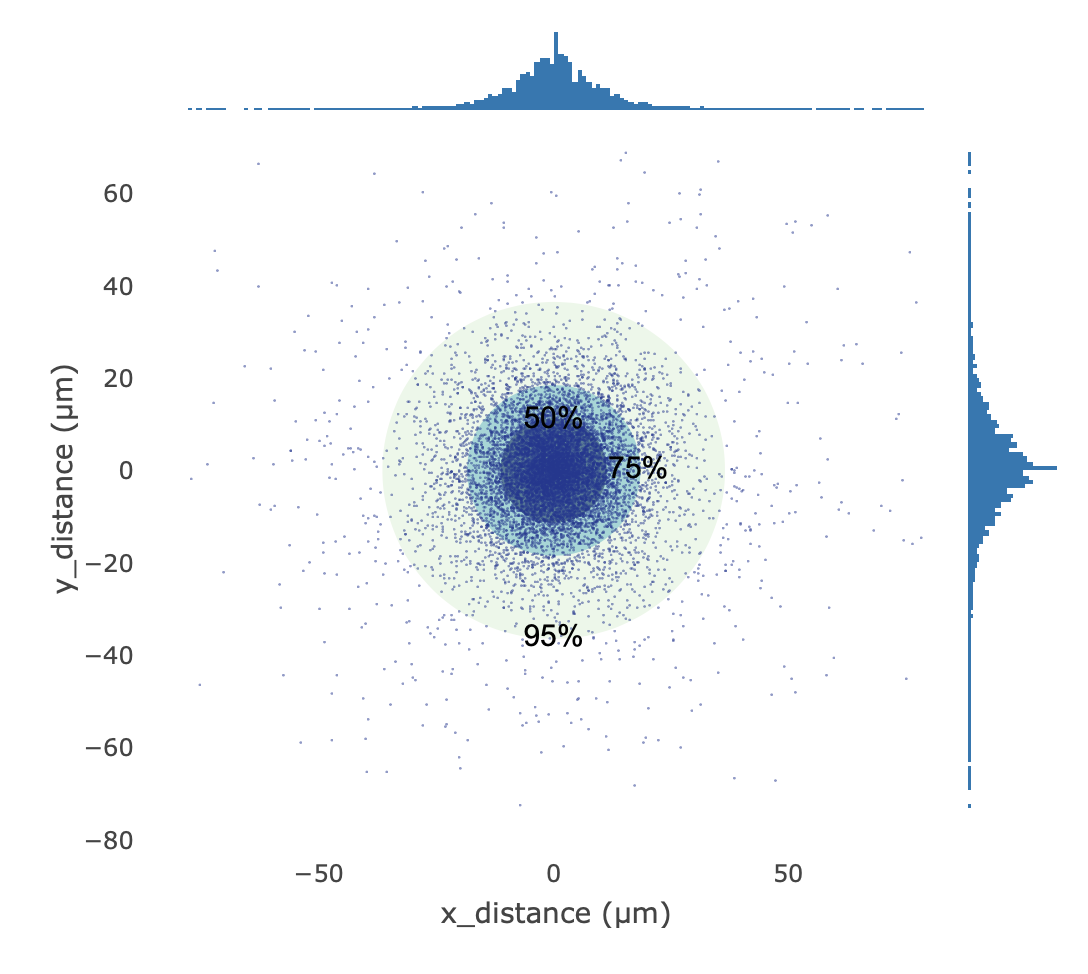
- Definition: Taking the estimated center point of each identified cell as the coordinate origin, this plots the distribution of physical offset distances of its corresponding spatial Barcodes / UMIs relative to its center.
- Calculation Method: A random sample of up to 10,000 spatial Barcode coordinate points across all cells is taken. Their X/Y axis offsets relative to their respective cell centers are calculated and converted from pixels to actual physical distance using a specific coefficient (e.g., 0.265385 µm/pixel). Three concentric probability circles (50%, 75%, and 95%) are used to help delineate the dispersion of the data points.
- Interpretation: Used to visually evaluate the convergence and positioning stability of the cell center estimation.
- Ideal state: The concentric circles are small and the data points are highly concentrated at the center, indicating extremely stable spatial positioning and center estimation.
- Abnormal state: If the point cloud is significantly elongated or collectively shifted away from the origin, it suggests a potential overall misalignment between the tissue section and chip positioning, or a systemic bias in the cell center estimation algorithm due to anomalous signal distribution.
Sequencing Depth and Saturation Analysis
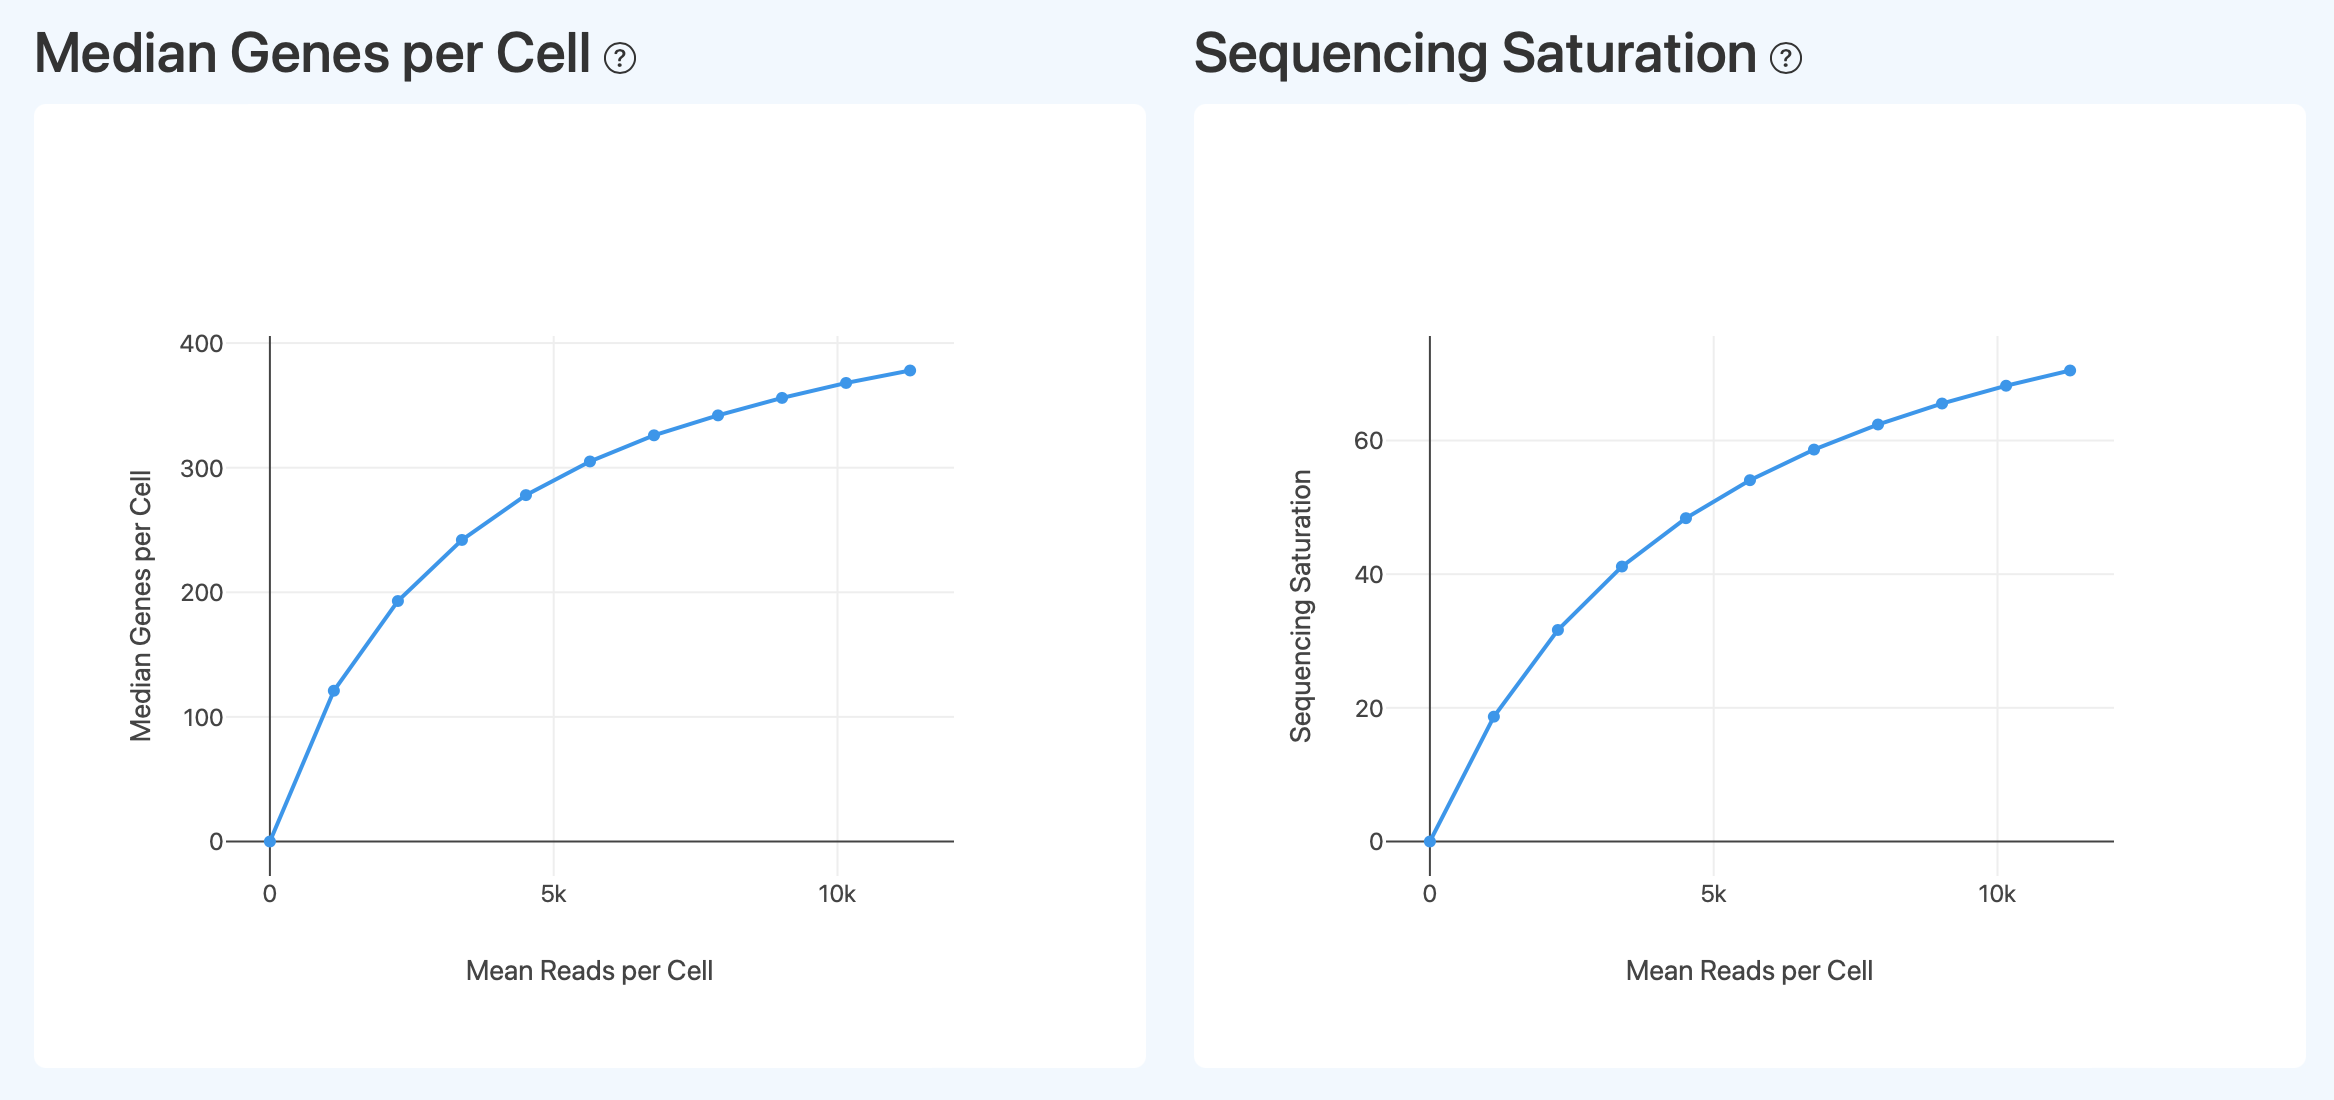
Median Genes per Cell (Sequencing Depth and Gene Detection Capability)
- Definition: Based on downsampling the RNA sequencing data, this shows the relationship of the single-cell Median Genes per Cell under different Mean Reads per Cell conditions. The horizontal axis represents the average number of sequencing reads allocated per cell, and the vertical axis represents the median number of genes detected under the corresponding conditions.
- Interpretation: This plot is used to evaluate the impact of sequencing depth on the gene detection capability of the single-cell transcriptome and its saturation trend. Generally, as the sequencing reads allocated to each cell increase, the number of genes that can be detected rises accordingly. When the curve gradually flattens out, it indicates that the marginal benefit of additional sequencing reads on the number of genes detected is diminishing. This trend can be used to determine whether the current sequencing depth is approaching the limit of the library's complexity and to provide a reference for whether further sequencing depth is required.
Sequencing Saturation (Relationship Between Sequencing Depth and Duplication Rate)
- Definition: Based on downsampling the RNA sequencing data, this shows the trend of Sequencing Saturation relative to the input of sequencing data under different sequencing depth conditions. The horizontal axis represents the level of expression information content after downsampling (using the single-cell level gene detection status as a reference), and the vertical axis represents the sequencing saturation, which reflects the proportion of duplicated sequenced molecules.
- Interpretation: This plot is used to evaluate the relationship between sequencing depth and library complexity. As sequencing depth increases, sequencing saturation typically rises progressively, indicating an increasing proportion of duplicated molecules among the newly added reads. When the curve flattens out, it indicates that further increasing the sequencing depth will yield limited marginal benefits in acquiring new transcript molecular information. This trend should be interpreted in conjunction with the downsampling curves for gene or UMI counts to comprehensively judge whether the current sequencing depth is approaching the upper limit of the library's complexity.
Barcode Rank Plots
These plots are used to visually evaluate whether the cell calling boundary is reasonable, similar to a "barcode rank plot."
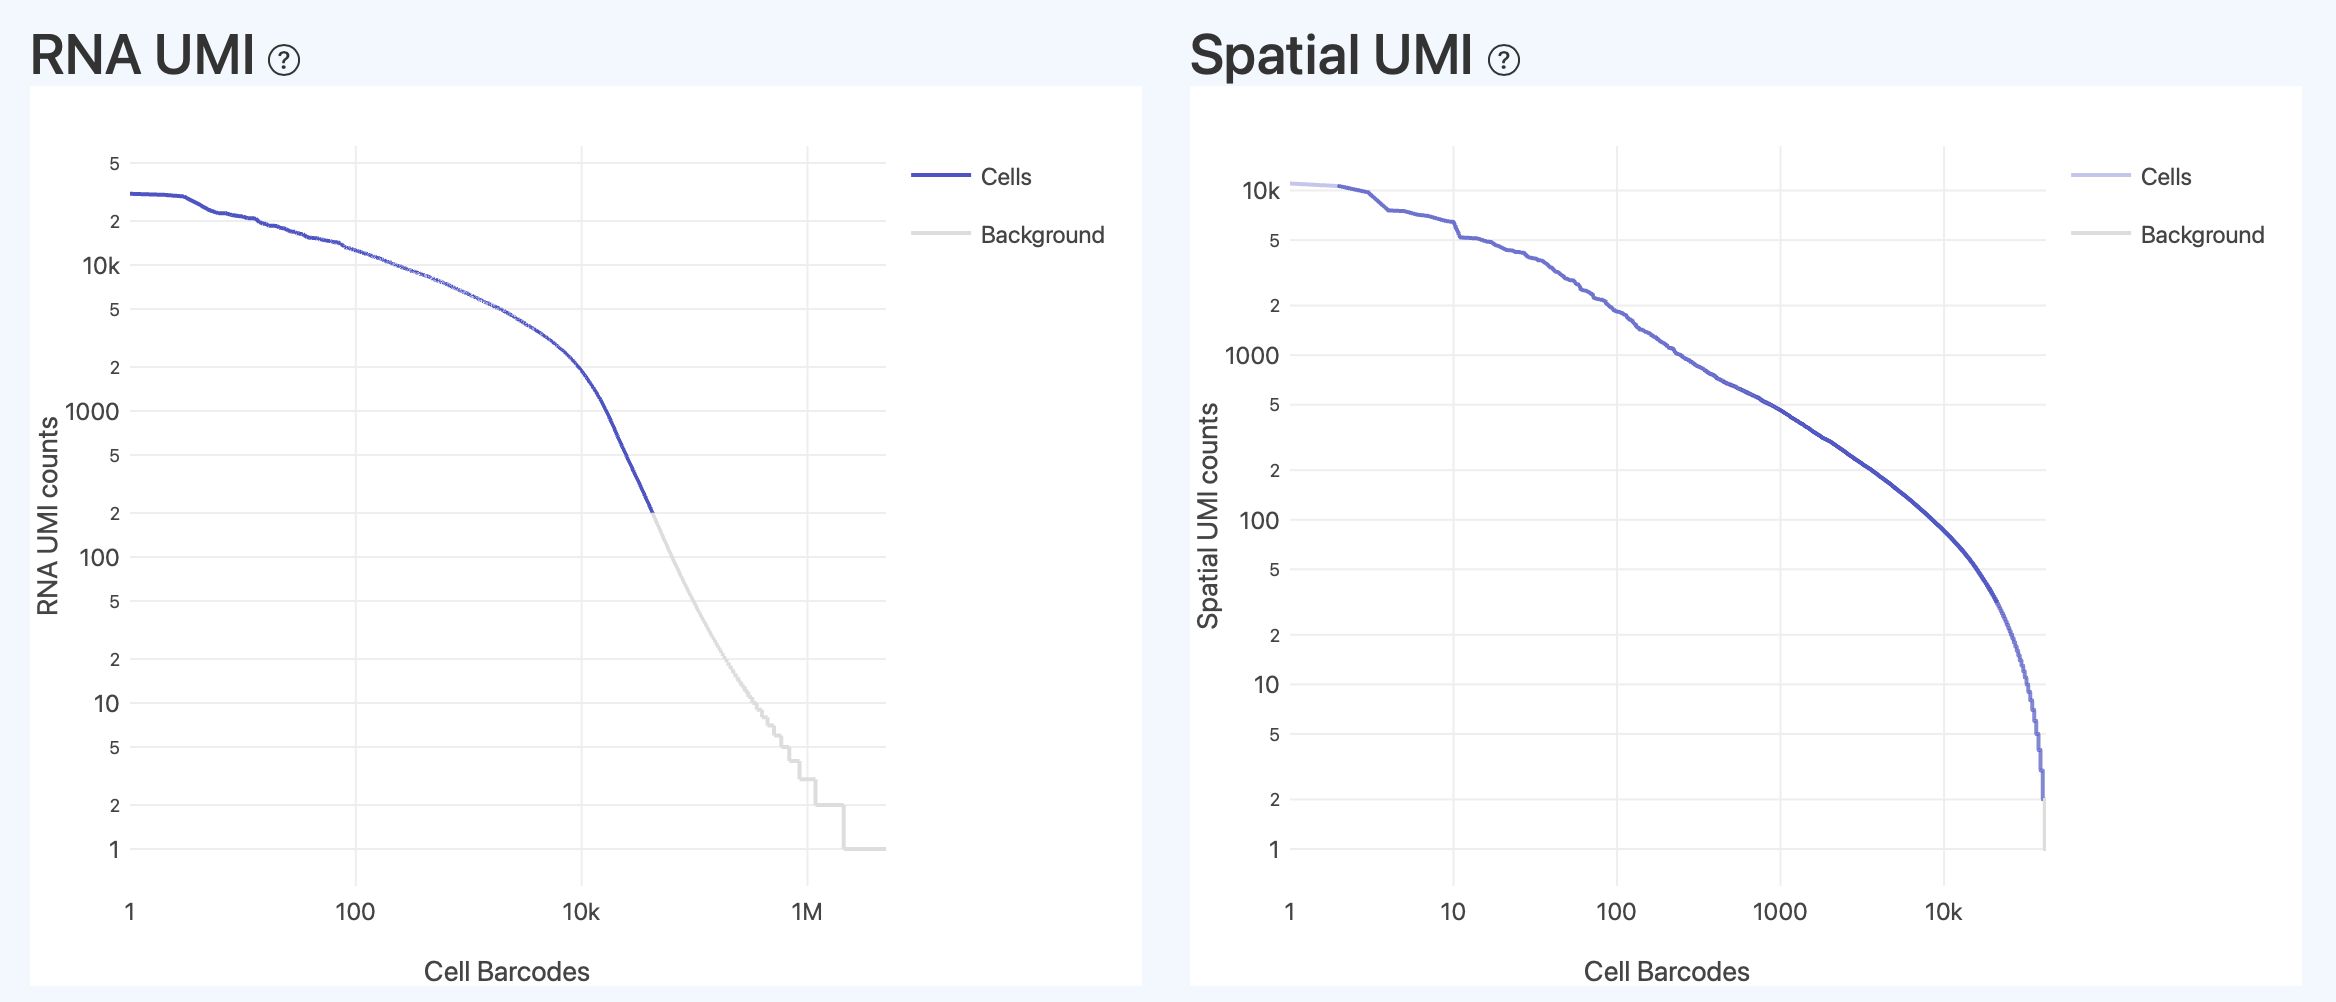
RNA UMI (RNA Barcode UMI Rank)
- Definition: This plot displays the distribution of counting metrics (e.g., UMI counts) used for cell identification in the RNA library analysis workflow for all Barcodes, sorted from highest to lowest count. The horizontal axis represents the sorted Barcodes (rank position), and the vertical axis represents the corresponding count level. Different colors are used to distinguish Barcode populations classified as valid cells (Cells) and background (Background).
- Interpretation: This plot is used to visually inspect the overall separation of count intensity distributions among different types of Barcodes during the cell identification process.
- Distribution Trend: The region with higher count intensity is mainly composed of Barcodes related to valid cells, while in the region with lower count intensity, the proportion of Background Barcodes gradually increases.
- Cell Curve: Its coverage range within the overall distribution can be used to observe the position and scale of the valid cells (which passed the filtering and are used for downstream analysis) among all Barcodes.
- Overall Verification: The ideal shape typically presents a "steep drop + long tail background," with a relatively clear boundary between the cell region and the background region. The distribution relationship of different types of Barcodes in high and low count intensity regions, along with the overall curve shape, serves as a visual verification of the rationality of the cell identification and filtering results. If the transition zone is too long or cells/background are severely mixed, it suggests that cell calling may be unstable, requiring comprehensive judgment combined with metrics like Fraction Reads in Cells and Median Genes/UMI.
Spatial UMI (Spatial Barcode UMI Rank, HDMI/Spatial)
- Definition: This plot displays the distribution of counting metrics (e.g., spatial-side UMI counts) in the spatial library analysis workflow for all Barcodes, sorted from highest to lowest count. The horizontal axis represents the sorted Barcodes (rank position), and the vertical axis represents the corresponding spatial-side count level. Different colors are used to distinguish Barcode populations classified as "Cells with unique center" and background/invalid positioning.
- Interpretation: This plot is used to visually inspect the distribution differences of spatial signals across Barcodes, as well as the effectiveness of spatial positioning filtering.
- Distribution Trend: The region with extremely high count intensity typically represents abnormal cells (excessively strong spatial signals often indicate cluttered or noisy spatial signals). Normal cells with a unique valid center are mostly distributed in the intermediate count range, while the very low count intensity long-tail region mainly consists of background or scattered spatial signals.
- Positioned Cell Curve: Its coverage range within the overall distribution reflects the scale of the cell population for which a unique center coordinate could be successfully estimated.
- Overall Verification: This can be used to judge whether spatial information is healthily concentrated within the valid cell population. If the shape of the spatial UMI rank curve is severely inconsistent with the distribution trend, it may suggest abnormal spatial positioning, necessitating a joint check of spatial QC metrics like Valid/Accurate Spatial UMIs and Unique Locations.
Analysis (Dimensionality Reduction, Clustering, and Expression Display)
The Analysis module is used to check whether "downstream results are reasonable," but its credibility depends on whether the preceding QC metrics are met. At the same time, the right side of the page provides interactive filtering and statistical tools to facilitate dynamic exploration of data distribution.
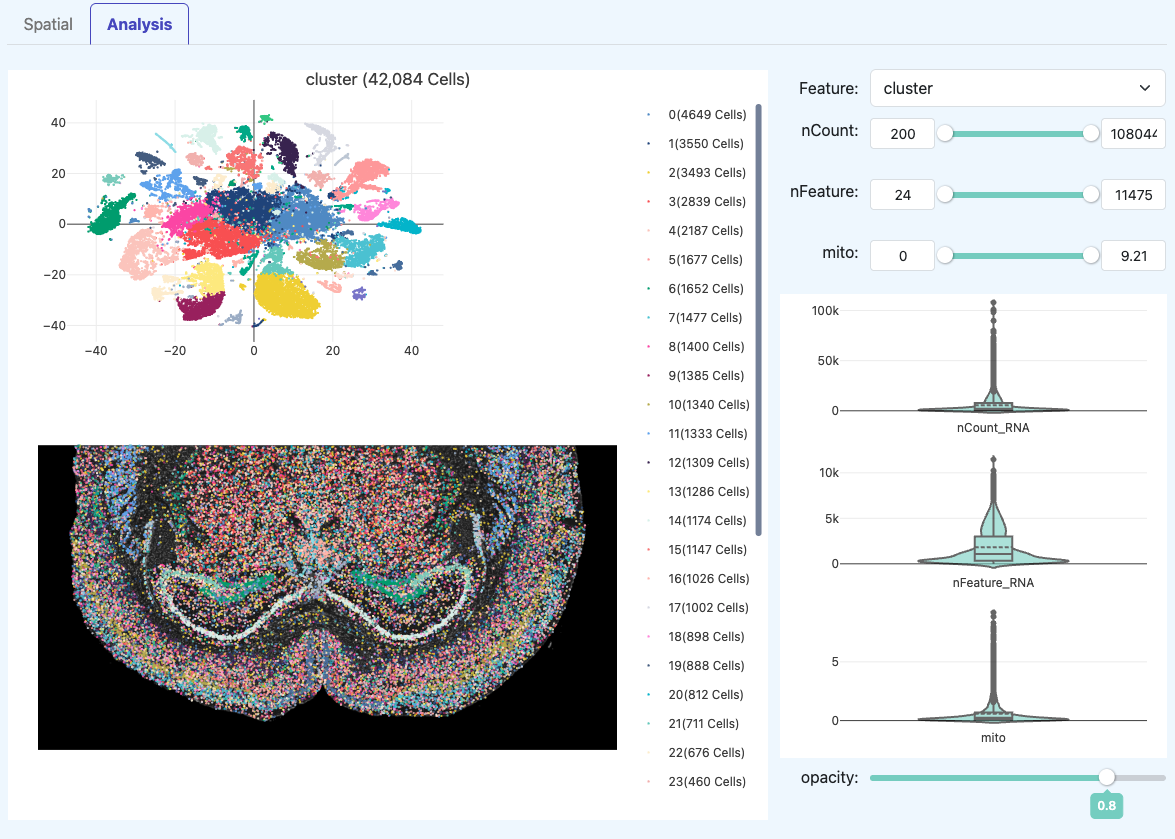
t-SNE Plot (RNA)
- Definition: A two-dimensional visualization of dimensionality reduction (e.g., t-SNE) and clustering performed on valid cells.
- Interpretation: Clear separation of clusters usually indicates that cellular heterogeneity has been captured. If everything is blurred together: It could be due to insufficient data depth/complexity, or the sample itself may be of a single type; must be judged alongside QC metrics.
Tissue Spatial Distribution Plot (Spatial)
- Definition: Maps cluster labels back to tissue spatial coordinates to observe the location and morphology of different clusters within the tissue.
- Interpretation: If spatial distribution clearly aligns with tissue structure, it usually supports data usability.
- If points are generally offset or inconsistent with tissue contours: Prioritize performing Adjustment calibration and rerun.
Interactive Exploration Tools (Right Panel)
- Definition: Provides interactive exploration capabilities to switch different feature distributions in the same embedding space.
- Interpretation:
- Feature Dropdown Menu: Select different attributes (such as
cluster,nCount,nFeature,mito, etc.) to switch the coloring basis of the distribution plot on the left. - Sliders: Adjust the display range of nCount, nFeature, mito, and the transparency (opacity) of cell points.
- Violin Plots: Dynamically displays the quality distribution characteristics of the selected cell population, assisting in judging anomalies in clustering or spatial regions.
- Feature Dropdown Menu: Select different attributes (such as
Marker Display and Differential Expression (DE) Table
- Definition: Displays classic marker genes for each cluster, and outputs differentially expressed gene tables by cluster (e.g., avg_log2FC, p_val_adj, etc.).
- Interpretation: If markers do not align with known biology: First rule out technical issues such as failed QC, cells mixed with background, or reference version errors before discussing biological explanations.
Manual Calibration (Adjustment)
After SeekSpaceTools QC analysis, the image and cell positions may not correspond correctly, requiring manual alignment with the DAPI image in the report.
Example of the operation area:
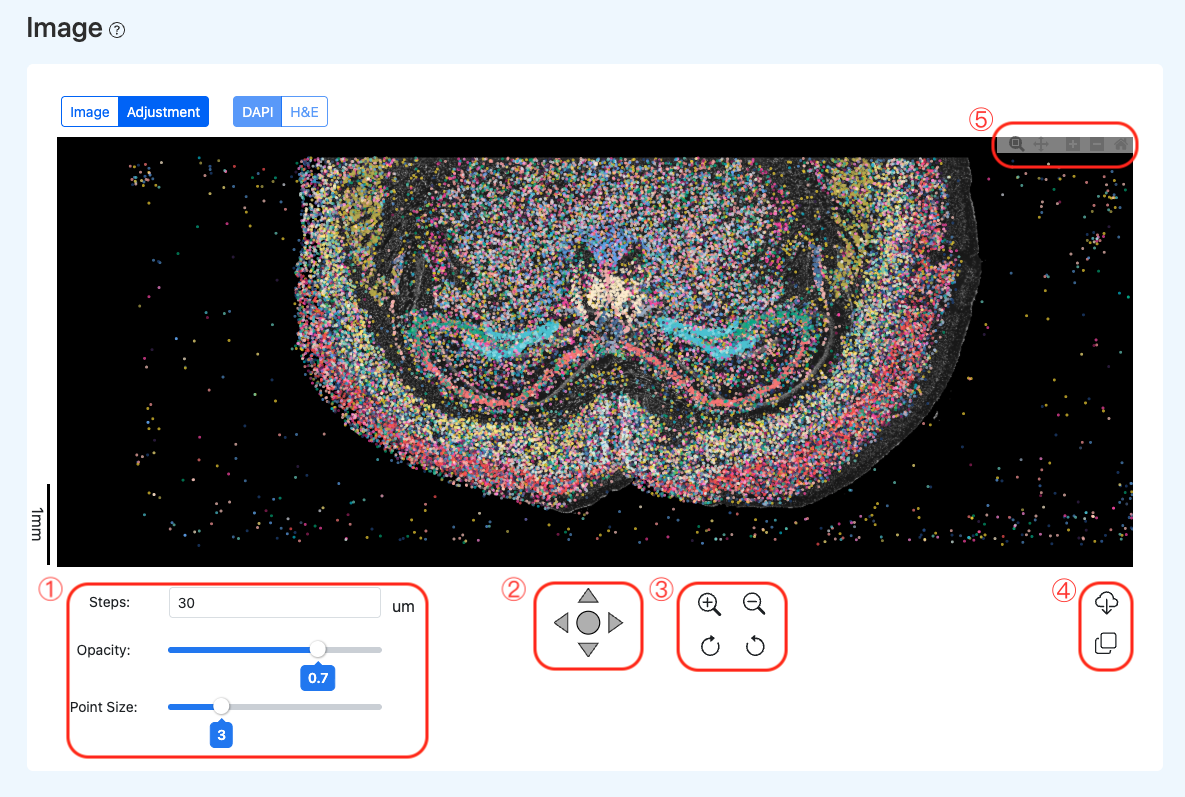
Calibration Tool Panel Features (corresponding to the red boxes in the example):
- Region 1: Visualization Settings
- Steps: Sets the translation step size, controlling the pixel distance the image moves per click for precise fine-tuning.
- Opacity: Adjusts the transparency of the spatial data points, allowing users to observe the underlying tissue morphology.
- Point Size: Modifies the display size of the spatial points to adapt to different image zoom levels.
- Region 2: Translation Controls: Directional controls to shift the underlying tissue image up, down, left, or right, enabling accurate alignment with the spatial data point array.
- Region 3: Background Scaling & Rotation: Provides zoom in/out functions for the underlying DAPI image, as well as clockwise/counterclockwise rotation adjustments to correct minor tilts and deformations of the tissue section during imaging (Note: this only applies to the background image for alignment purposes).
- Region 4: Export & Reuse
- Download: Downloads the calibration file (e.g., JSON format) containing the current alignment parameters to be used as input for subsequent re-analysis workflows.
- Copy: Copies the current calibration parameters to the clipboard with one click, facilitating documentation or reuse in batch processing.
- Region 5: Global View Zoom: Controls the zoom in and out of the entire view (including both the background image and spatial data points) to observe local alignment details (Note: distinct from Region 3, which only scales the background image).
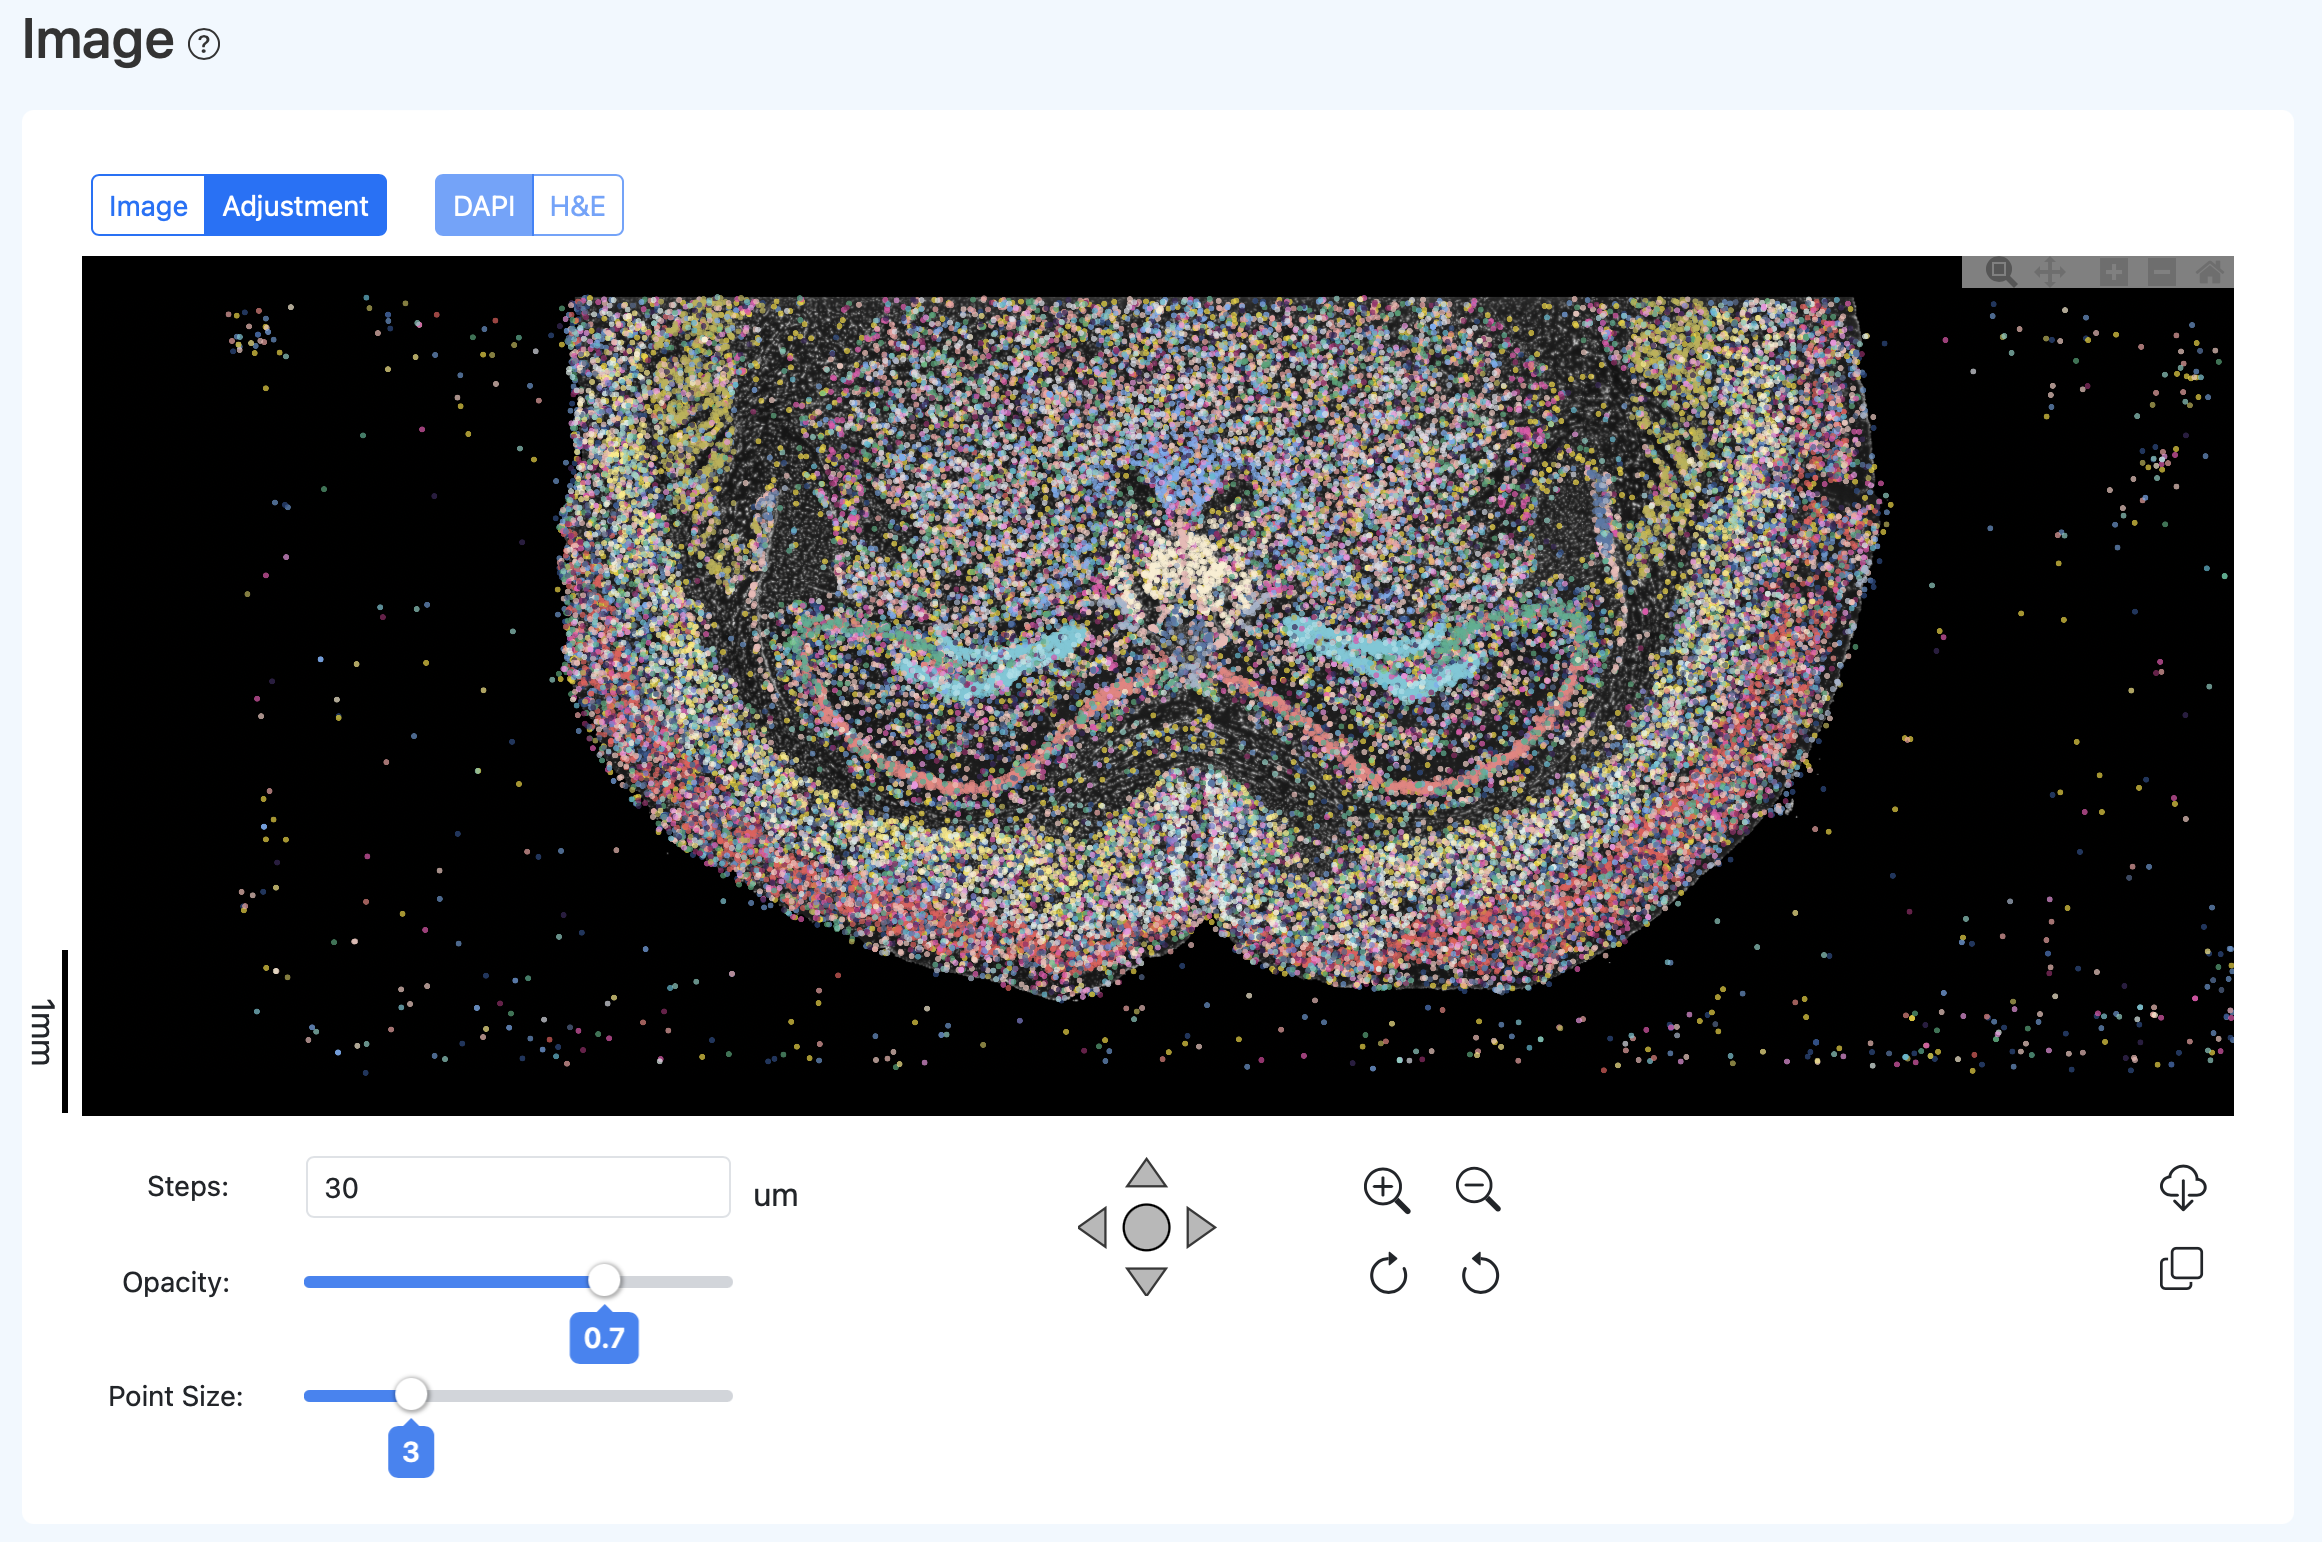
Suggested Calibration Workflow (Empirical Steps)
- Rough Alignment: You can first set Steps=50um, Opacity=0.2, Point Size=9. After making the cell points appear as a semi-transparent tissue shape, move/rotate/zoom the fluorescence image to roughly align the overall contour with the boundary of the cell point cloud.
- Fine Alignment: Zoom in on the global view, observe the overlap between cell points and nuclear fluorescence, and make small-step fine adjustments. The goal is for most cell points to overlap with nuclear fluorescence areas as much as possible.
Example of effect after calibration:
Regenerating the Report After Calibration
- Calculation Method:
- Download the adjustment parameter file;
- When re-running SeekSpaceTools realign, assign this file to
--alignment_fileand run the image calibration step; - Generate the calibrated report and related data.
Example after running again:

- Interpretation: Since cell capture is based on sections of the DAPI image rather than the HE image, the correspondence between cells and DAPI is usually more complete; HE may have some offsets, which is generally considered normal.