Standard Analysis for Single-Cell scATAC-seq & scRNA-seq Multi-omics: Differential Peak Analysis
Document Overview
Differential peak analysis is a crucial step for identifying chromatin accessibility differences among distinct cell populations and is essential for understanding cell type-specific regulatory mechanisms. This document systematically introduces the concept of peaks, methods to calculate differential peaks, motif enrichment analysis, annotation of genes near peaks, and functional enrichment analysis, helping researchers comprehensively decipher the biological significance of chromatin openness differences between cell types or states.
I. Core Concepts
(1) What are reads, fragments, and peaks?
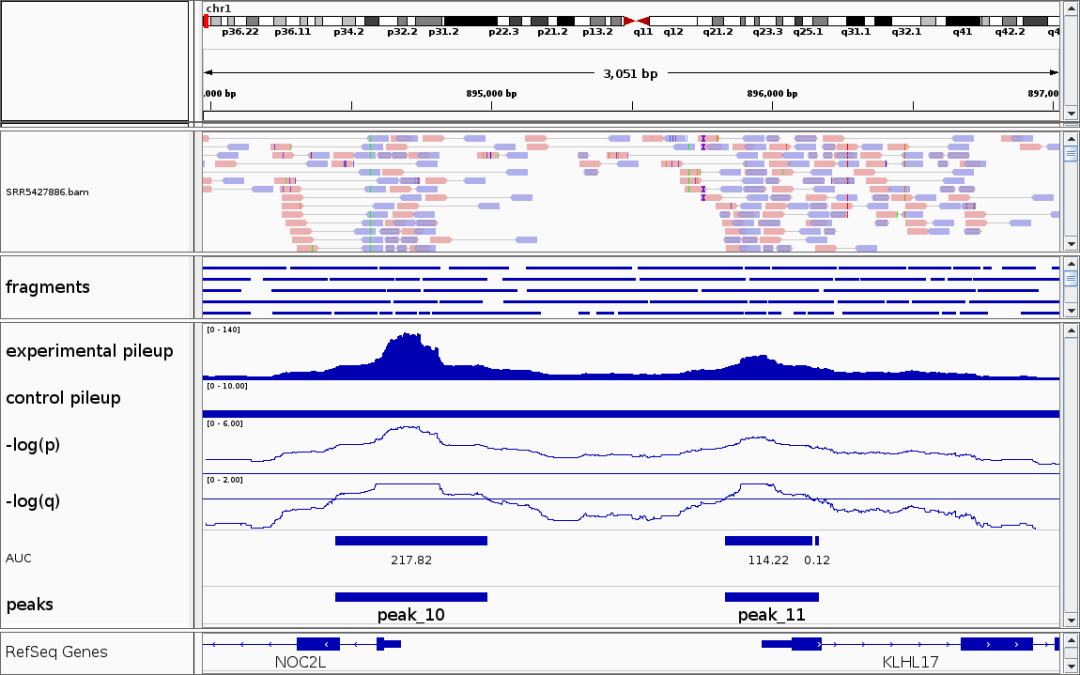
Before performing differential peak analysis of scATAC-seq data, it is important to understand several core terms: reads, fragment, and peak.
1) reads: The raw data produced directly by the sequencer, which are short DNA sequences. In paired-end sequencing, a DNA/RNA fragment generates two reads, one from each end, referred to as R1 and R2 respectively.
2) fragment: The original DNA molecule produced by the Tn5 transposase cutting at accessible regions of the genome in the experiment. In paired-end sequencing, a pair of matched reads (R1 and R2) can be used to locate a single fragment.
3) peak: On the genome, the starting positions of fragments (i.e., the Tn5 cut sites) tend to cluster densely in regions of open chromatin. After statistical analysis, these enriched regions are identified as significant "peaks".
TIP
- Fragments represent DNA pieces generated by Tn5 transposase making paired cuts at open chromatin regions in the genome, serving as direct evidence of chromatin accessibility.
- Peaks can be used to infer functional genomic regions. Each peak represents a region of open chromatin, typically associated with regulatory elements such as promoters or enhancers.
(2) Representation of Peaks
Unlike genes, which have predefined and uniformly assigned names, peaks are dynamically determined during analysis (e.g., during peak calling with tools such as MACS) based on statistical enrichment signals, and therefore have no unified names or identifiers. A commonly used standard format for representing peaks is “chromosome-start position-end position,” as shown below.
chr1:9792-10697
chr1:180738-181165
chr1:181194-181660
II. Differential Peak Analysis: Comparison Between Cell Groups
The core purpose of differential peak analysis is to systematically identify genomic regions that show higher or lower chromatin accessibility in specific groups by comparing the open chromatin regions (peaks) among different cell populations (such as different cell types, states, developmental stages, or disease-associated cells).
(1) Methods for Differential Peak Analysis
Taking Signac as an example, Signac uses the same FindMarkers() or FindAllMarkers() functions as in RNA differential analysis to detect differential peaks. The following example shows how to compute peaks that are differentially accessible in each cell group compared to all other groups.
# First, set the ATAC assay as the default
DefaultAssay(obj) <- "ATAC"

# Using the seurat_cluster clustering result as an example,
diff_peak_res <- FindAllMarkers(
  object = obj, # Assuming we have already normalized the ATAC data in obj
  group.by = "seurat_cluster", # Specify the cell grouping result; if not specified, defaults to Ident(obj)
  min.pct = 0.1,         # Detected in at least 10% of cells
  logfc.threshold = 0.25, # Minimum log2 fold change
  only.pos = TRUE,       # Keep only peaks more accessible in the target group
  test.use = "wilcox"    # Wilcoxon rank-sum test (default)
)
TIP
FindAllMarkers()is suitable for automatically comparing each cell group with all other groups in one batch to find differential peaks. It is especially ideal for comprehensive analysis across multiple groups (such as various cell types or states).FindMarkers()is suitable for direct comparison between two groups (e.g., disease vs. control), enabling flexible one-on-one differential peak screening and more precise analysis between specific groups.
(2) Results of Differential Peak Calculation
The table below shows the results of differential peak analysis for each cell group using the FindAllMarkers() function from the Signac package. Each row corresponds to a specific chromatin accessibility peak. These columns allow for systematic comparison of chromatin accessibility across different cell groups in various genomic regions, providing a data foundation for downstream functional annotation and regulatory mechanism exploration.
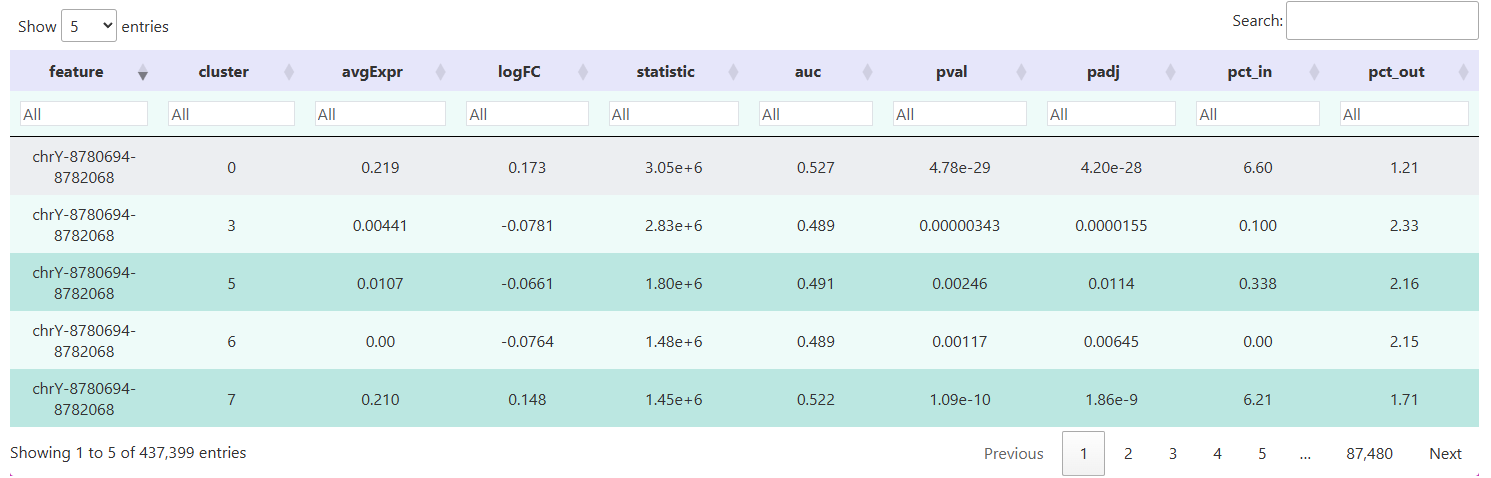
feature: Unique identifier of the differential peak.cluster: The corresponding cell group or cluster label, indicating the cell population in which each peak is most significantly accessible.p_val: The original p-value from the statistical test, assessing the significance of differential accessibility at this peak between two groups.p_val_adj: Adjusted p-value (typically calculated using the Benjamini-Hochberg method for FDR correction).avg_log2FC: Average log2 fold change, representing the fold change (base 2 logarithm) in peak accessibility in the target group compared to the control group.pct.1: Proportion of cells in the target group in which the peak is detected.pct.2: Proportion of cells in the control group in which the peak is detected.
TIP
Recommended filtering criteria:
- Significance:
p_val_adj < 0.05(or stricter, such as 0.01). - Effect size:
avg_log2FC > 0.25(or higher, such as 0.5), indicating that the accessibility in the target group is at least 1.2 times that of the control group. - Detection rate:
pct.1 > pct.2, ensuring that the peak is detected in a higher proportion of cells in the target group.
(3) Visualization of Differential Peaks
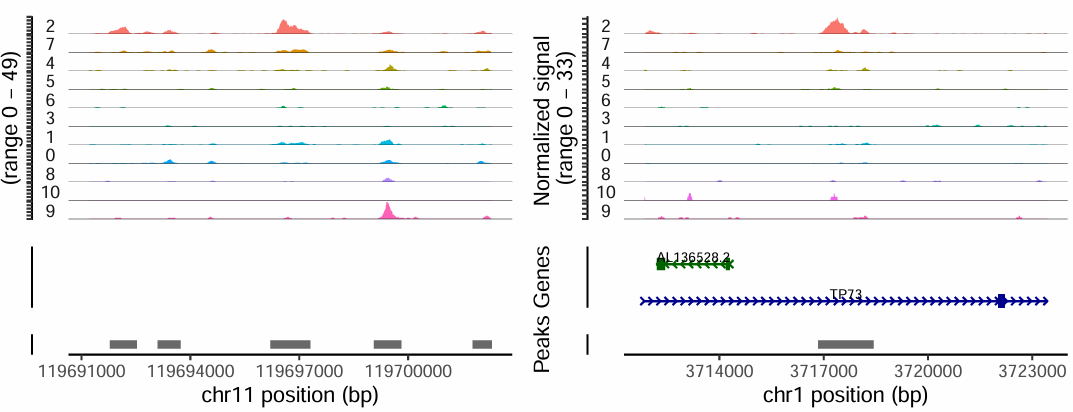
Below is an example displaying two peaks that are specifically accessible in the cluster2 cell population. Differential peaks indicate regions with increased chromatin accessibility in certain cell groups, suggesting these regions may be associated with cell function or gene regulation.
TIP
- The genomic regions of marker genes also often exhibit cell type-specific chromatin accessibility.
- If a gene is a marker for a certain cell type, the peaks near its promoter or enhancer are generally specifically accessible in that cell group.
- Visualizing the chromatin accessibility of marker genes can help in annotating cell types.
3. Motif Enrichment Analysis of Differential Peaks
(1) Definition of Motif
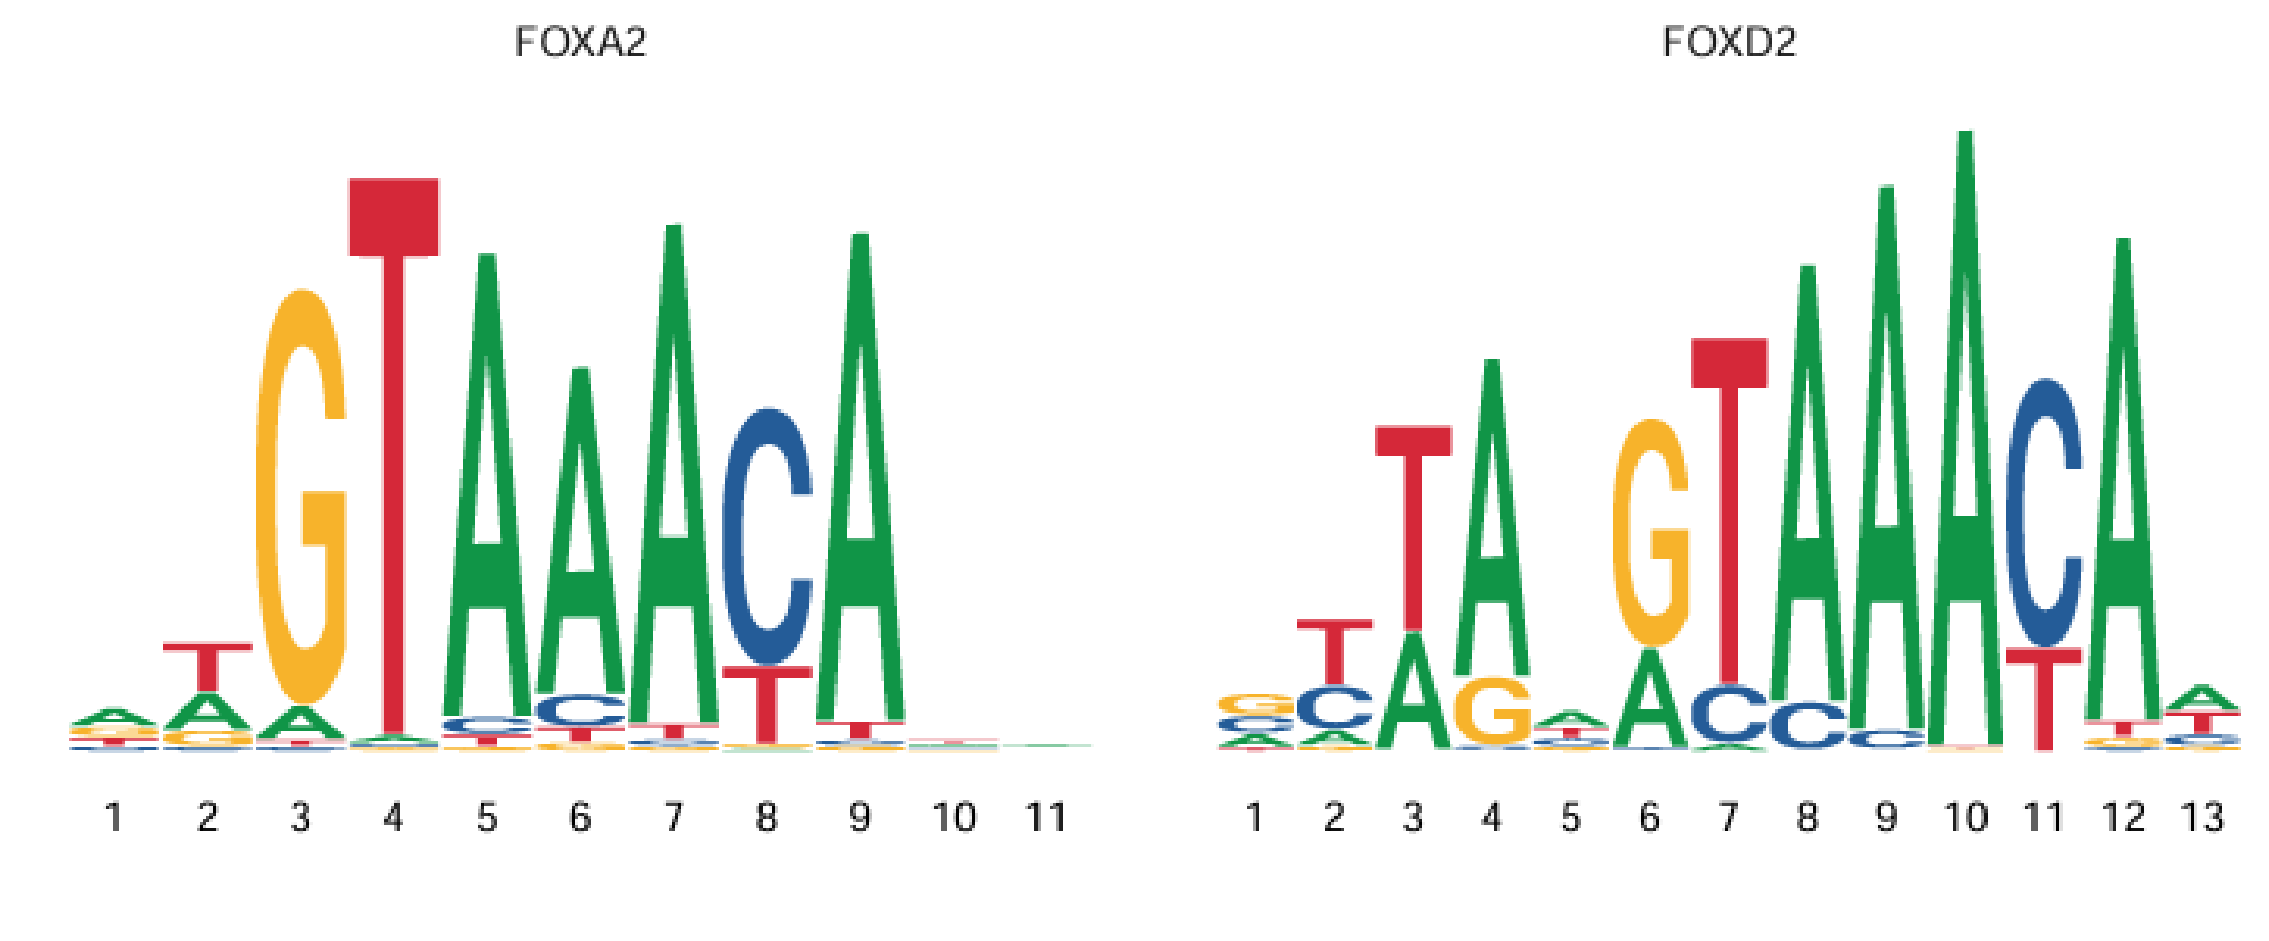
Transcription factors need to bind to open regions of DNA (peaks) in order to exert regulatory effects. Each transcription factor typically has a preferred binding sequence (for example, SP1 prefers GC-rich sequences). These sequence patterns are called motifs. Therefore, a motif can be defined as a DNA sequence pattern at transcription factor binding sites, usually consisting of 6–20 base pairs, as shown below:
(2) Purpose of Motif Enrichment Analysis
- Motif analysis aims to identify specific motifs that are enriched in differentially open peaks, inferring the key transcription factors involved in regulating these peaks. This helps reveal the core regulatory molecules among cell subpopulations and further elucidate the transcriptional regulatory networks and functional mechanisms underlying cell type- or state-specificity.
(3) Implementation of Motif Enrichment Analysis
Taking Signac as an example, Signac uses the AddMotifs() function to add motif information to a Seurat object, and performs motif enrichment analysis with FindMotifs(). Below is a key code example (using human, hg38, as an example):
library(Signac)
library(JASPAR2022)
library(TFBSTools)

# 1. Load the motif database (using human as an example)
pfm <- getMatrixSet(
  x = JASPAR2020,
  opts = list(collection = "CORE", tax_group = "vertebrates", all_versions = FALSE)
)

# 2. Add motif information to the ATAC object (e.g., atac)
DefaultAssay(obj) <- "ATAC"
obj <- AddMotifs(
  object = obj,                  # Your Seurat/Signac object
  genome = BSgenome.Hsapiens.UCSC.hg38, # Make sure the appropriate genome package is loaded
  pfm = pfm
)

# 3. Perform motif enrichment analysis on the peaks of interest, using all peaks in obj as background peaks
motif.results <- FindMotifs(
  object = obj,
  features = diff_peak    # for example, the list of differential peaks obtained from differential analysis
)

head(motif.results)| motif | observed | background | pct.obs | pct.bkg | fold.enrich | pvalue | motif.name | p.adjust |
|---|---|---|---|---|---|---|---|---|
| MA0497.1 | 556 | 8315 | 49.16 | 20.79 | 2.365 | 0 | MEF2C | 0 |
| MA0052.4 | 533 | 7948 | 47.13 | 19.87 | 2.372 | 0 | MEF2A | 0 |
| MA0773.1 | 398 | 4930 | 35.19 | 12.33 | 2.855 | 0 | MEF2D | 0 |
| MA0660.1 | 345 | 4002 | 30.50 | 10.01 | 3.049 | 0 | MEF2B | 0 |
| MA1151.1 | 286 | 3206 | 25.29 | 8.02 | 3.155 | 0 | RORC | 0 |
| MA0592.3 | 350 | 4669 | 30.95 | 11.67 | 2.651 | 0 | MEF2A | 0 |
motif: The motif identifier in the database, usually representing the binding sequence of a particular transcription factor.observed: The number of target peaks (e.g., differential peaks) that contain this motif.background: The number of background peaks (control group or all peaks) that contain this motif.pct.obs: The percentage of target peaks carrying this motif ( = observed / total number of target peaks × 100%).pct.bkg: The percentage of background peaks carrying this motif ( = background / total number of background peaks × 100%).fold.enrich: The enrichment fold of the motif in the target peaks, calculated as pct.obs / pct.bkg. The larger the value, the more enriched the motif is in the differential peaks.pvalue: The raw p-value for the statistical significance of motif enrichment analysis. Smaller values indicate that the observed enrichment is less likely to occur by chance.motif.name: The transcription factor name corresponding to the motif, making it easier to identify regulatory factors.p.adjust: The p-value after multiple hypothesis testing correction (e.g., FDR correction). Typically, p.adjust < 0.05 is considered significantly enriched.
Based on the above metrics, one can determine which motifs (and their corresponding transcription factors) are significantly and strongly enriched in differential peaks, thus highlighting potential key TFs involved in regulation.
Background peaks:
- Refers to a set of peaks used as controls during motif enrichment analysis, typically representing all peaks or those without significant differences. Their main function is to provide a baseline for the frequency of a specific motif in the peaks of interest (such as differential peaks).
- By comparing the enrichment of a given motif in differential peaks versus background peaks, one can assess whether the motif is significantly enriched under a specific biological condition.
- In the FindMotifs() function, the
backgroundparameter can be set to a specific feature vector as the background set, or to a number specifying the amount of randomly selected features as the background.
TIP
For more detailed information on motif analysis for scRNA-seq + scATAC-seq multi-omics data, please refer to Motif Analysis for Single-cell ATAC_RNA Multi-omics.
4. Gene Annotation of Differential Peaks
(1) Principle of Associating Peaks with Genes (Gene Annotation)
- Peaks are genomic coordinates that need to be annotated and linked to nearby genes in order to interpret their biological functions.
- Typically, each peak is associated with the closest gene, regardless of the distance.
(2) Methods for Gene Annotation
Taking the Signac method as an example:
# If the object 'obj' does not have annotation information yet, you need to add it first.
# Make sure the relevant packages (Signac, EnsDb, GenomicRanges, etc.) are already loaded.

# 1. Add annotation information (for human data, if annotation has already been added, you can skip this step)
DefaultAssay(obj) <- "ATAC"
annotation <- GetGRangesFromEnsDb(ensdb = EnsDb.Hsapiens.v86)
# Set the chromosome names of the gene annotation to match those in the obj
seqlevelsStyle(annotation) <- "UCSC"
genome(annotation) <- "hg38"
Annotation(obj) <- annotation

# 2. Finding the Closest Gene for Each Differential Peak
closest_genes <- ClosestFeature(
  object = obj,
  regions = diff_peak # or your own custom peaks regions
)
head(closest_genes)
The actual output is as follows:
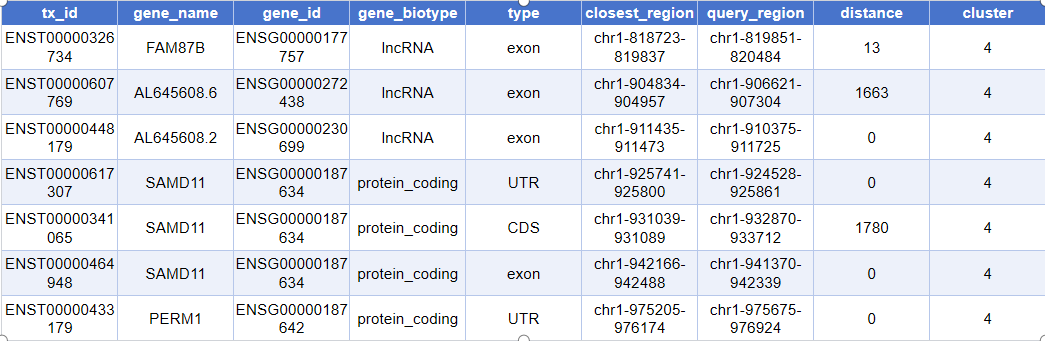
tx_id: Unique ID for the transcript/exon/fragment (e.g., ENSE accession number)gene_name: Symbolic name of the gene (e.g., TP53, GAPDH, etc.)gene_id: Gene ID in the database (e.g., those starting with ENSG)gene_biotype: Gene type (such as lincRNA, protein_coding, pseudogene, etc.)type: The specific annotated region type (e.g., exon, promoter, etc.)closest_region: The genomic segment closest to the peak (coordinate interval)query_region: Genomic location information (coordinate interval) of the annotated peakdistance: Distance from the peak to the nearest end of the corresponding genomic region (in base pairs, bp)
5. Functional Enrichment Analysis of Differential Peaks
After annotating the peaks to their corresponding genes as described above, the next step is to perform functional enrichment analysis using databases such as GO and KEGG. The analytical approach and workflow are essentially the same as those used for conventional differential gene functional enrichment.
By conducting functional enrichment analysis on the genes associated with differential peaks, we can systematically reveal the major biological processes and signaling pathways these genes are involved in, thereby providing preliminary insights into the biological significance of the differential peaks.
TIP
The core of functional enrichment analysis for differential peaks is to perform enrichment and functional annotation analysis on the neighboring genes to which these peaks are mapped.
(1) Common Functional Enrichment Databases
GO (Gene Ontology) Enrichment:
- Biological Process (BP): Describes the biological processes genes participate in, such as "cell proliferation" and "immune response".
- Molecular Function (MF): Describes the molecular functions of gene products, such as "DNA binding" and "kinase activity".
- Cellular Component (CC): Describes the cellular locations of gene products, such as "nucleus" and "mitochondrion".
KEGG Pathway Enrichment:
- KEGG (Kyoto Encyclopedia of Genes and Genomes) provides pathway annotations including signaling and metabolic pathways.
- Helps to understand which key biological pathways are affected by differential peaks.
Other Databases:
- Reactome: Provides detailed pathway annotations.
- MSigDB: Contains multiple gene sets, such as Hallmark gene sets and cell type-specific gene sets.
(2) 功能富集分析示例
The following figure shows a visualization of GO functional enrichment analysis for genes associated with differential peaks. The y-axis displays significantly enriched GO terms, making it easy to quickly identify representative functional categories and their significance levels, thereby providing insights into the potential biological functions related to the differential peaks.
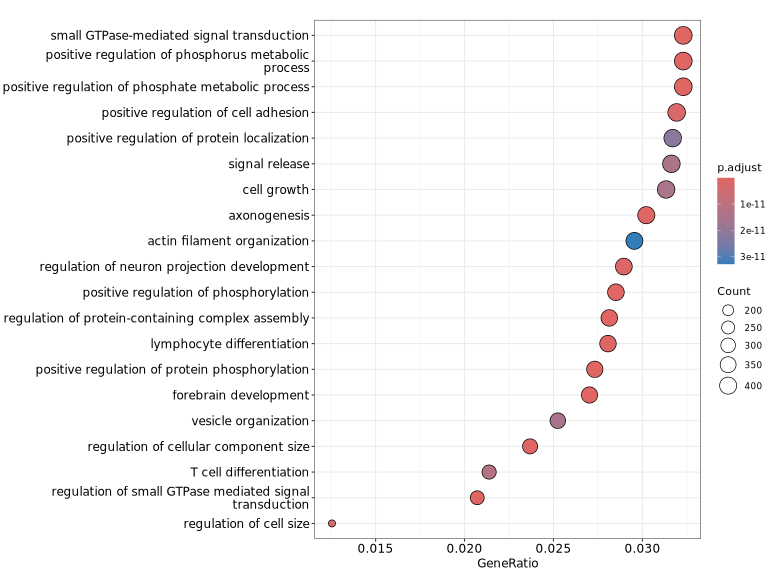
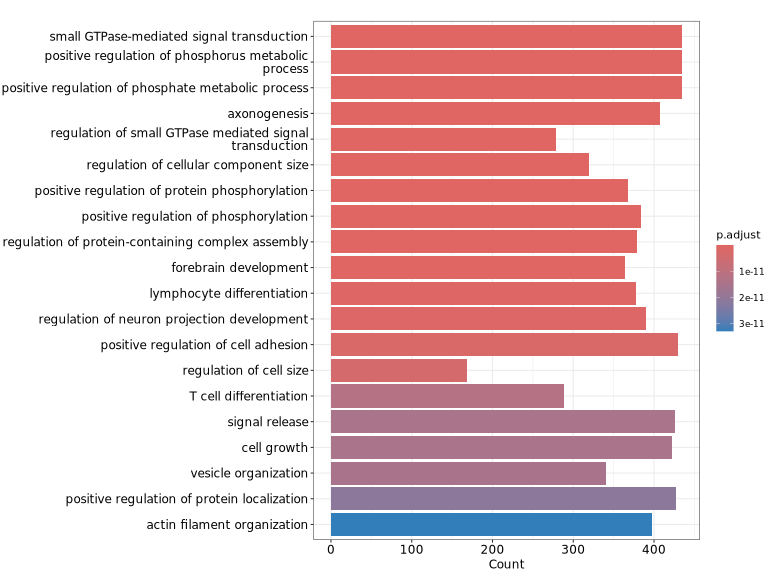
GeneRatio / BgRatio: Proportion of genes involved in the given function/pathway in the target gene set vs. that in the background gene set.p.adjust: Statistical significance of the enrichment. p.adjust < 0.05 is usually considered significantly enriched.Count: Number of genes in the target set assigned to that function/pathway.
TIP
Term: In functional enrichment analysis, a "term" typically refers to a functional category in a gene set database (such as GO or KEGG), for example, a specific biological process (e.g., "apoptosis"), molecular function (e.g., "DNA binding"), or pathway (e.g., "Wnt signaling pathway").
6. Frequently Asked Questions
Q1: What are the purposes and applications of differential peak analysis?
A: The main objective of differential peak analysis between cell groups is to identify chromatin regions (peaks) that differ in accessibility between different cell populations. This helps us to:
- Identify population-specific regulatory elements
- Discover which enhancers, promoters, or other regulatory regions are more accessible in certain cell types and are more likely to regulate cell type-specific functions.
- Infer associated genes and their biological functions
- By linking differential peaks to nearby genes, we can hypothesize that the expression of these genes may be influenced by these regulatory regions, and further perform functional enrichment analysis (such as GO and KEGG).
- Screen for potential regulatory factors
- By combining motif enrichment and other analyses, it is possible to predict key transcription factors that are active in specific cell groups.
Q2: How to determine which transcription factors are most important in the results of motif enrichment analysis?
A: You can consider the following aspects:
Initial selection: When performing motif enrichment analysis, it is recommended to use the most significant differential peaks (such as those with lower p-values or higher fold-changes) as the input set for enrichment. This increases the biological relevance and reliability of the analysis results.
Evaluation criteria:
- Fold enrichment: The higher the value, the stronger the enrichment of the TF motif in the top peaks.
- Significance (p.adjust): Transcription factors with
p.adjust < 0.05(or more stringent) are considered more reliable. - Biological knowledge: Prioritize transcription factors that are already known to be important in the specific cell type or process, based on research background.
- Consistency: If multiple related motifs all point to the same transcription factor, it indicates that TF is likely more important.