Integration Analysis of SeekARC and 10x Single-Cell Transcriptome Data
Abstract
This document demonstrates the integration analysis effectiveness between SeekARC platform and 10x Genomics platform single-cell transcriptome data, and validates the feasibility of data integration and reliability of analysis results through two mainstream downstream analysis workflows: monocle2 and hdWGCNA. The results show that SeekARC platform data has high consistency with 10x platform data, effectively supporting the in-depth development of cross-platform single-cell transcriptome research.
1. Research Background
In single-cell transcriptome research, data integration across different platforms is an important means to expand sample scale and improve statistical power. SeekARC, as a new-generation single-cell ATAC dual-omics transcriptome sequencing platform, requires systematic validation of its data compatibility and integration effectiveness with mainstream platforms like 10x Genomics.
2. Data Integration Strategy
2.1 Data Preprocessing
- Raw Data Matrix: Contains single-cell transcriptome expression data from multiple samples
- Standardization Processing: Adopts Seurat standard workflow for data standardization and quality control
- Batch Information Annotation: Clearly marks different platforms and sample sources
2.2 Integration Methods
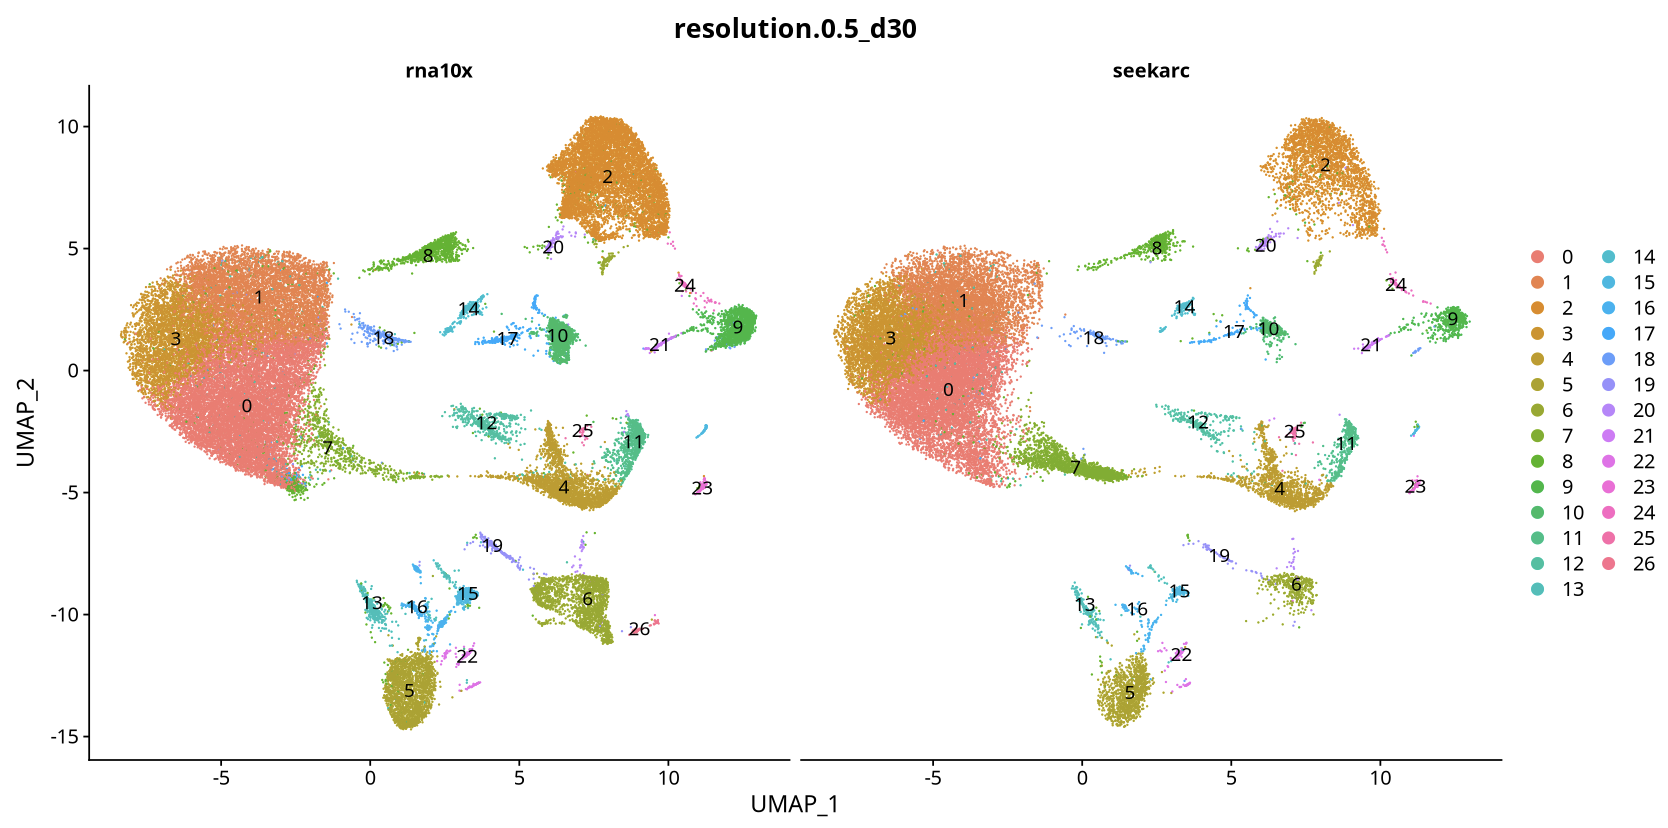
Adopts Seurat's integration workflow, achieving effective alignment of cross-platform data through identification of anchors.
3. Monocle2 Trajectory Analysis
3.1 Data Matrix Selection Comparison
Data Matrix Analysis Results
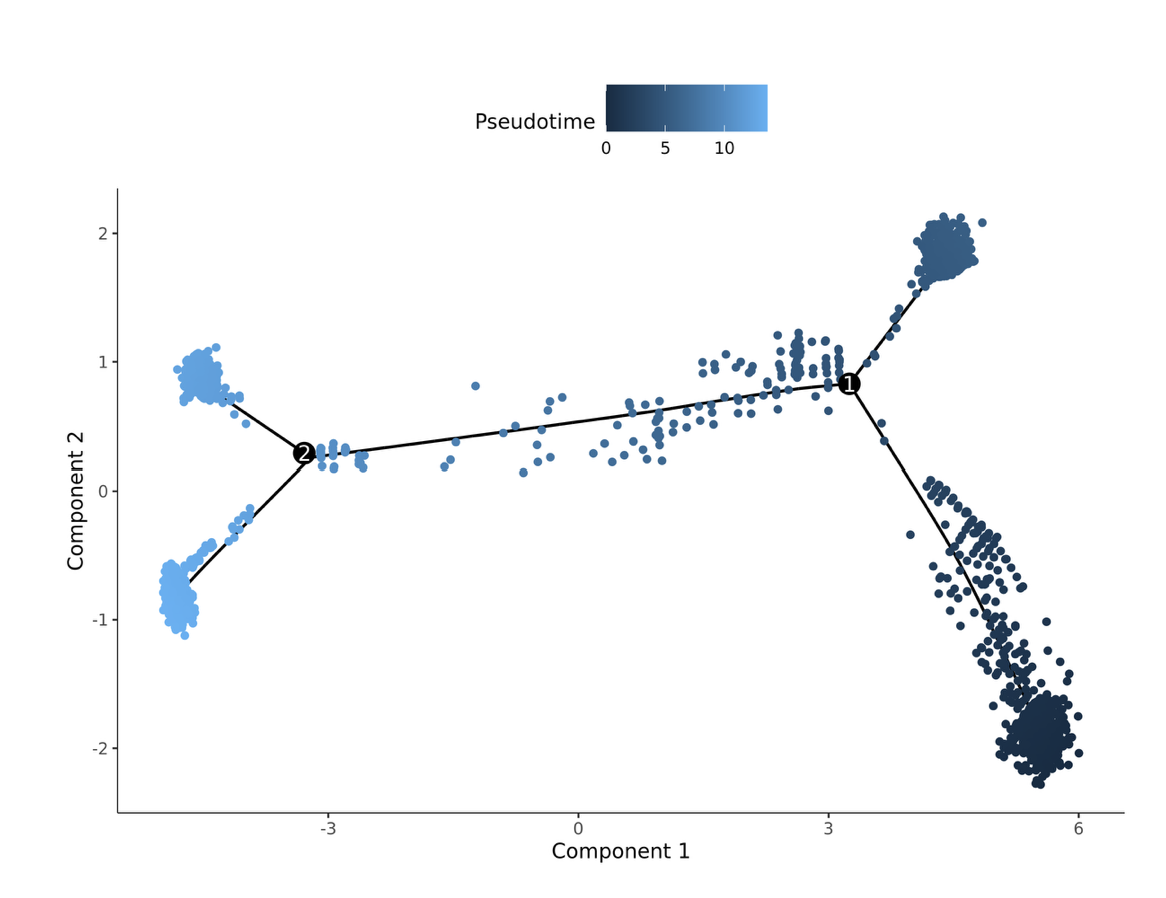
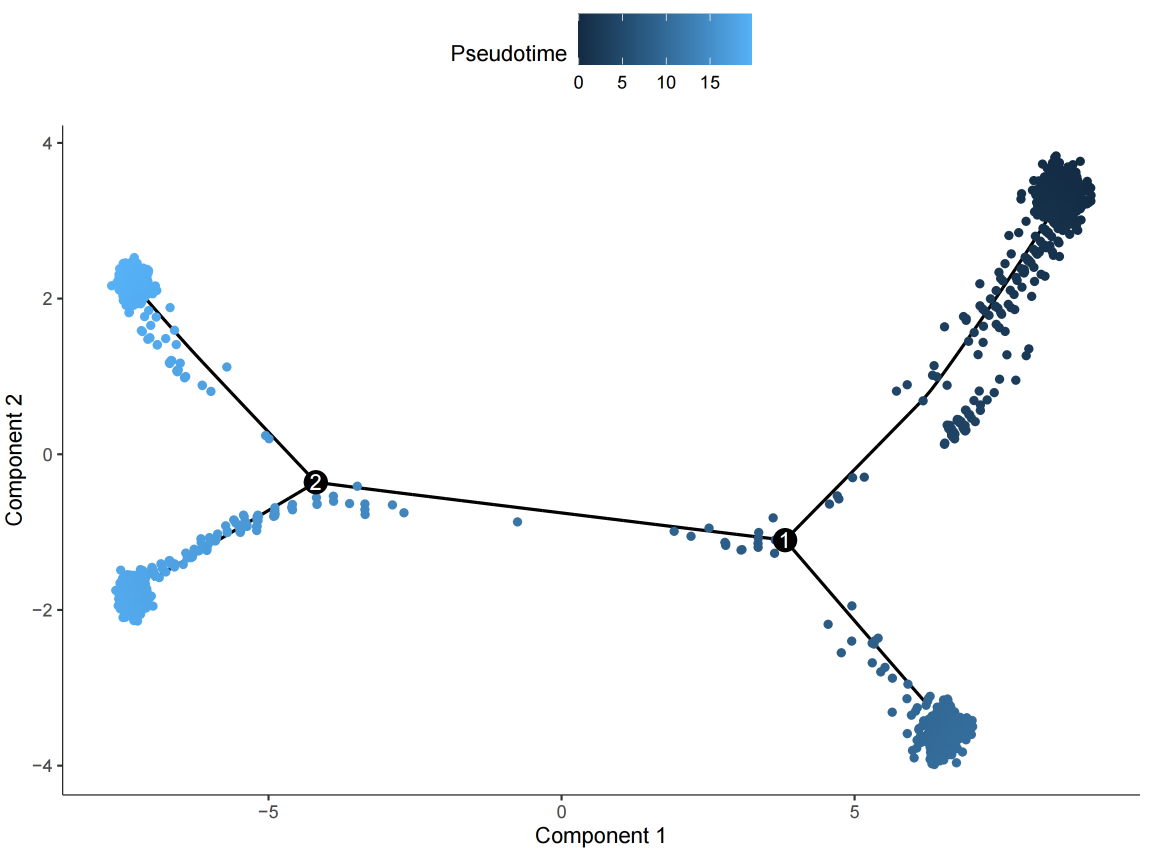
Pseudotime cell development trajectory plot. Pseudotime is a probability calculated by Monocle2 based on cell expression information, representing temporal sequence. Each point represents a cell, and the color gradient from deep to light indicates temporal order.
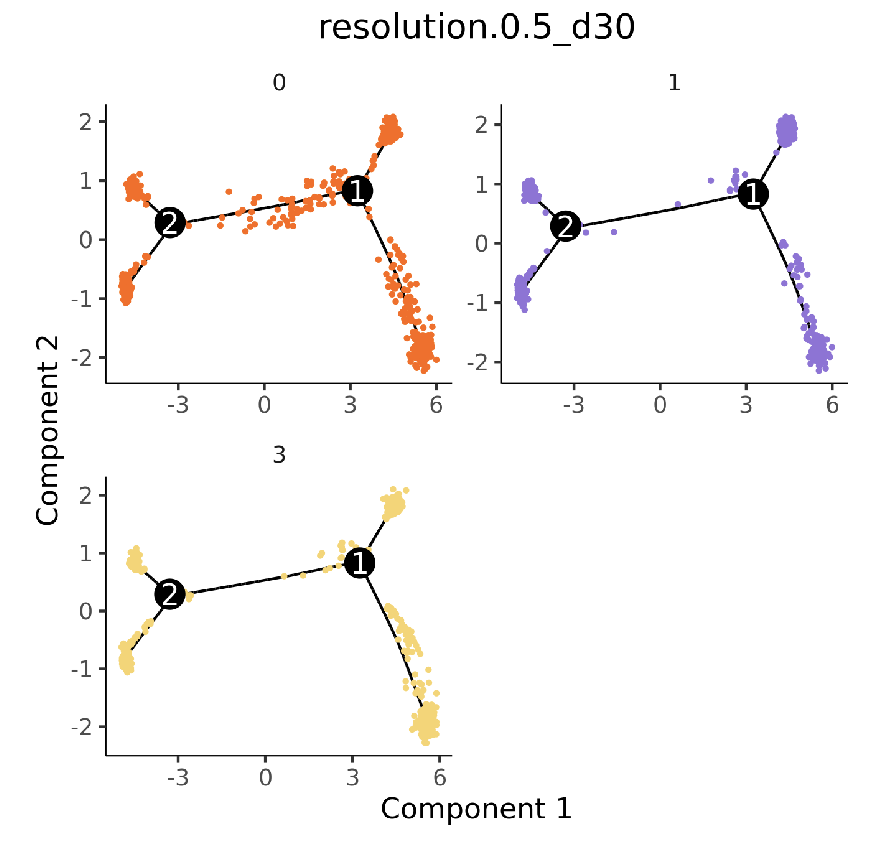
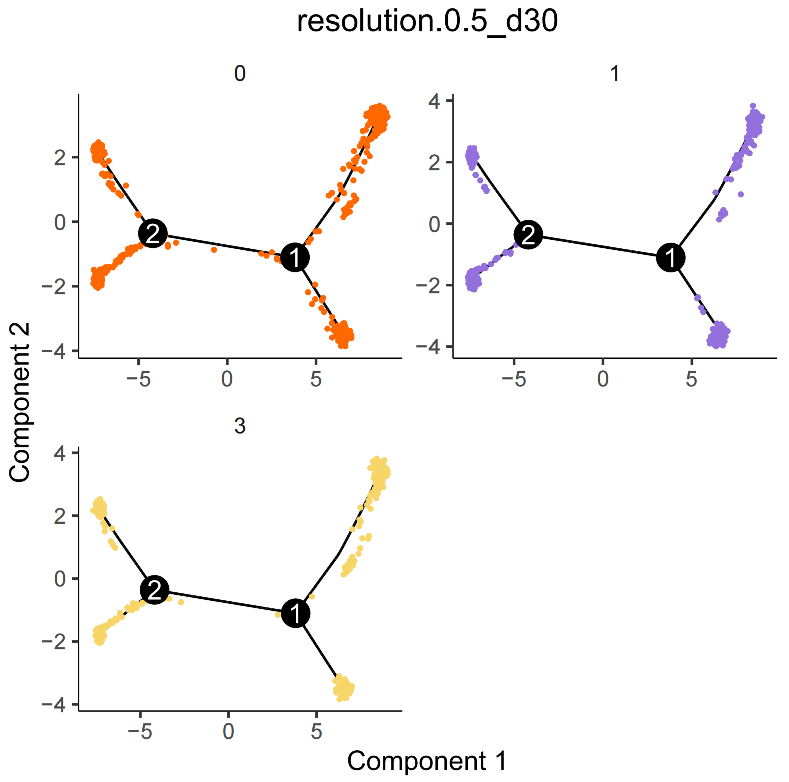
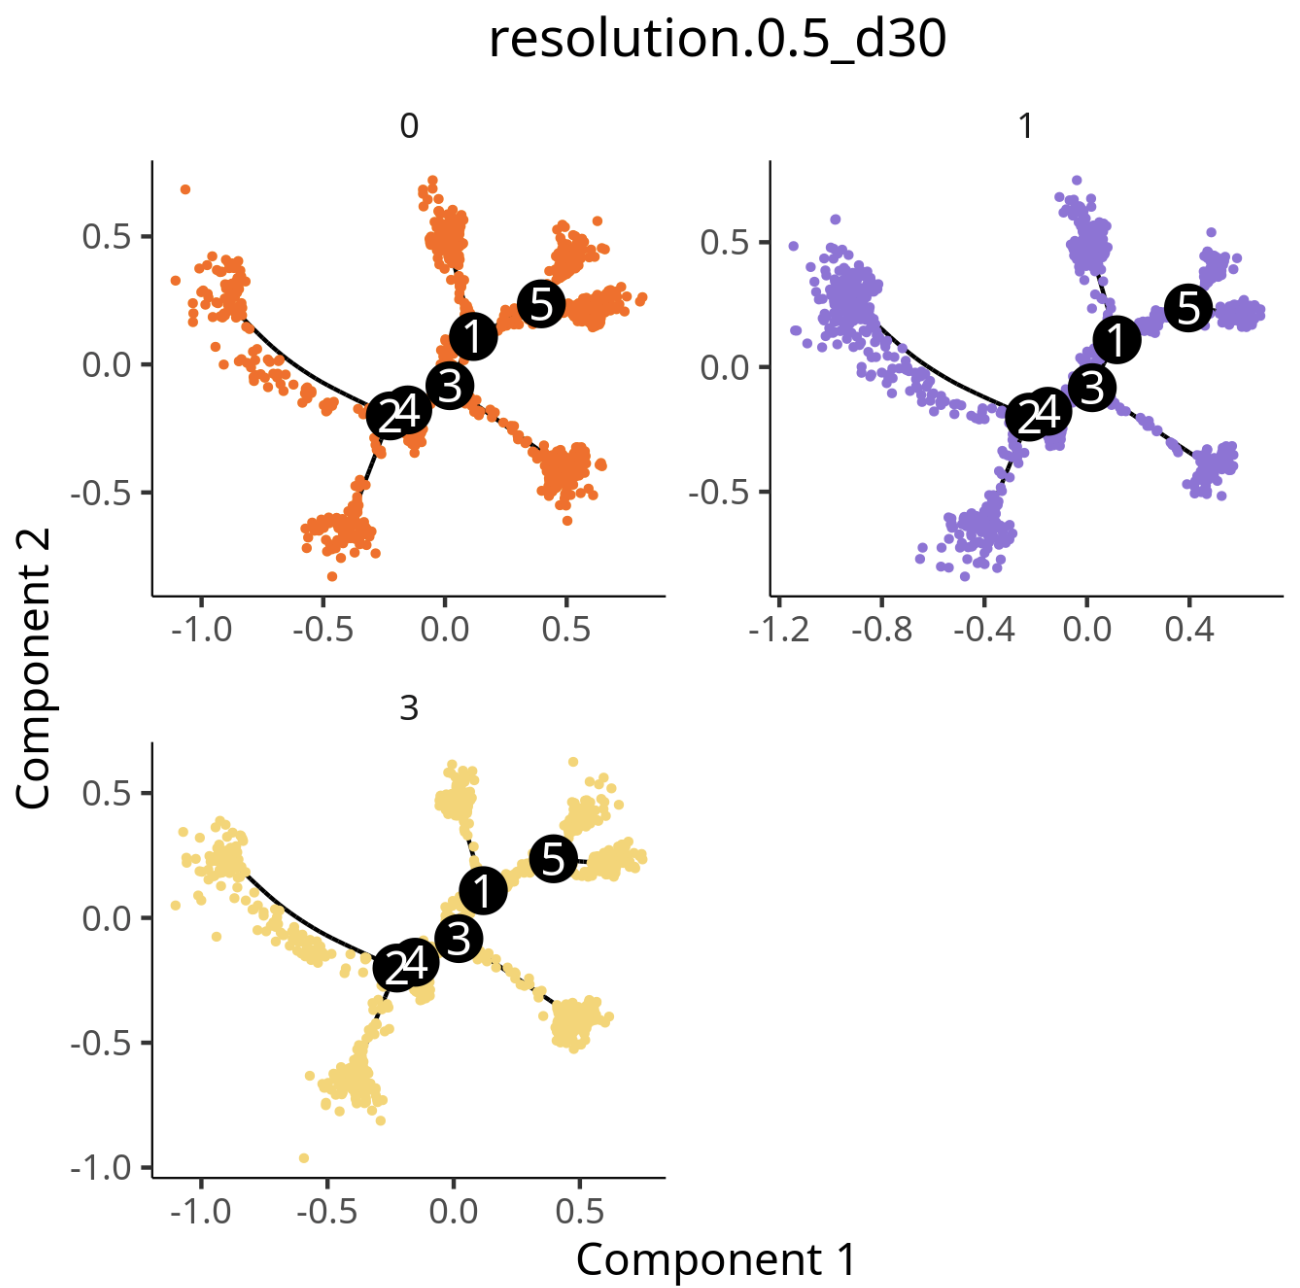
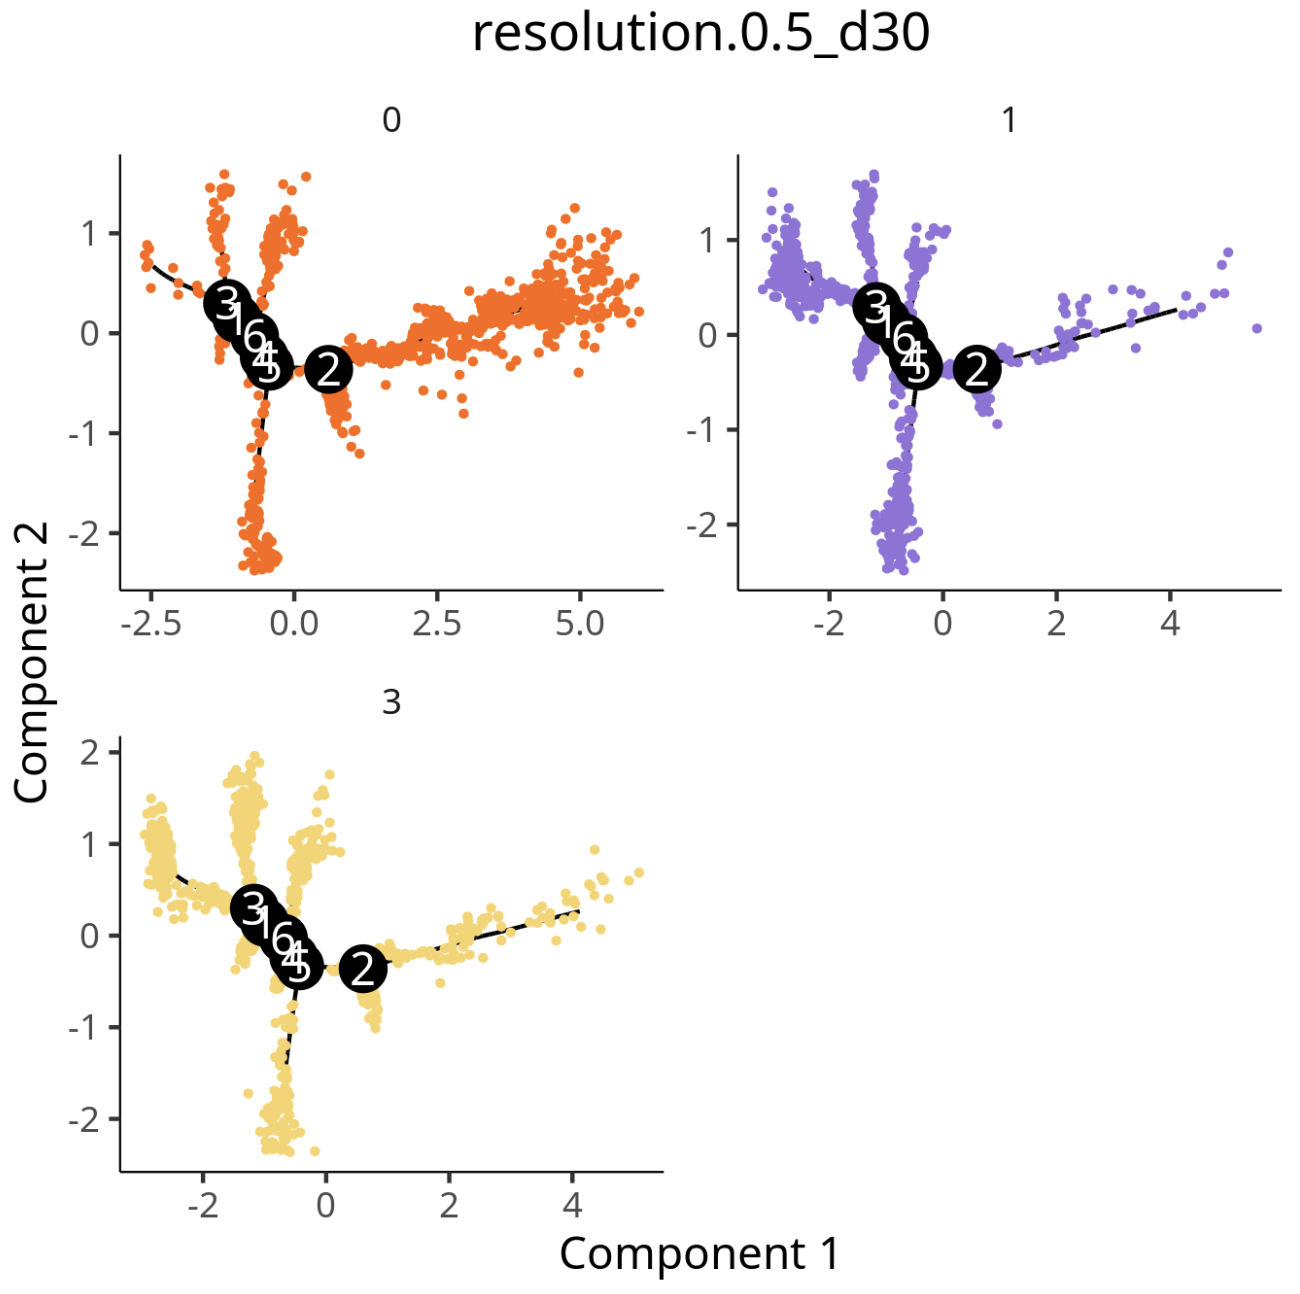
Cell population trajectory development plot. Each point represents a cell, with different colors representing different cell populations.
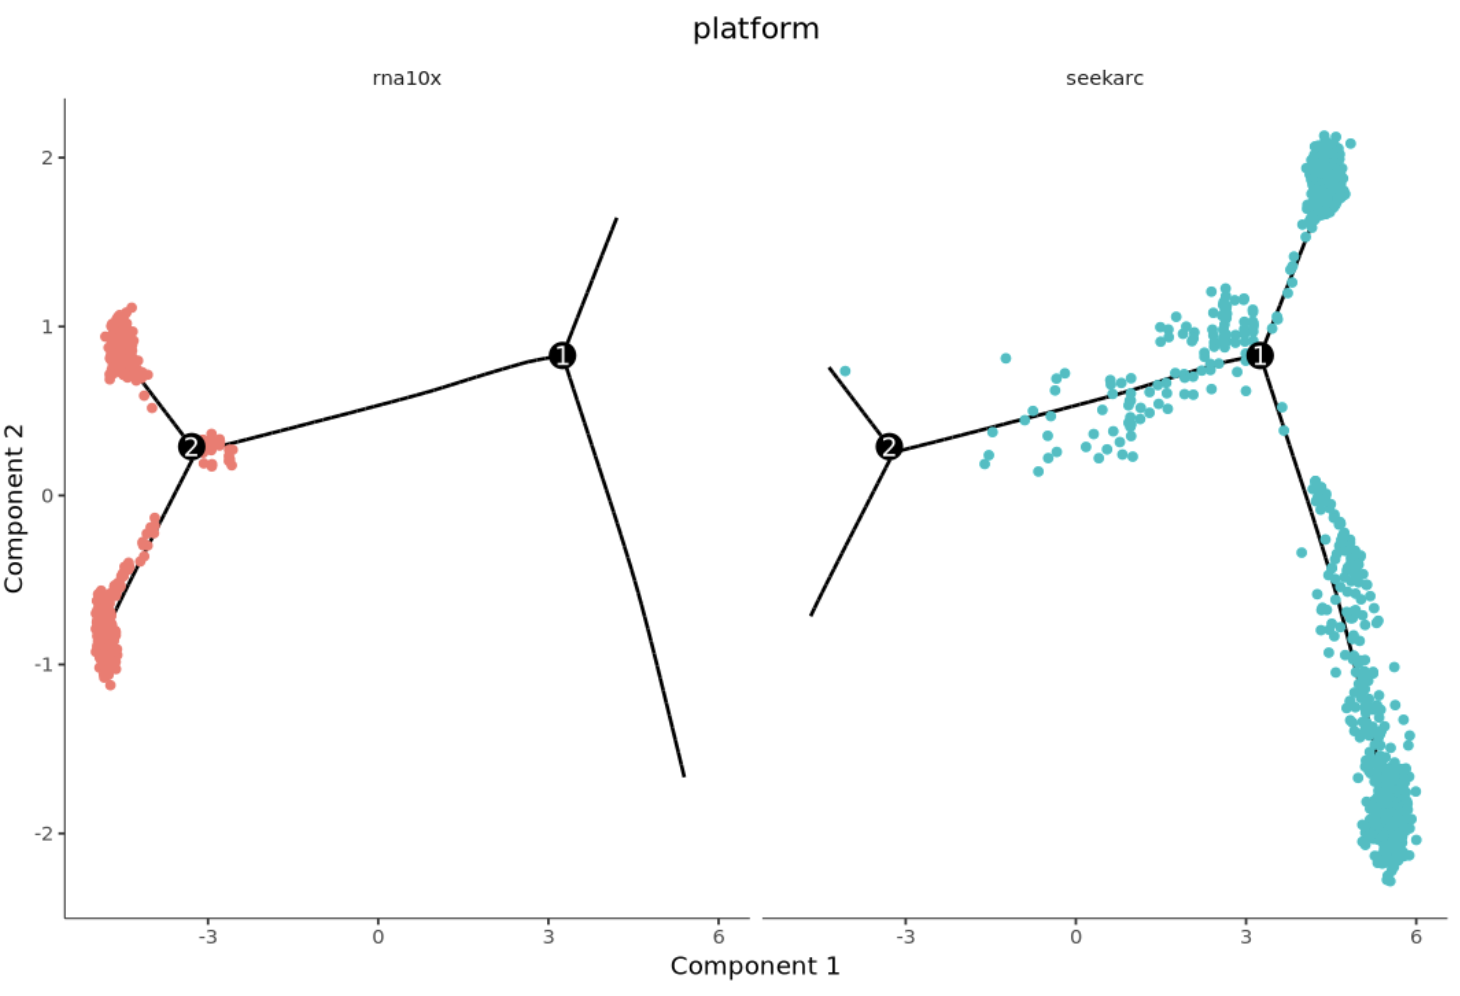
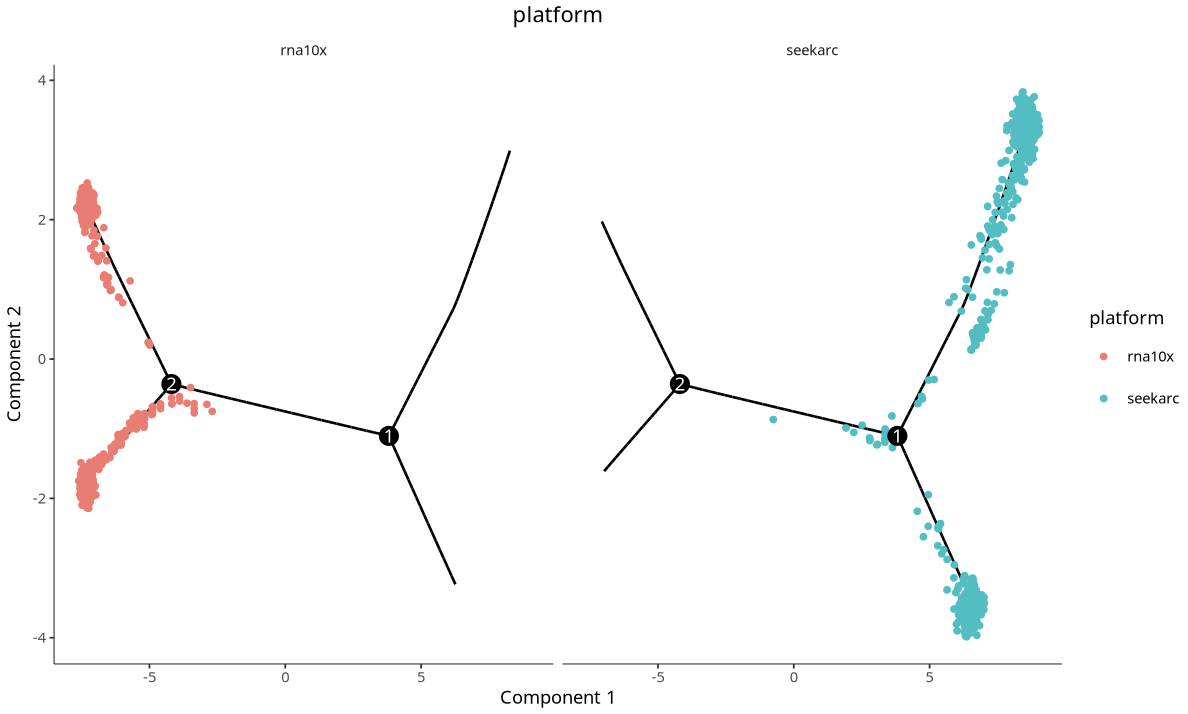
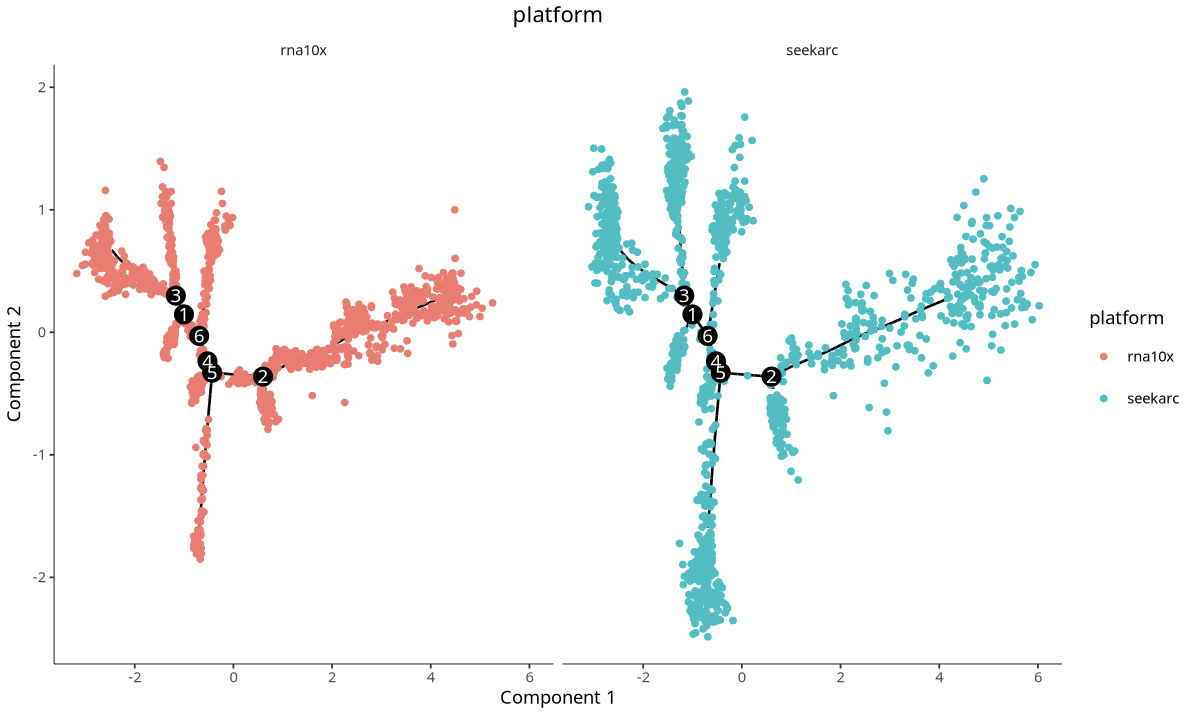
Cross-platform cell trajectory plot. Each point represents a cell, with different colors representing different platforms.
Counts Matrix Analysis Results
3.2 Batch Effect Correction Strategy
Strategy A: Using Integrated Matrix

Strategy B: Adding Batch Correction Parameters
# Add batch correction in reduceDimension
residualModelFormulaStr = "~Sample"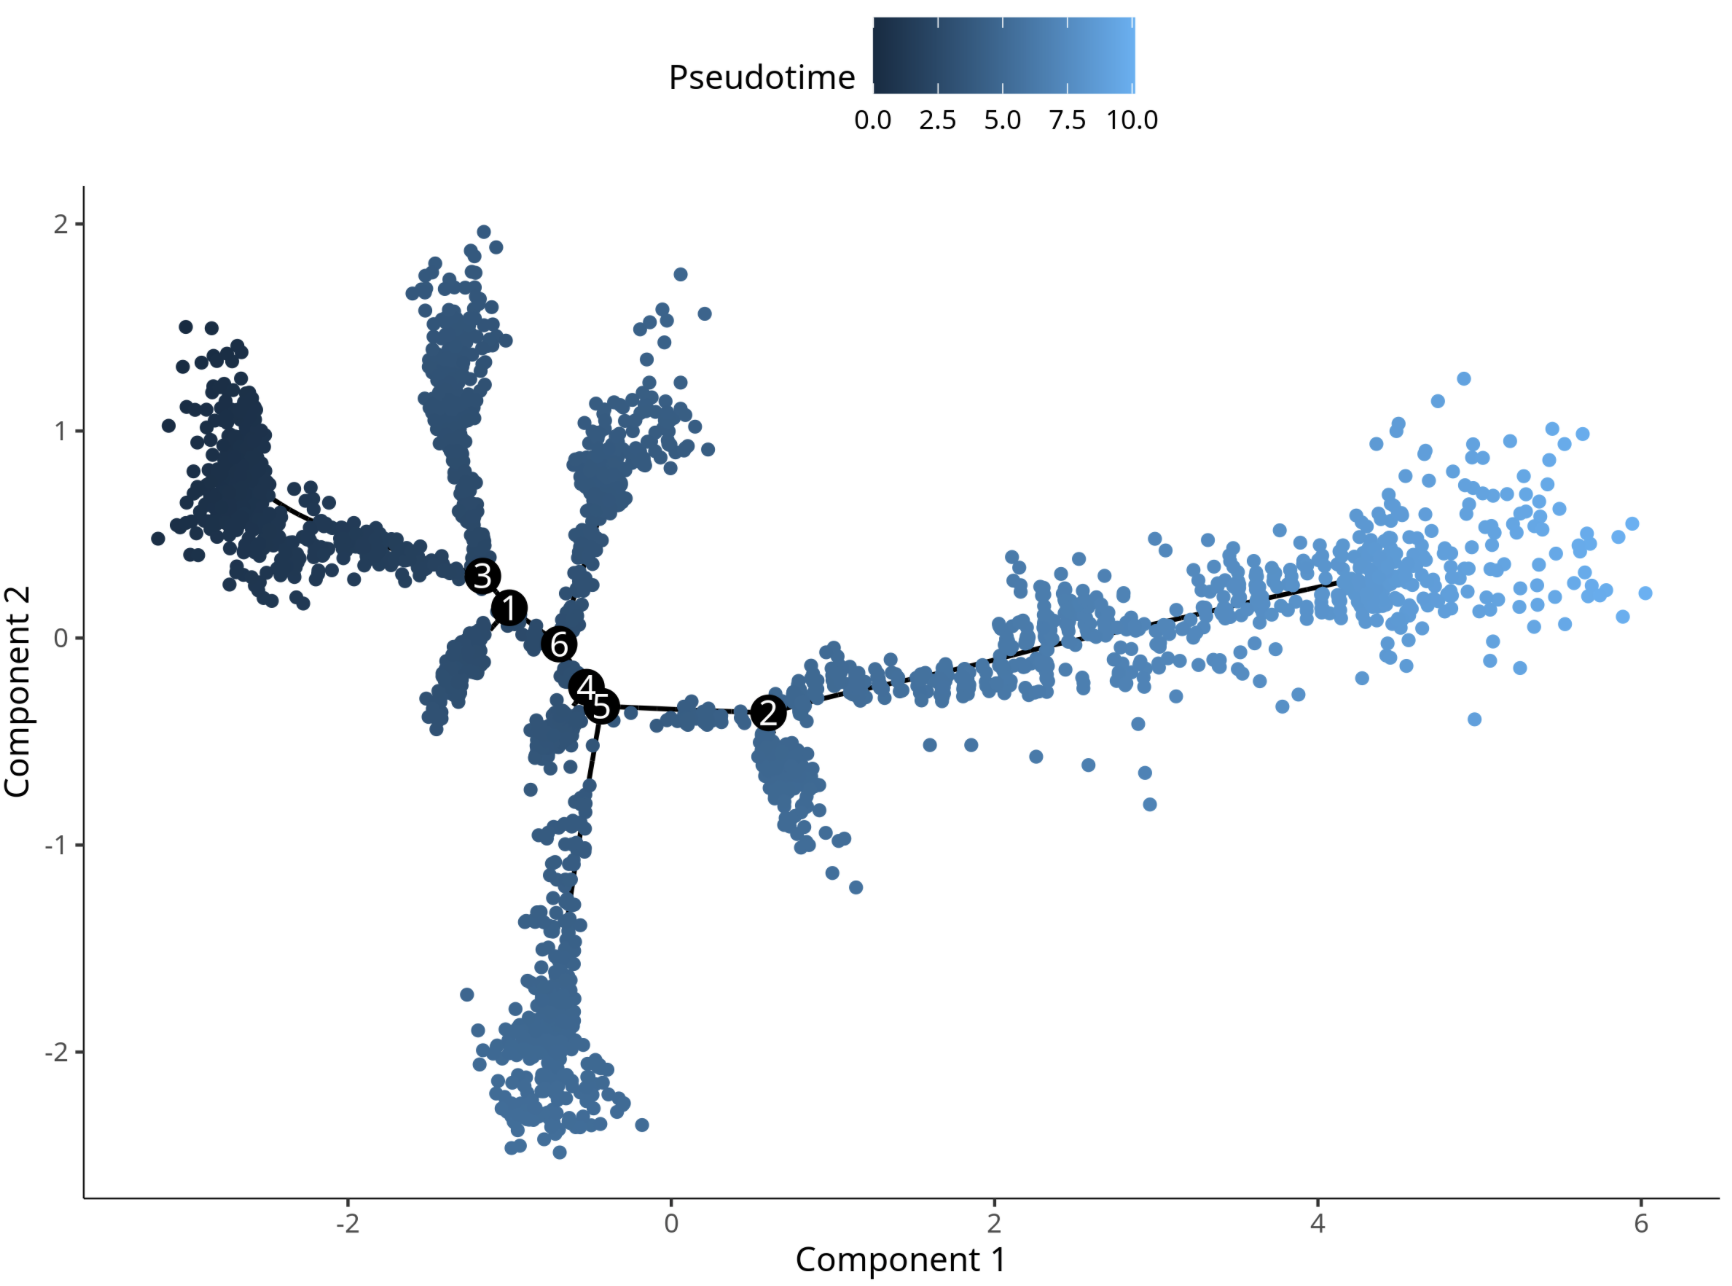
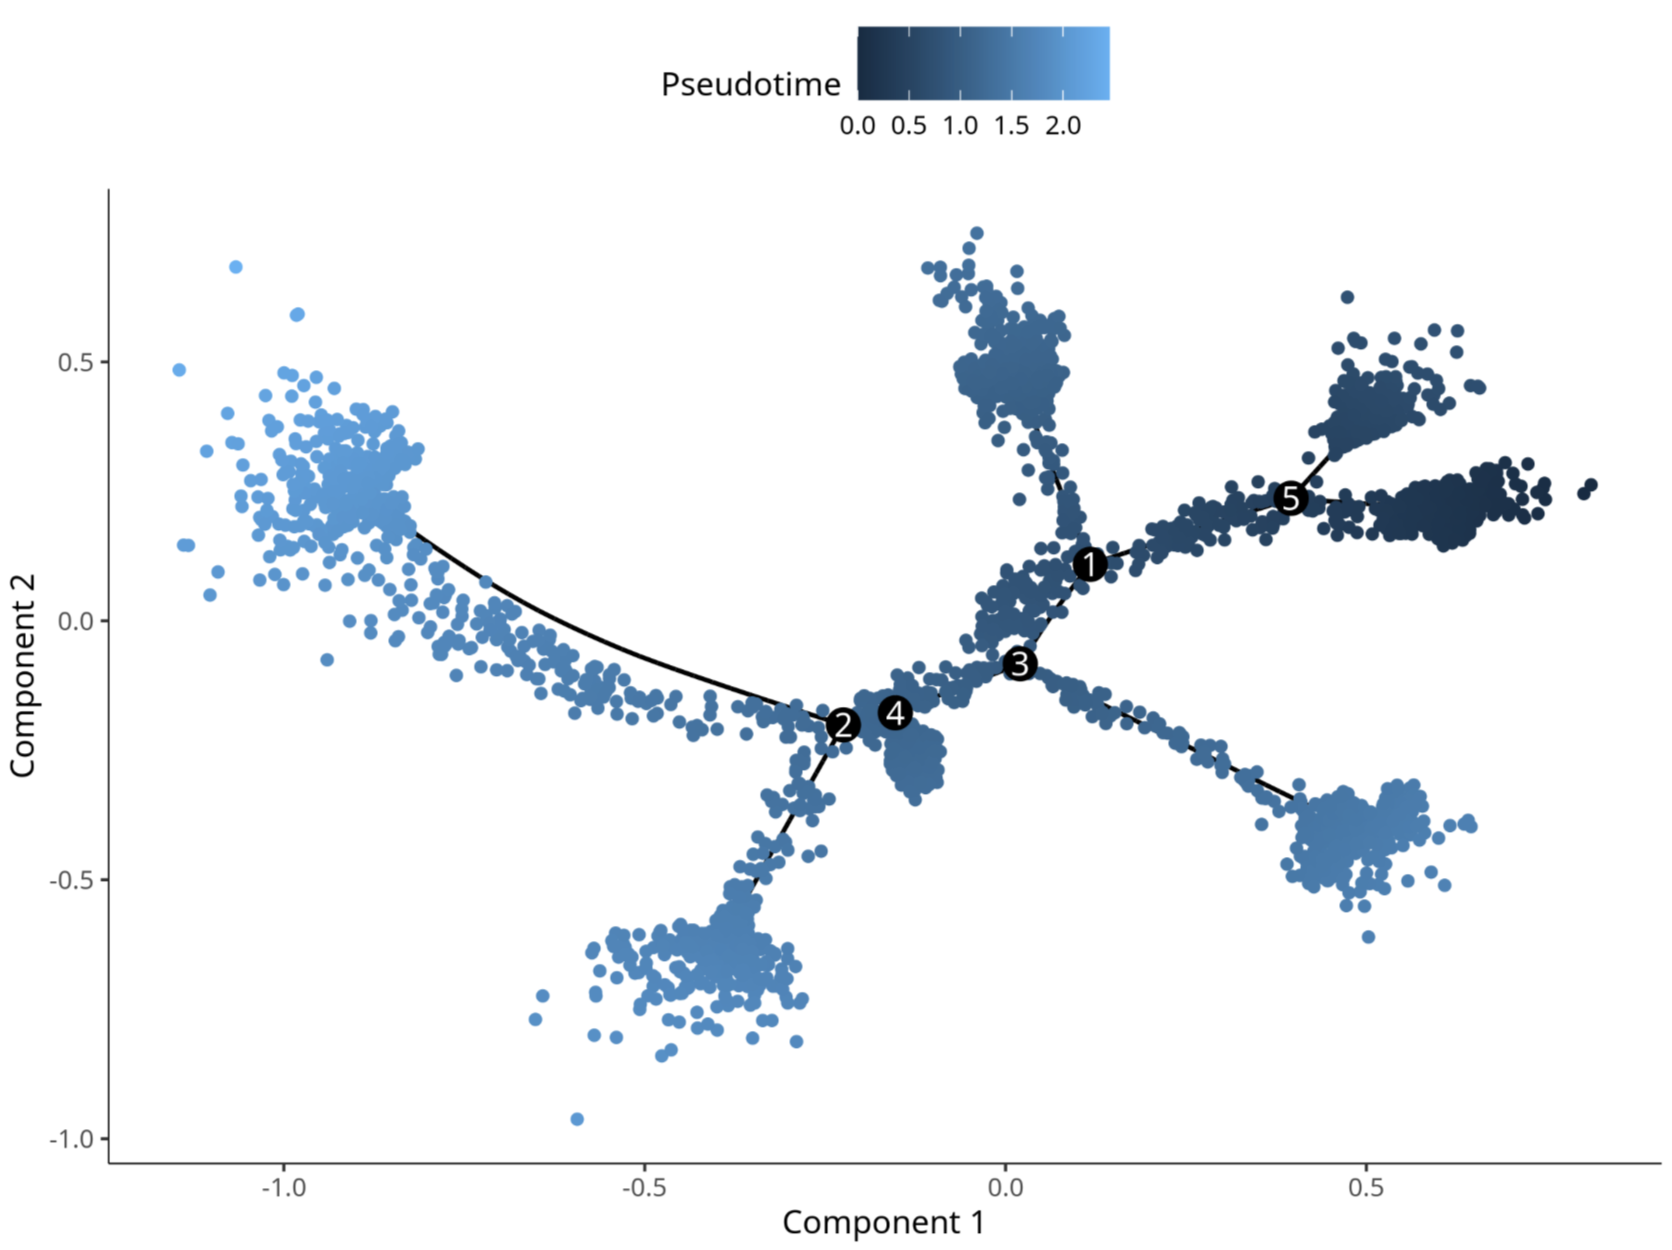
3.3 Mouse Brain Multi-Platform Data Validation
Standard Analysis Results: 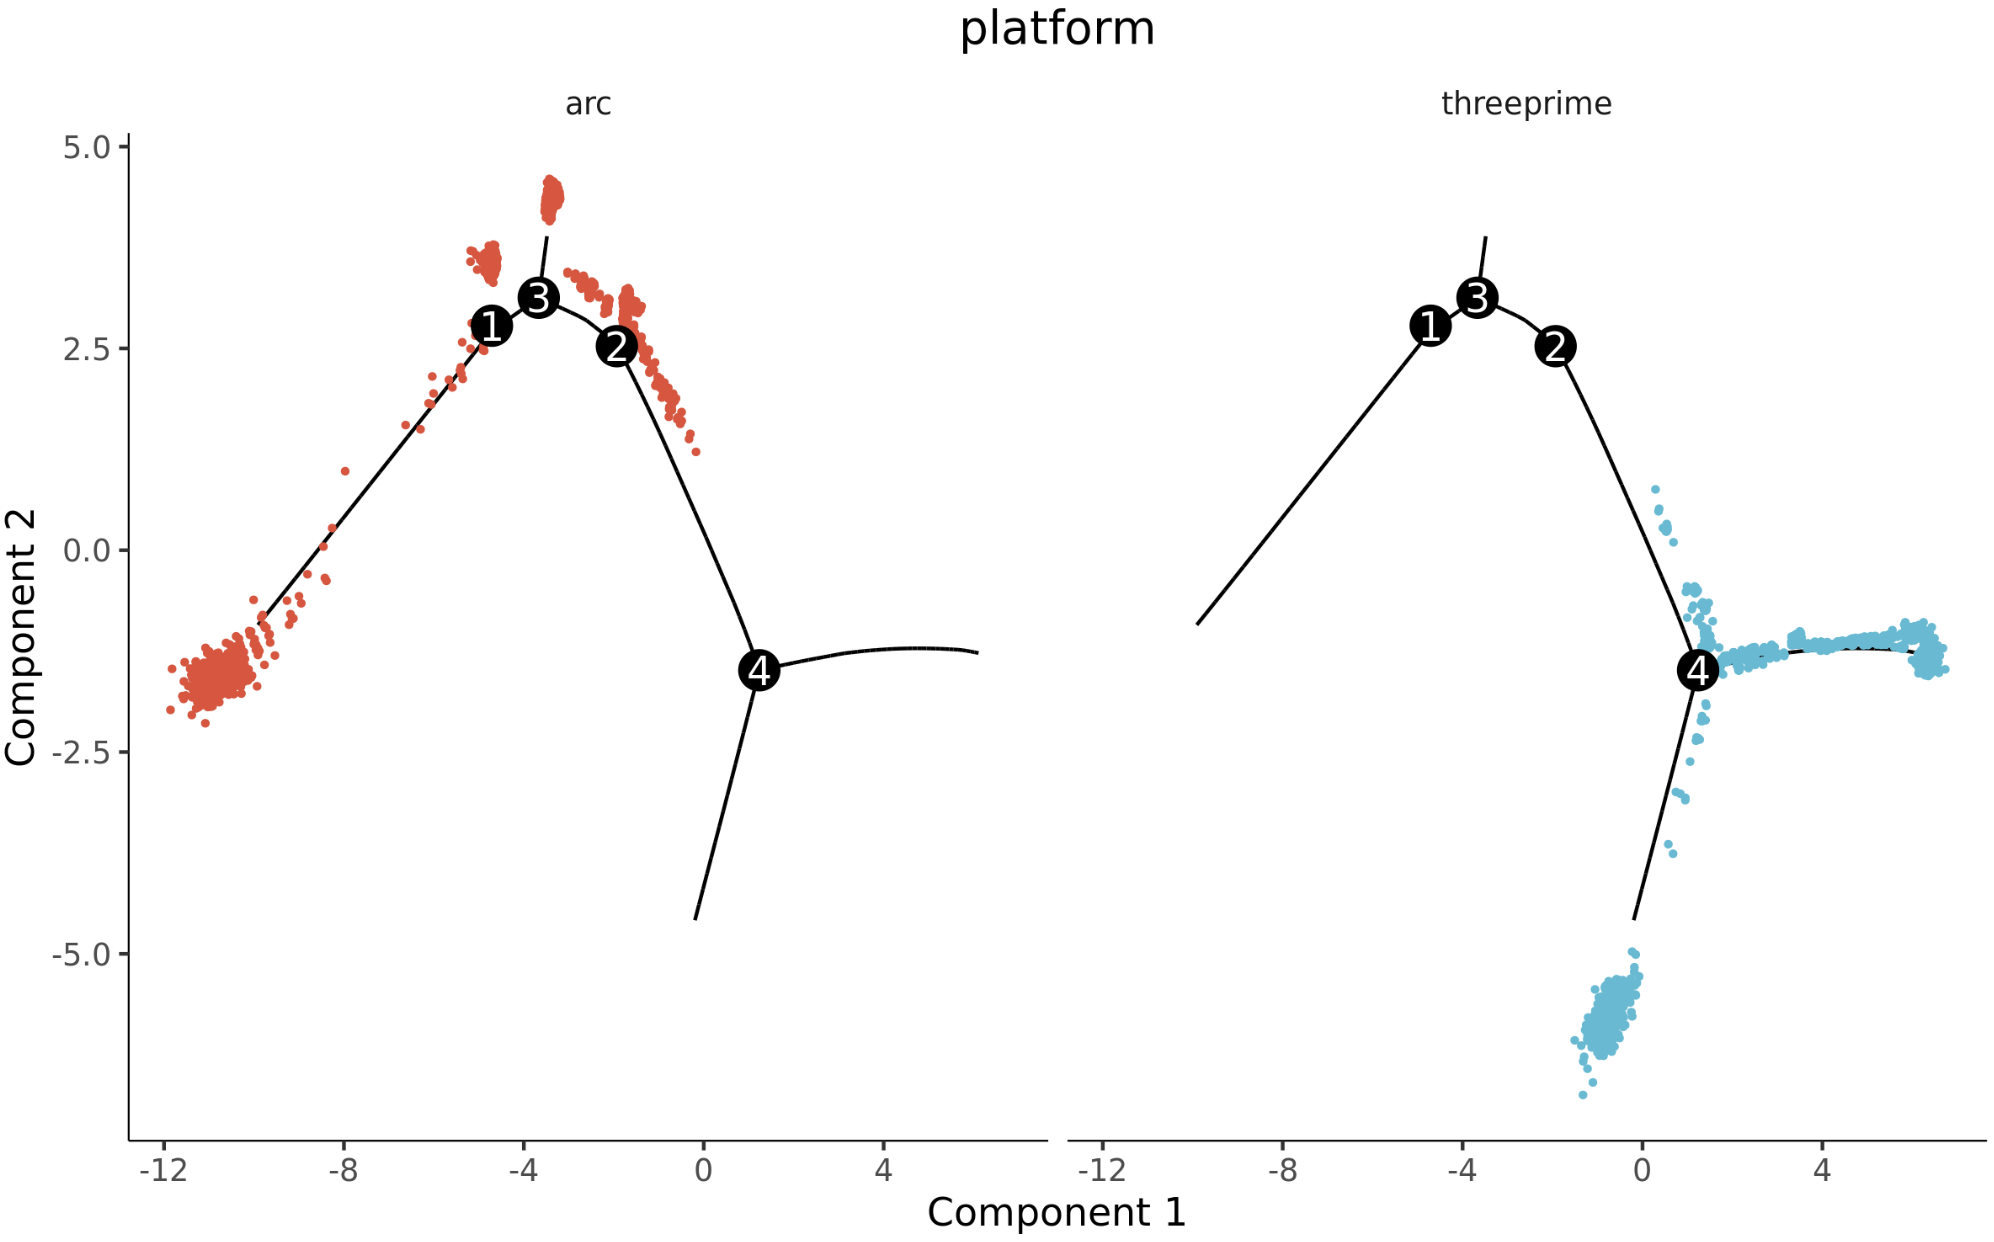
After Adding residualModelFormulaStr Parameter: 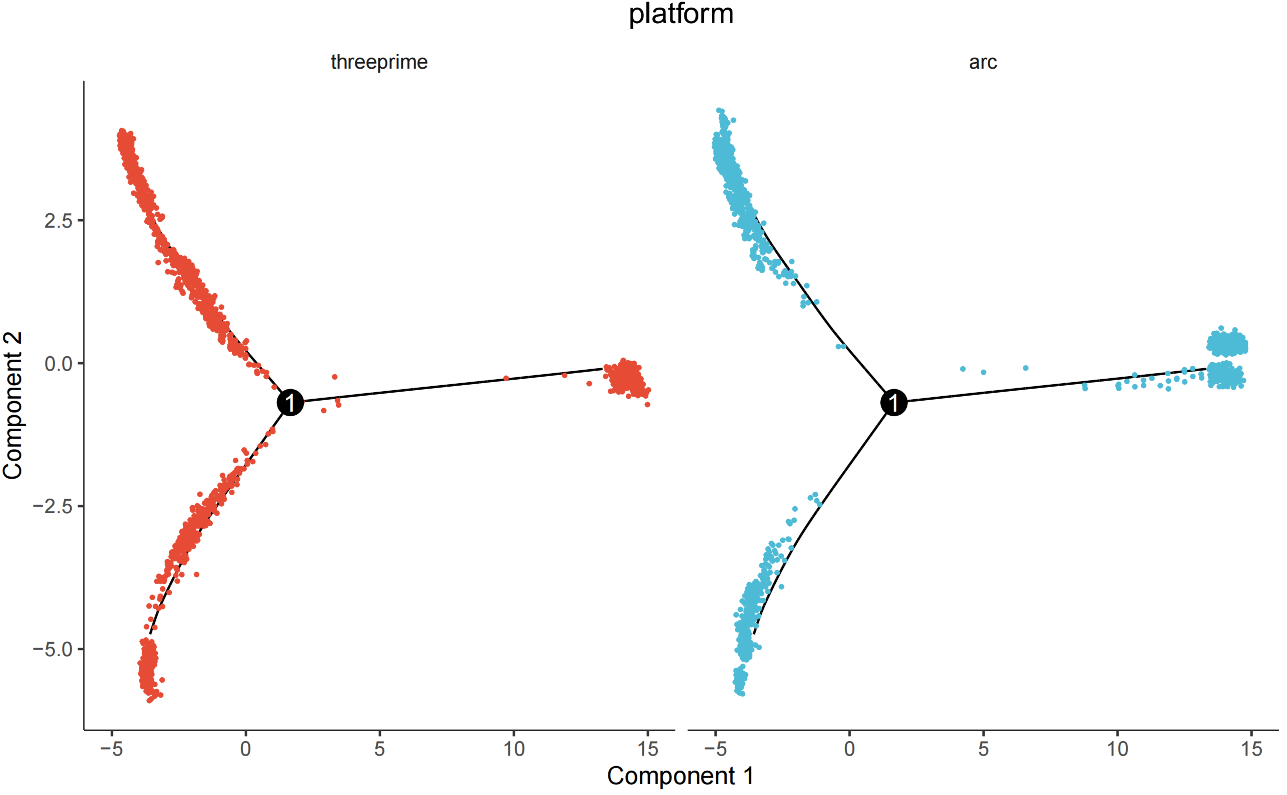
3.4 Summary
- Matrix Selection: The trajectories obtained using
countsanddatamatrices in Monocle2 are basically consistent. - Batch Correction: Adding
residualModelFormulaStr = "~Sample"inreduceDimensioncan effectively reduce sample/platform-driven separation and highlight biological signals (see related link); when batch effects are significant,integratedmatrix can be selected (see related literature 1, literature 2). - Cross-Platform Validation: Mouse brain multi-platform data validation shows good integration and trajectory consistency, with robust and reusable workflow.
- Practical Recommendations: Prioritize using
countsmatrix; if obvious platform differences exist, adoptintegratedor add~Sampleresidual term to ensure trajectory continuity and biological interpretability.
4. hdWGCNA Co-Expression Network Analysis
4.1 Standard Analysis Workflow
In hdWGCNA standard analysis workflow, Harmony is also used for batch correction when calculating module eigengenes: 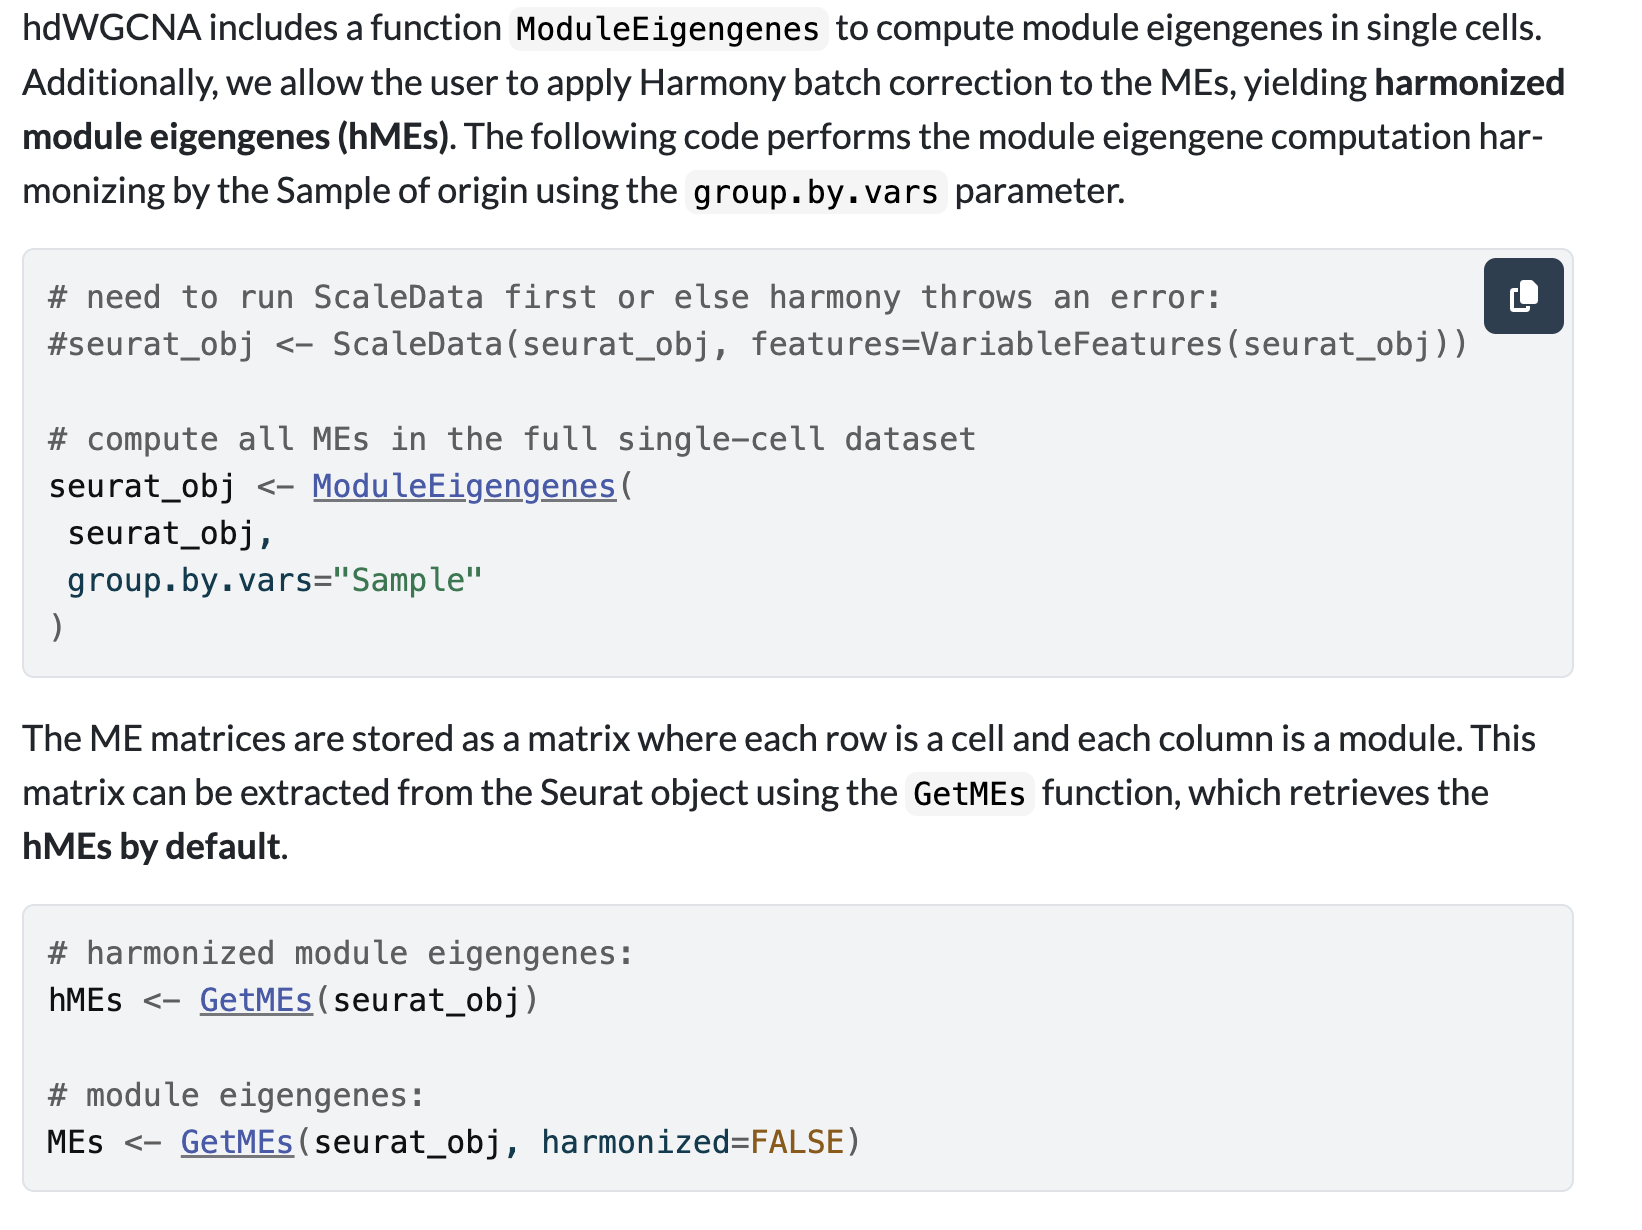
4.2 Consensus Analysis Workflow
For data with strong batch effects, hdWGCNA also recommends using consensus workflow:

4.3 "Batch Effect" Phenomenon in Visualization
In cross-platform single-cell transcriptome data analysis, we often observe that DotPlot visualization results show obvious "batch effect" characteristics, where gene expression patterns between different platforms show significant differences. However, these visual differences do not completely reflect real biological differences, but are amplification effects caused by Seurat visualization parameter settings.
The scale parameter in Seurat::DotPlot function controls the standardization method of gene expression values:
- scale=TRUE (default setting): Performs Z-score standardization on the average expression value of each gene, amplifying relative differences between platforms
- scale=FALSE: Uses original average expression values, maintaining absolute difference levels of the data
scale=TRUE (Amplifying Differences): 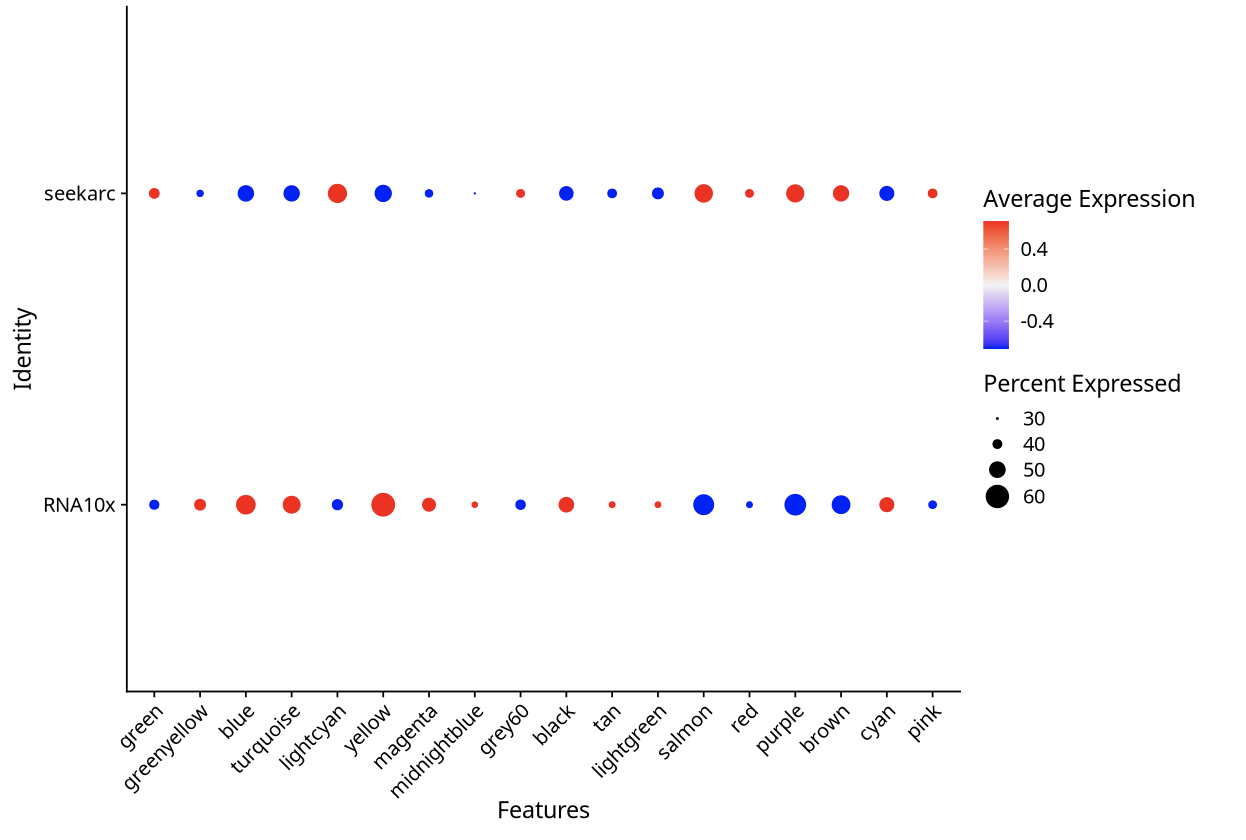
scale=FALSE (Maintaining Original Differences): 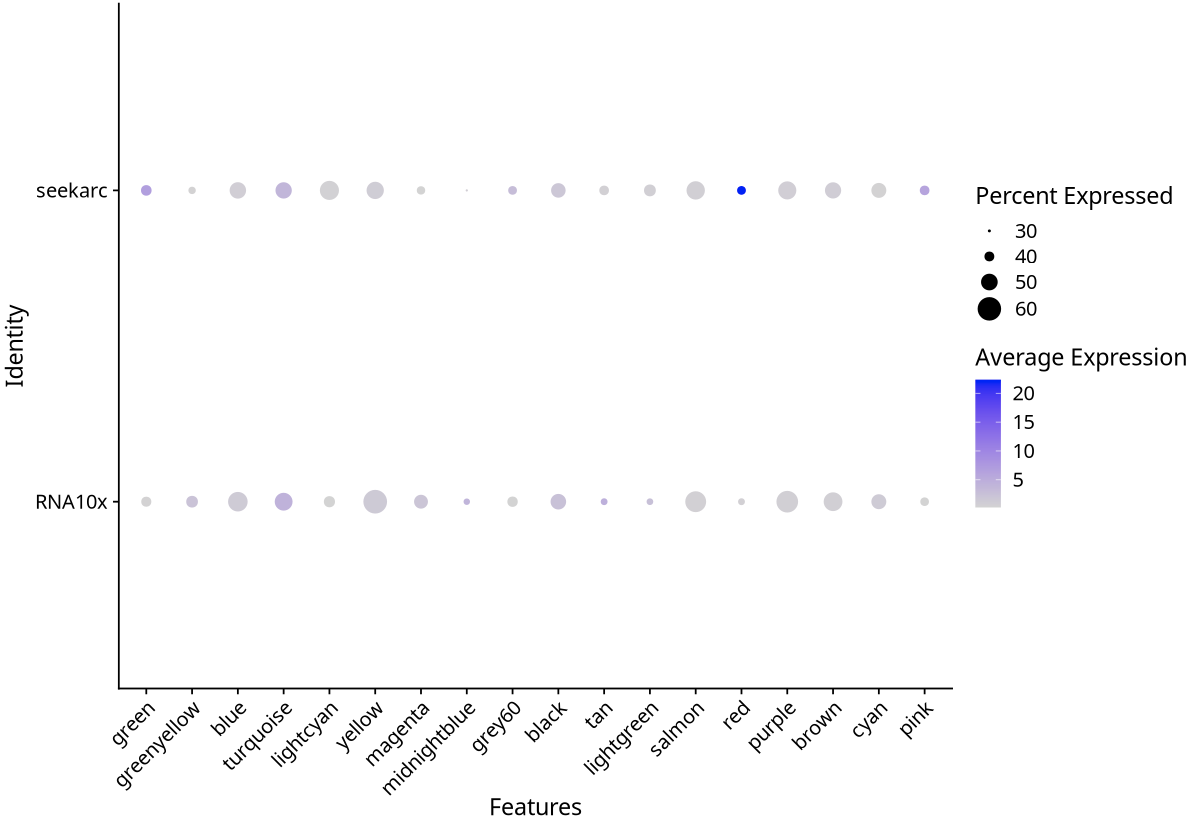
Seurat system prompts when plotting groups are fewer than 5: 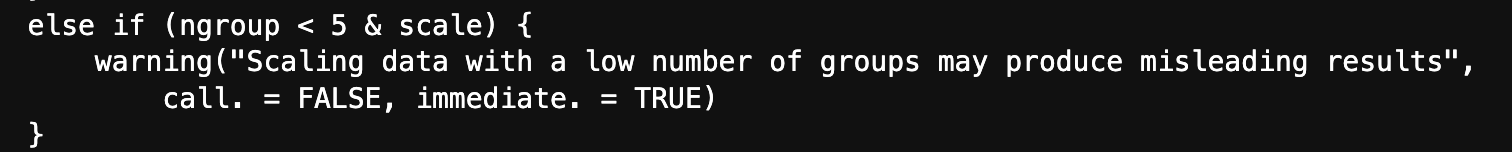
4.4 Summary
- Standard Workflow Robust: hdWGCNA standard workflow combined with Harmony can sufficiently weaken batch/platform effects in most cases, with stable module identification.
- Strong Batch Strategy: When cross-platform differences are strong, adopting
consensusworkflow can extract cross-platform conservative modules, improving result reproducibility and portability (see related link). - Matrix Selection: Prioritize
RNAorSCTexpression layers during network construction (see related link); if batch effects are very strong, consider constructing co-expression networks usingintegratedmatrix.
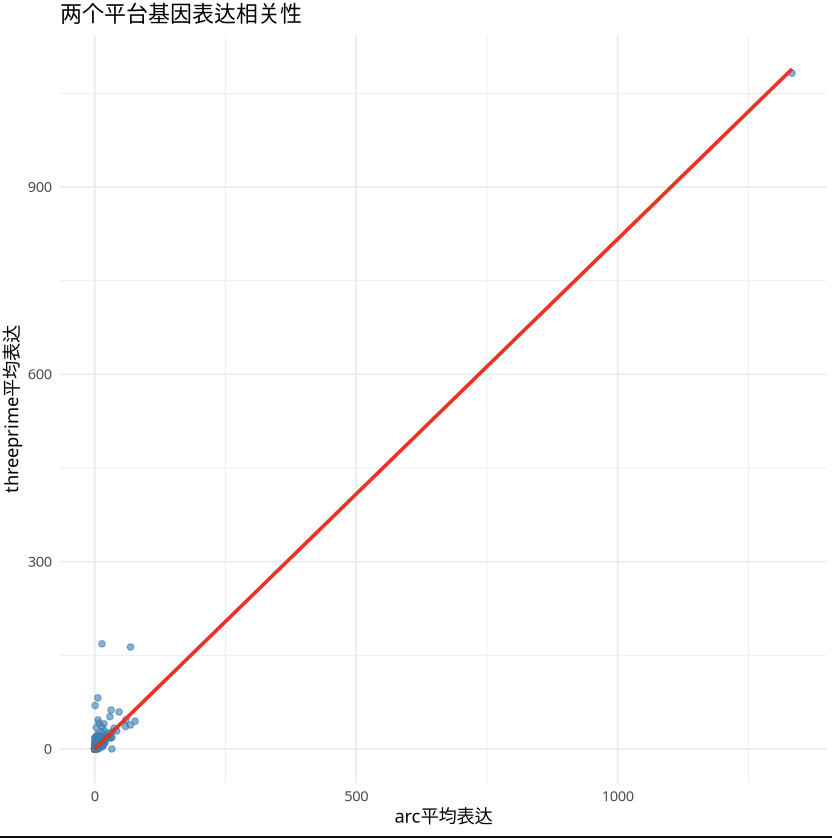
5. Gene Expression Correlation Between Platforms
For SeekARC and 10x single-cell transcriptome data from the same tissue and biological background, SeekARC and 10x have high consistency at the gene expression level (Pearson r≈0.97).
- Gene Average Expression Correlation (Full Gene Set Average Expression):
- Pearson correlation coefficient: 0.9743382060132
- Visualization as follows:
6. Conclusion
The data integration analysis results between SeekARC platform and 10x Genomics platform show:
- Excellent Data Compatibility: The two platforms have highly consistent data (correlation coefficient 0.974)
- Complete Analysis Workflow: Supports complete workflow from data preprocessing to advanced analysis
- Controllable Batch Effects: Provides multiple batch correction strategies, ensuring reliable analysis results
- Broad Application Prospects: Provides reliable technical support for cross-platform single-cell transcriptome research
SeekARC platform, as a new-generation single-cell ATAC dual-omics transcriptome sequencing technology, demonstrates excellent performance in data quality and analysis compatibility, effectively supporting multi-platform data integration analysis, providing strong technical guarantee for the in-depth development of single-cell transcriptome research.