SeekSpace Tools v1.0.2
SeekSpace® Tools is a software developed by SEEKGENE for processing single-cell spatial transcriptomics data. It extends the functionality of SeekSoul® Tools module for single-cell transcriptomic analysis, which includes barcode quantification, cell calling, and obtain a feature-barcode matrix that can be used for downstream analysis. For spatial libraries, SeekSpace® Tools can precisely locate cells on the chip by correlated spatial barcodes. It also able to segment tissue from background of slide image, conduct downstream clustering and differential analysis on successfully located cells, and allow spatial visualisation of cells.
Download
SeekSpace Tools v1.0.2
Download-SeekSpace Tools - md5: aaed58430702956b265036259e5e15e8
wget
mkdir seekspacetools_v1.0.2
cd seekspacetools_v1.0.2
wget -c -O seekspacetools_v1.0.2.tar.gz "https://seekgene-public.oss-cn-beijing.aliyuncs.com/software/seekspacetools/seekspacetools_v1.0.2.tar.gz"
curl
mkdir seekspacetools_v1.0.2
cd seekspacetools_v1.0.2
curl -C - -o seekspacetools_v1.0.2.tar.gz "https://seekgene-public.oss-cn-beijing.aliyuncs.com/software/seekspacetools/seekspacetools_v1.0.2.tar.gz"
Installation Guide
Installation:
# decompress
tar zxf seekspacetools_v1.0.2.tar.gz

# install
source ./bin/activate
./bin/conda-unpack

# export path in bashrc
export PATH=`pwd`/bin:$PATH
echo "export PATH=$(pwd)/bin:\$PATH" >> ~/.bashrc
Confirm installation:
seekspacetools --versionData preparation
Download sample datasets
sample datasets - md5: 208efa2d39d5190abec986e9b25aa685(Species: Mus musculus.)
wget
wget -c -O demo.tar "https://seekgene-public.oss-cn-beijing.aliyuncs.com/software/data/demodata/space/demo.tar"
# decompress
tar xf demo.tar
curl
curl -C - -o demo.tar "https://seekgene-public.oss-cn-beijing.aliyuncs.com/software/data/demodata/space/demo.tar"
# decompress
tar xf demo.tar
Download and build reference genome
Download-mouse-reference-mm10 - md5: 5d3f8ee65f75f8143ec88f77b1821fd8
wget
wget -c -O mm10.tar.gz "https://seekgene-public.oss-cn-beijing.aliyuncs.com/software/data/reference/mm10.tar.gz"
# decompress
tar -zxvf mm10.tar.gz
curl
curl -C - -o mm10.tar.gz "https://seekgene-public.oss-cn-beijing.aliyuncs.com/software/data/reference/mm10.tar.gz"
# decompress
tar -zxvf mm10.tar.gz
The assembly of the reference genome refers to How to build reference genome?
Run SeekSpace® Tools
Run tests
Example 1: Basic usage
IMPORTANT
Set up the necessary configuration files for the analysis, including paths to the sample data, chemistry versions, genome index, gene annotation file, etc. Run the SeekSpace® Tools using the following command:
seekspacetools run \
--fq1 /path/to/demo/demo_expression_S8_L007_R1_001.fastq.gz \
--fq2 /path/to/demo/demo_expression_S8_L007_R2_001.fastq.gz \
--spatialfq1 /path/to/demo/demo_spatial_S7_L007_R1_001.fastq.gz \
--spatialfq2 /path/to/demo/demo_spatial_S7_L007_R2_001.fastq.gz \
--hdmifq /path/to/demo/2P231224030A4.fq.gz \
--samplename demo \
--outdir /path/to/outdir \
--genomeDir /path/to/GRCh38/star \
--gtf /path/to/GRCh38/genes/genes.gtf \
--chemistry DDVS \
--core 4 \
--include-introns \
--forceCell 80000 \
--min_umi 200 \
--chip_id 2P231224030A4 \
--DAPI /path/to/demo/2P231224030A4.tif
NOTE
--HE is optional. If an H&E image is provided, the path to the H&E image must be specified.
Descriptions
IMPORTANT
| Parameters | Descriptions |
|---|---|
| --fq1 | Paths to R1 fastq files of RNA library |
| --fq2 | Paths to R2 fastq files of RNA library |
| --spatialfq1 | Paths to R1 fastq files of spatial library |
| --spatialfq2 | Paths to R2 fastq files of spatial library |
| --hdmifq | Path to HDMI fastq file of HDMI library |
| --samplename | Sample name. Only digits, letters, and underscores are supported. |
| --outdir | output directory. Default: ./ |
| --genomeDir | The path of the reference genome generated by STAR. The version needs to be consistent with the STAR used by SeekSpace® Tools. |
| --gtf | Path to the GTF file for the corresponding species. |
| --core | Number of threads used for the analysis. |
| --chemistry | Reagent type, with each type corresponding to a combination of --shift, --pattern, --structure, --barcode and --sc5p. Available options: DDVS.DDVS corresponds to the SeekSpace® Single Cell Spatial Transcriptomic Kit. |
| --skip_misB | If enabled, no base mismatch is allowed for barcode. Default is 1. |
| --skip_misL | If enabled, no base mismatch is allowed for linker. Default is 1. |
| --skip_multi | If enabled, discard reads that can be corrected to multiple white-listed barcodes. Barcodes are corrected to the barcode with the highest frequency by default. |
| --forceCell | Add this parameter with expected value N, SeekSpace® Tools will select the top N cells based on UMI from high to low. Default is 80000. |
| --min_umi | Minimum number of UMI for a cell. Cells with fewer UMI than this value will be discarded. Default is 200. |
| --include-introns | When disabled, only exon reads are used for quantification. When enabled, intron reads are also used for quantification. |
| --star_path | Path to another version of STAR for alignment. The version must be compatible with the --genomeDir version. The default --star_path is the STAR in the environment. |
| --chip_id | Chip ID |
| --DAPI | Slide image with DAPI staining in TIFF format. |
| --HE | Slide image with H&E staining in TIFF format. |
Example 2: Skip read processing steps and start from image processing:
seekspacetools realign \
--results_path /path/to/outdir \
--outdir /path/to/new_dir \
--samplename demo \
--chip_id 2P231224030A4 \
--core 4 \
--DAPI /path/to/demo/2P231224030A4.tif \
--alignment_file /path/to/demo/parameters.json \
--lenient_segmentation
NOTE
--HE is optional. If an H&E image is provided, the path to the H&E image must be specified.
Descriptions
| Parameters | Descriptions |
|---|---|
| --results_path | Path of directory that has outputs from the first run of seekspacetools. |
| --outdir | output directory. Default: ./ |
| --samplename | Sample name. |
| --chip_id | Chip ID |
| --core | Number of threads used for the analysis. |
| --DAPI | Slide image with DAPI staining in TIFF format. |
| --HE | Slide image with H&E staining in TIFF format. |
| --alignment_file | alignment file of image alignment parameters. |
| --lenient_segmentation | optional, whether to enable lenient segmentation strategy. |
Output descriptions
"Here's the output directory structure: each line represents a file or folder, indicated by "├──", and the numbers indicate three important output files.
./
├── Outs
│   ├── demo_report.html                           1
│   ├── demo_summary.csv                           2
│   ├── demo_aligned_DAPI.png                      3
│   ├── demo_aligned_HE.png (optional)             4
│   ├── demo_aligned_HE_TIMG.png (optional)        5
│   ├── demo_filtered_feature_bc_matrix            6
│   │   ├── barcode.tsv.gz
│   │   ├── feature.tsv.gz
│   │   ├── matrix.tsv.gz
│   │   └── cell_location.tsv.gz                   7
│   └── clustering
│       └── demo.rds                               8
└── Analysis
    ├── scRNA-seq_Analysis
    │   ├── step1
    │   ├── step2
    │   │   ├── featureCounts
    │   │   │   └── demo_SortedByName.bam
    │   │   └── STAR
    │   │       ├── demo_Log.final.out
    │   │       └── demo_SortedByCoordinate.bam
    │   └── step3
    │       ├── filtered_feature_bc_matrix
    │       └── raw_feature_bc_matrix
    ├── Spatial_Positioning
    │   ├── demo_valid_spatial_umis.csv.gz
    │   └── demo_spatial_umis_cleaned.csv.gz
    └── Tissue_Detection
        └── demo_bc_under_tissue.csv
NOTE
- Final report in html
- Quality control information in csv
- Slide image in DAPI staining
- Slide image in H&E staining(optional)
- Slide thumbnail in H&E staining(optional)
- Filtered feature-barcode matrix
- cell coordinates file
- matrix in rds format
Algorithms Overview
RNA library analysis
NOTE
SeekSpace® Tools use the SeekSoul® Tools RNA module for the analysis of RNA libraries; specific algorithm descriptions can be found in SeekSoul(R) Tools。
R1 structure of spatial transcriptomic RNA library: 
Cell calling
In comparison to SeekSoul® Tools, SeekSpace® Tools using the "forceCell" method during cell calling. It extracts the UMI counts of the top 80,000 cells by default and uses a min_umi count of 200 as the threshold to calling out cells for generating filtered matrix.
Spatial positioning
Retrieval of spatial barcodes and associated coordinates
There are two types of libraries related to spatial positioning, the spatial library and the HDMI library.
Spatial library
R1 structure of spatial library is the same as RNA library. R2 structure is as follows:

For the R1 of spatial library, the cell barcode correction and UMI extraction are also performed using the rna module of SeekSoul® Tools. Subsequently, spatial barcodes are extracted from R2 to create correlations between cell barcodes and spatial barcodes. Unlike UMIs in the RNA library, UMIs in the spatial library represent the expression level of each spatial barcode on each cell.
The HDMI library is a single-end sequencing library where each read contains a 32-base spatial barcode, and each spatial barcode having corresponding positional information. We utilized the spatial barcodes extracted from the spatial library as a whitelist and run the rna module of SeekSoul® Tools to correct the spatial barcodes in the HDMI library, while also retrieve the coordinates of spatial barcodes.
Filtering
IMPORTANT
- Some of the extracted spatial barcodes from spatial library may be invalid. These invalid barcodes could result from the inclusion of shorter mRNA fragments from the RNA library. Since these fragments are not present in the HDMI library, coordinates cannot be provided. Apart from the factor mentioned above, sequencing errors can also lead to invalid barcodes. To ensure accuracy, we exclude these invalid spatial barcodes from the analysis.
- In the HDMI library, some spatial barcodes may appear multiple times with different coordinates. Since we cannot determine the exact spatial positions of these spatial barcodes, they will be filtered out.
- For certain spatial barcodes, we observed an unusually high level of UMI support. We think this might be because these spatial barcodes detached from the chip during the experiment and get in droplets. These particular spatial barcodes are considered inaccurate. To filter out these erroneous spatial barcodes, we took the following steps
- Dividing the chip into bins of size 30x30.
- Counting total number of UMI support for spatial barcodes in each bin.
- Sorting bins in descending order of UMI supports.
- Calculating threshold based on the distribution of sorted bins.
- If the UMI support of a bin exceeds the threshold, we remove all spatial barcodes corresponding to the cell barcode with the highest UMI support in that bin.
- Finally, we filtered out all cell barcodes that are not cells during cell calling and their corresponding spatial barcodes, only positioning cells with biological significance.
Cell position determination
IMPORTANT
When determining the center position of a cell, we must take into account the existence of noisy spatial barcodes. These spatial barcodes may exist as background in droplets during the experiment or marked on nuclear fragments, leading to multiple positions on the chip. Therefore, we need to filter out cells with multiple centers to ensure that cells with clearly defined center are retained.
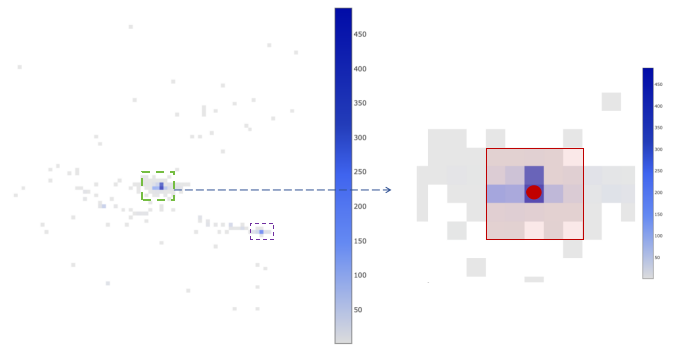
Spatial barcode distribution of a cell is displayed on the left. Each grid represents a bin. The size of each bin is about 100 pixels. Each side equivalent to 26.5 micrometers. The color of each bin represents the level of UMI support of the spatial barcode in that bin, and the deeper the color, the higher the UMIs.
The figure on the right is a magnified view of the image within the green box in the left figure. The bin where the red dot is located represents the bin with the highest UMI support of the cell, which is defined as the center of the cell. The center bin and the 24 bins around center, which are included in the red box, is defined as the core of the cell. To determine whether the cell has multiple centers, we need to find the secondary center. The secondary center is defined as the bin with the highest UMI support that is not in the core. We calculate the ratio of the total UMI number in the core to the total UMI number in the secondary center and 24 surrounding bins. If the ratio is greater than or equal to 2, we considered the cell has an unique center. For other cells, we think they have multiple centers and exclude these cells.
Finally, we can determine the position of the cell using the spatial barcode distribution in the core.
After the processing procedures described above, the following indicators are available:
- Total Spatial Reads: The number of reads in the spatial library, indicating the total number of reads after the sequencing procedure.
- Valid Spatial Reads: The number of valid spatial reads, which refers to the number of reads with R1 barcode that do not need to be corrected or corrected successfully, and R2 with at least 32 bps in length.
- Total Spatial UMIs: The total number of spatial UMIs, indicating the number of UMIs when Cell barcodes, UMIs, and spatial barcodes are extracted and deduplicated from valid spatial reads.
- Spatial Barcode Saturation: The spatial library saturation. 1 - Total Spatial UMIs/Valid Spatial Reads
- Valid Spatial UMIs: The number of valid spatial UMIs, which refers to the number of UMIs supported by the remaining spatial barcodes after excluding invalid spatial barcodes
- Spatial UMIs with Unique Locations: The proportion of UMIs supported by spatial barcode with unique location to the valid spatial UMIs
- Accurate Spatial UMIs: The proportion of UMIs supported by accurate spatial barcodes to the valid spatial UMIs
- Accurate Spatial UMI Bins: The proportion of bins with accurate spatial barcodes to the total number of bins
- Cell-Identified Spatial UMIs: Spatial UMIs associated with cells. The proportion of UMIs supported by cell barcode identified as cells to the accurate spatial UMIs
- Mean Spatial UMIs per Cell:The average number of spatial UMIs per cell, which is the number of spatial UMIs associated with cells divided by the number of identified cells
Tissue Detection
- SeekSapce® Tools are able to identify tissue and extracts cells under tissue coverage for subsequent analysis. It can received DAPI stained images and H&E stained images after image registration. The input image is scaled and smoothed, and image processing algorithms in OpenCV are used to separate tissue from background. Throughout the process, the aspect ratio of the image remains consistent with the original image.
- If the tissue and the cell region do not overlap completely, SeekSpace® Tools provides a manual alignment toolkit. By using the manual alignment toolkit, the tissue image can be uniformly scaled, translated, and rotated. Alignment parameters can be downloaded, and then re-entered into SeekSpace® Tools to generate a new tissue image to ensure accurate correspondence between the tissue image and the cell region.
Subsequent analysis
After we got filtered matrix of cells under the tissue, we can proceed to downstream analysis.
Seurat analysis
SeekSpace® Tools use Seurat to calculate the mitochondrial content, number of genes, and UMIs of each cell. After that, the gene expression matrix is normalized, and a subset of features that exhibit high cell-to-cell variation in the dataset is identified. Linear dimensional reduction using PCA is then performed, and the result is passed to t-SNE and UMAP for visualization. A graph-based clustering procedure is then followed, and cells are partitioned into different clusters. Finally, SeekSpace® Tools finds markers that define clusters via differential expression.
Release Notes
v1.0.2
New Features
- Add parameter for adjusting tissue segmentation, optimize recognition of low-signal tissue areas
- Optimize Websummary interface, implement gene number, UMI number and mitochondrial content filtering, and display cell number changes in real time
Improvements
- Reconstruct multi-process scheduling mechanism, significantly improve CPU utilization
- Enhance GTF file parsing compatibility: support transcript annotations without exon_id attribute, and add exon recognition logic based on type=exon
- Re-design lncRNA quantification algorithm, correct median calculation method
- Add spatial transcriptomics data quality control metrics: spatial barcode and spatial UMI Q30 statistics
- Optimize filtered_feature_bc_matrix output, extract valid cell spatial location information under tissue coverage
v1.0.0
First Release
- Release stable version, support standard analysis process for spatial transcriptomics data