单细胞甲基化 + RNA 双组学多样本整合分析流程 (ALLCools)
加载 python 分析包
import os
import re
import glob
from ALLCools.mcds import MCDS
from ALLCools.clustering import tsne, significant_pc_test, log_scale, lsi, binarize_matrix, filter_regions, cluster_enriched_features, ConsensusClustering, Dendrogram, get_pc_centers
from ALLCools.clustering.doublets import MethylScrublet
from ALLCools.plot import *
import scanpy as sc
import scanpy.external as sce
from harmonypy import run_harmony
import numpy as np
import pandas as pd
import matplotlib.pyplot as plt
import matplotlib.colors as mcolors
from matplotlib.lines import Line2D
import warnings
import xarray as xr
from ALLCools.clustering import one_vs_rest_dmg
import pybedtools
from scipy import sparsesamples = ["HC10_12","HC14_21"]
var_dim = 'chrom20k'
obs_dim = 'cell'
mc_type = 'CGN'
quant_type = 'hypo-score'- 输入文件夹结构
HC10_12
├── HC10_12_exp
│   └── HC10_12
│       └── Analysis
│            └── step3
│                ├── filtered_feature_bc_matrix
│                └── raw_feature_bc_matrix
└── HC10_12_methy
    └── step3
        ├── allcools_generate_datasets
        └── split_BAMs
            ├── filtered_barcode_reads_counts.csv
            └── HC10_12_cells.csv
⚠️ 重要提示
本教程适用于上述目录结构。如果您的文件组织结构不同,请相应调整文件夹路径或修改代码中的文件地址。
⚠️ 重要提示
如果试剂类型为 DD-MET3,则需要读取对应关系
gex_mc_bc_map = pd.read_csv("/PROJ2/FLOAT/weiqiuxia/project/20241227_methy/script/SeekSoulMethyl/nf/bin/barcodes/DD-M_bUCB3_whitelist.csv",index_col=None)单细胞 RNA 测序数据多样本整合分析流程
数据预处理流程
标准化与转换
计数标准化
采用总计数归一化方法,消除细胞间测序深度差异,确保公平比较稳定方差转换
应用对数转换(log1p),使高表达的基因不会过度主导分析结果
特征基因筛选
通过统计学方法识别2000 个高变基因,这些基因在不同细胞间表现出显著的表达差异,最有可能反映重要的生物学信号。
批次效应校正
Harmony 算法应用
使用先进的 Harmony 集成学习方法,优雅地解决多样本间的技术变异问题:
细胞图谱构建
邻域关系计算
基于校正后的特征空间,构建细胞的k-近邻图(k=30),量化细胞间的相似性关系。
聚类分析
采用Leiden 算法进行细胞群体识别,该算法能够发现高质量的社区结构,分辨率参数设置为 0.5 以获得适中的聚类粒度。
可视化呈现
UMAP 降维
保留数据的拓扑结构,提供直观的细胞分布视图
# Read Expression data and add meta data to RNA and MET data
obj_rna_list = {}

for i in samples:
    s_rna_path = os.path.join(f'{i}', f'{i}_exp',f'{i}', 'Analysis', 'step3', 'filtered_feature_bc_matrix')
    obj_rna_list[i] = sc.read_10x_mtx(s_rna_path)
    #obj_rna_list[i].obs['batch']=f'{i}'

adata_rna=obj_rna_list[samples[0]].concatenate([obj_rna_list[i] for i in samples[1:] ])
adata_rna.obs['Sample'] = adata_rna.obs['batch'].map(
    {f'{index}': value for index, value in enumerate(samples)}
)
sc.pp.normalize_total(adata_rna, inplace=True)
sc.pp.log1p(adata_rna)
sc.pp.highly_variable_genes(adata_rna, n_bins=100, n_top_genes=2000)
adata_rna.raw = adata_rna
adata_rna = adata_rna[:, adata_rna.var.highly_variable]
sc.pp.scale(adata_rna, max_value=10)
sc.tl.pca(adata_rna)
ho = run_harmony(adata_rna.obsm['X_pca'],
                 meta_data=adata_rna.obs,
                 vars_use='Sample',
                 random_state=0,
                 max_iter_harmony=20)
adata_rna.obsm['X_pca_harmony'] = ho.Z_corr.T
reduc_use = 'X_pca_harmony'
sc.pp.neighbors(adata_rna,n_neighbors=30,use_rep = reduc_use)
sc.tl.umap(adata_rna)
sc.tl.tsne(adata_rna,use_rep=reduc_use)
sc.tl.leiden(adata_rna, resolution=0.5)Loading chunk 0-4254/4254
/PROJ2/FLOAT/jinwen/apps/miniconda3/envs/allcools/lib/python3.8/site-packages/anndata/_core/anndata.py:1763: FutureWarning: The AnnData.concatenate method is deprecated in favour of the anndata.concat function. Please use anndata.concat instead.
See the tutorial for concat at: https://anndata.readthedocs.io/en/latest/concatenation.html
warnings.warn(
/PROJ2/FLOAT/jinwen/apps/miniconda3/envs/allcools/lib/python3.8/site-packages/scanpy/preprocessing/_simple.py:843: UserWarning: Received a view of an AnnData. Making a copy.
view_to_actual(adata)
2025-12-19 09:38:10,630 - harmonypy - INFO - Computing initial centroids with sklearn.KMeans...n 2025-12-19 09:38:17,948 - harmonypy - INFO - sklearn.KMeans initialization complete.
2025-12-19 09:38:18,019 - harmonypy - INFO - Iteration 1 of 20
2025-12-19 09:38:21,758 - harmonypy - INFO - Iteration 2 of 20
2025-12-19 09:38:25,497 - harmonypy - INFO - Iteration 3 of 20
2025-12-19 09:38:28,234 - harmonypy - INFO - Iteration 4 of 20
2025-12-19 09:38:29,424 - harmonypy - INFO - Iteration 5 of 20
2025-12-19 09:38:30,781 - harmonypy - INFO - Converged after 5 iterations
RNA 单组细胞注释
marker_names = ["CD3D","NKG7","CD8A","CD4","CD79A","MS4A1","JCHAIN","LYZ","LILRA4"]
sc.pl.umap(adata_rna,color = marker_names)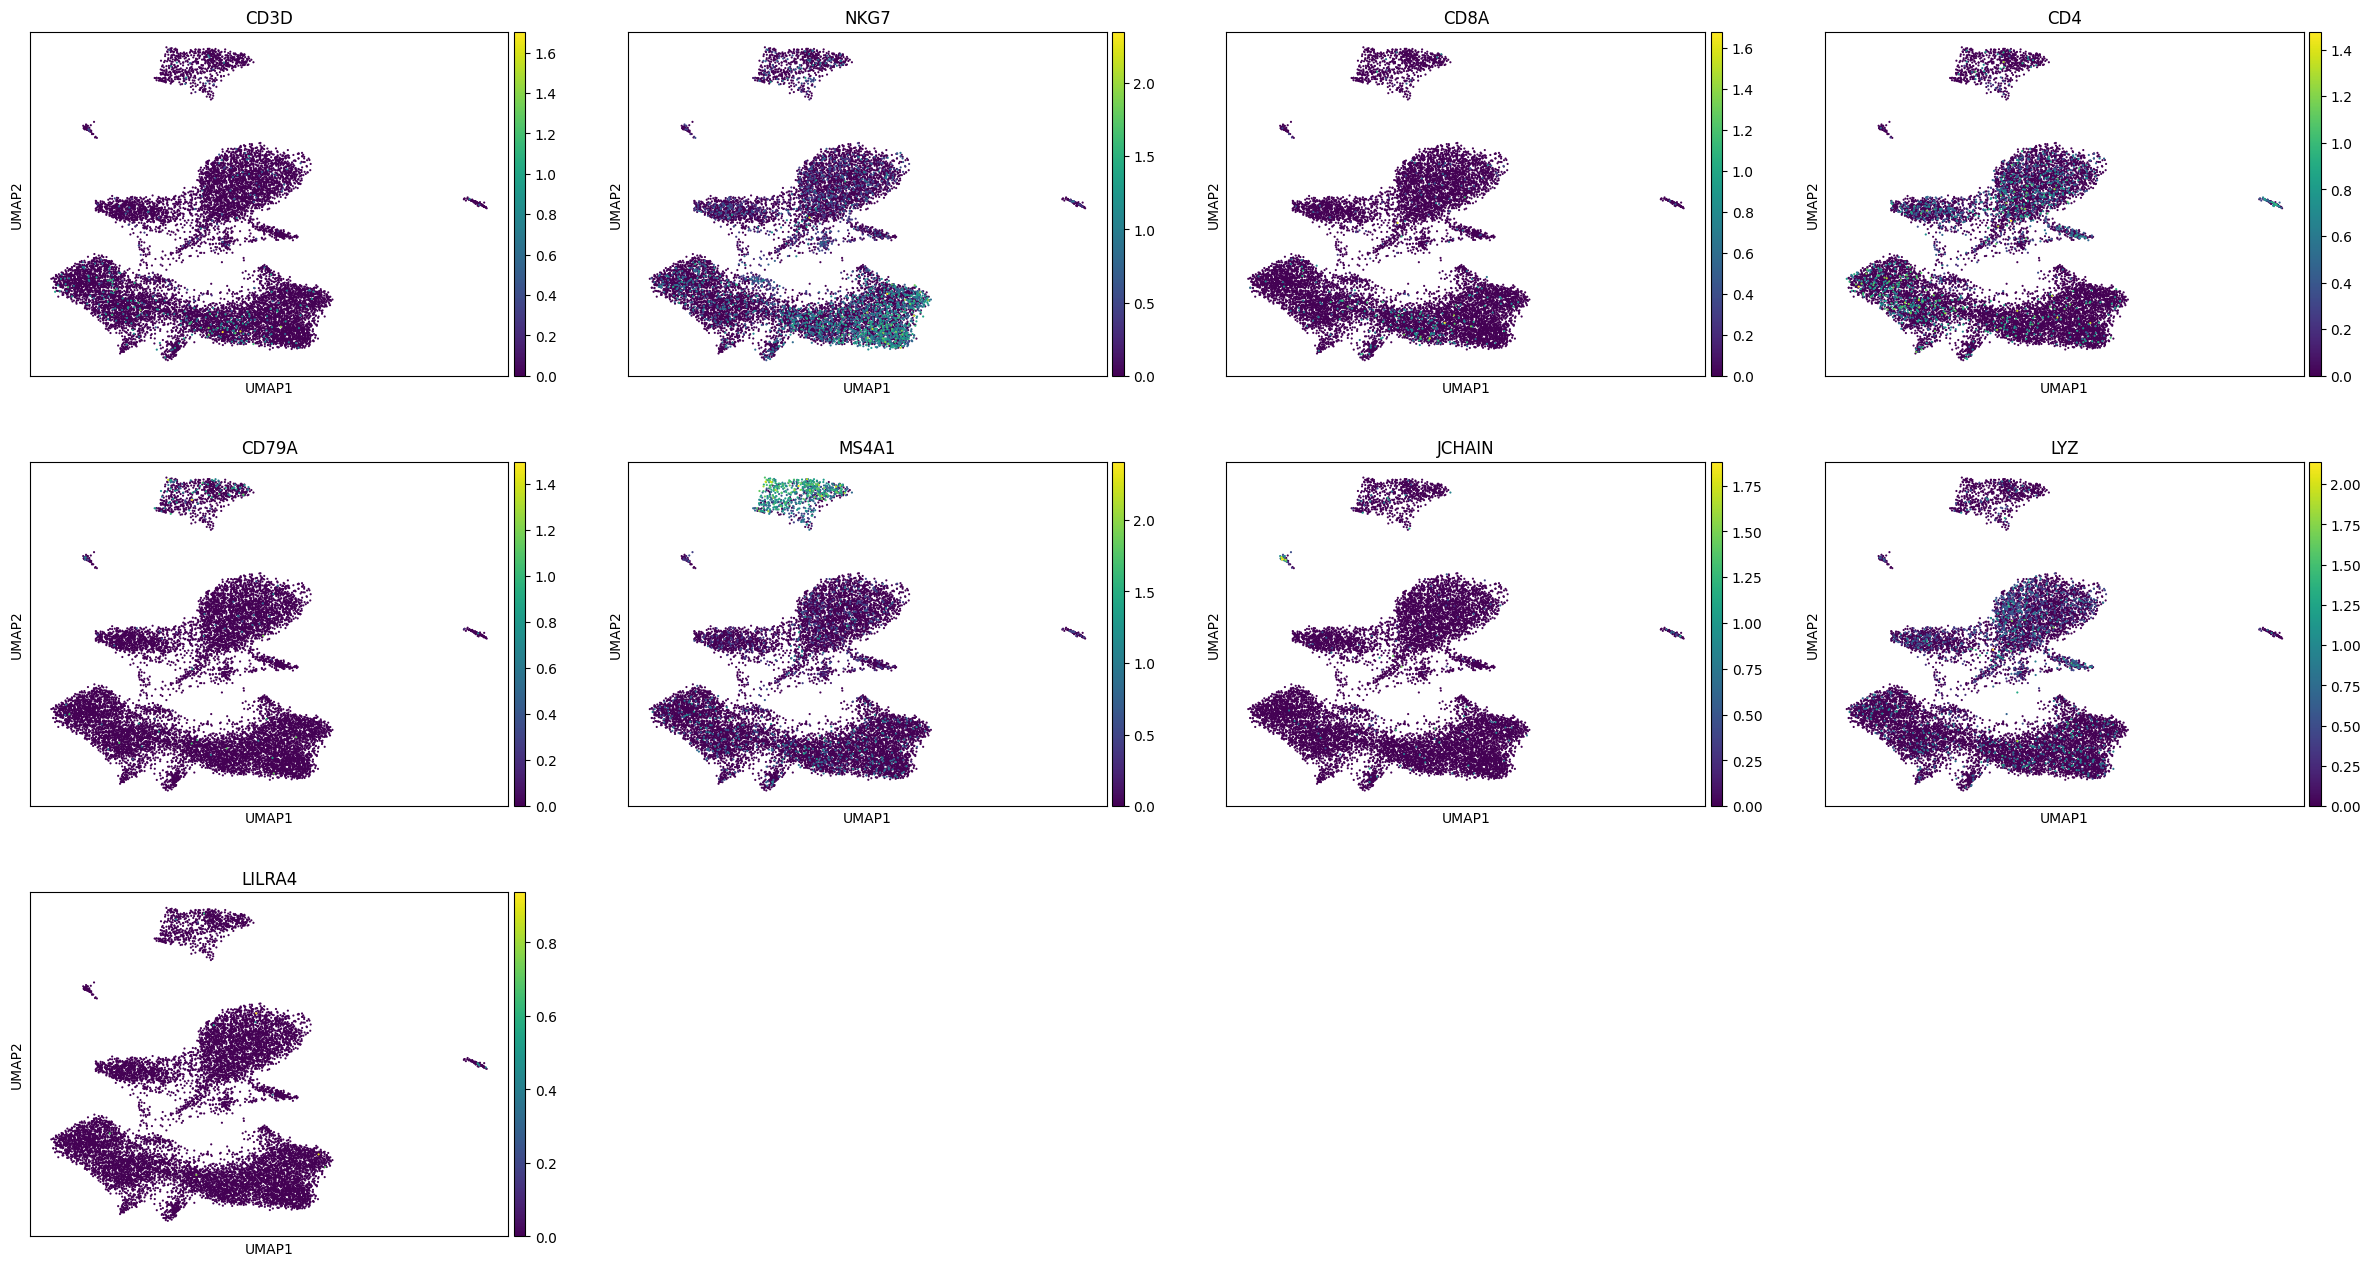
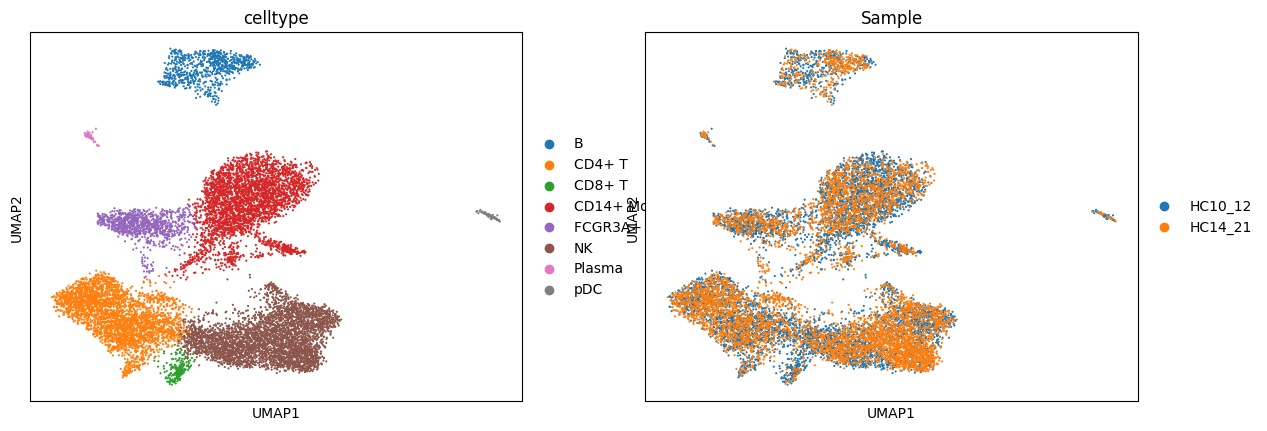
celltype = {
    '0': 'NK',
    '1': 'CD14+ Mono',
    '2': 'CD4+ T',
    '3': 'FCGR3A+ Mono',
    '4': 'B',
    '5': 'CD14+ Mono',
    '6': 'CD8+ T',
    '7': 'pDC',
    '8': 'Plasma'
}

adata_rna.obs['celltype'] = adata_rna.obs['leiden'].map(celltype)sc.pl.umap(adata_rna, color = ['celltype', 'Sample'])cax = scatter(
/PROJ2/FLOAT/jinwen/apps/miniconda3/envs/allcools/lib/python3.8/site-packages/scanpy/plotting/_tools/scatterplots.py:394: UserWarning: No data for colormapping provided via 'c'. Parameters 'cmap' will be ignored
cax = scatter(
单细胞甲基化测序数据分析流程
数据预处理
矩阵二值化处理
设置95%阈值进行数据二值化:
- 高于阈值:标记为高甲基化状态
- 低于阈值:标记为低甲基化状态
- 目的:突出显著的表观遗传差异
区域过滤
智能过滤基因组区域,保留:
- 高度可变的甲基化区域
- 信息丰富的表观遗传标记
特征提取与降维
LSI(潜在语义索引)分析
采用 ARPACK 算法进行线性降维,提取:
- 基因组甲基化模式的主成分
- 细胞间的表观遗传相似性
- 低维空间中的甲基化特征
批次效应校正
Harmony 集成学习
- 输入: LSI 降维结果 + 样本元数据
- 批次变量: 样本来源(SAMple)
- 随机种子: 0(确保可重复性)
- 最大迭代: 20 次(平衡速度与精度)
- 输出: 校正后的表观遗传空间
校正效果:
- 清洁样本间的技术变异
- 增强生物学信号的保真度
细胞图谱构建
邻近图构建
基于校正后的特征空间,建立细胞的30-最近邻网络,量化细胞间的表观遗传相似性。
聚类分析
使用Leiden 算法进行细胞群体识别:
- 聚类依据:低甲基化特征相似性
- 输出:表观遗传定义的细胞簇
# MET data integration
# Read Methylation mcds
obj_met_list = {}
mcds_paths = {}
for i in samples:
    mcds_path = os.path.join(f'{i}', f'{i}_methy','step3','allcools_generate_datasets', f'{i}.mcds')

    mcds_paths[i] = mcds_path
    mcds = MCDS.open(mcds_path, obs_dim = 'cell', var_dim = var_dim)
    adata = mcds.get_score_adata(mc_type=mc_type, quant_type=quant_type, sparse = True)
    obj_met_list[i] = adata

adata_met = obj_met_list[samples[0]].concatenate([obj_met_list[i] for i in samples[1:] ])


adata_met.layers['raw'] = adata_met.X.copy()
adata_met.obs['Sample'] = adata_met.obs['batch'].map(
    {f'{index}': value for index, value in enumerate(samples)}
)
binarize_matrix(adata_met, cutoff=0.95)
filter_regions(adata_met)

lsi(adata_met, algorithm='arpack', obsm='X_lsi')
significant_pc_test(adata_met, p_cutoff=0.1, obsm='X_lsi', update=True)

ho = run_harmony(adata_met.obsm['X_lsi'],
                 meta_data=adata_met.obs,
                 vars_use='Sample',
                 random_state=0,
                 max_iter_harmony=20)
adata_met.obsm['X_lsi_harmony'] = ho.Z_corr.T
reduc_use = 'X_lsi_harmony'

sc.pp.neighbors(adata_met,use_rep = reduc_use, n_neighbors=30)
sc.tl.umap(adata_met)
sc.tl.tsne(adata_met,use_rep=reduc_use)
sc.tl.leiden(adata_met, resolution=0.5)
#adata_met.write_h5ad('adata_met.h5ad')Loading chunk 0-4254/4254
/PROJ2/FLOAT/jinwen/apps/miniconda3/envs/allcools/lib/python3.8/site-packages/anndata/_core/anndata.py:1763: FutureWarning: The AnnData.concatenate method is deprecated in favour of the anndata.concat function. Please use anndata.concat instead.
See the tutorial for concat at: https://anndata.readthedocs.io/en/latest/concatenation.html
warnings.warn(
87948 regions remained.
2025-12-19 09:43:25,691 - harmonypy - INFO - Computing initial centroids with sklearn.KMeans...n
9 components passed P cutoff of 0.1.
Changing adata.obsm['X_pca'] from shape (8523, 100) to (8523, 9)
2025-12-19 09:43:27,280 - harmonypy - INFO - sklearn.KMeans initialization complete.
2025-12-19 09:43:27,315 - harmonypy - INFO - Iteration 1 of 20
2025-12-19 09:43:29,489 - harmonypy - INFO - Iteration 2 of 20
2025-12-19 09:43:31,702 - harmonypy - INFO - Iteration 3 of 20
2025-12-19 09:43:33,883 - harmonypy - INFO - Iteration 4 of 20
2025-12-19 09:43:36,109 - harmonypy - INFO - Iteration 5 of 20
2025-12-19 09:43:38,285 - harmonypy - INFO - Iteration 6 of 20
2025-12-19 09:43:40,491 - harmonypy - INFO - Iteration 7 of 20
2025-12-19 09:43:42,737 - harmonypy - INFO - Iteration 8 of 20
2025-12-19 09:43:44,954 - harmonypy - INFO - Iteration 9 of 20
2025-12-19 09:43:46,153 - harmonypy - INFO - Iteration 10 of 20
2025-12-19 09:43:47,429 - harmonypy - INFO - Iteration 11 of 20
2025-12-19 09:43:48,468 - harmonypy - INFO - Iteration 12 of 20
2025-12-19 09:43:49,388 - harmonypy - INFO - Iteration 13 of 20
2025-12-19 09:43:50,300 - harmonypy - INFO - Iteration 14 of 20
2025-12-19 09:43:51,118 - harmonypy - INFO - Iteration 15 of 20
2025-12-19 09:43:52,079 - harmonypy - INFO - Converged after 15 iterations
rna_meta = adata_rna.obs
rna_meta["gex_cb"] = rna_meta.index
rna_meta["gex_cb"] =[re.sub('-.*','', b) for b in rna_meta["gex_cb"] ]
rna_meta = rna_meta.merge(gex_mc_bc_map)
rna_meta["m_cb"] = rna_meta["m_cb"].astype(str) + "-" + rna_meta["batch"].astype(str)
rna_meta.index = rna_meta["m_cb"]
rna_meta = rna_meta.loc[adata_met.obs.index,]
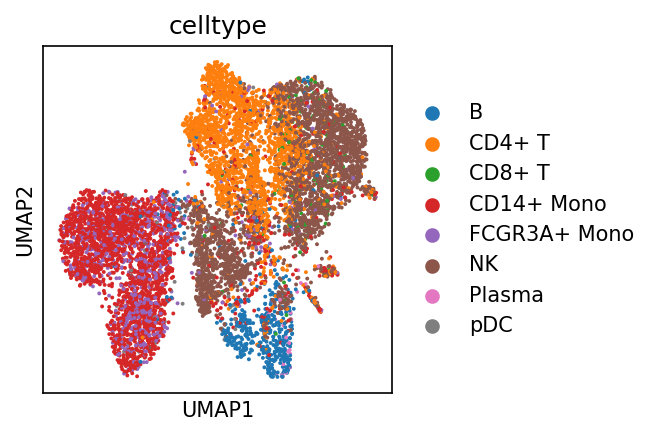
adata_met.obs["celltype"] = rna_meta["celltype"]
adata_met.obs["celltype"] = adata_met.obs["celltype"].astype('category')plt.rcParams['figure.dpi'] = 150
plt.rcParams['figure.figsize'] = (3,3)
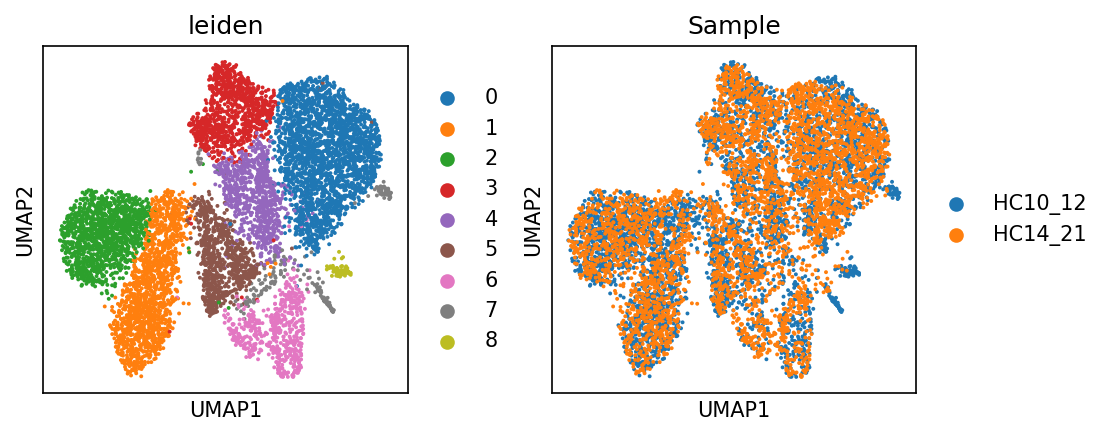
sc.pl.umap(adata_met, color = ['leiden', 'Sample'])cax = scatter(
/PROJ2/FLOAT/jinwen/apps/miniconda3/envs/allcools/lib/python3.8/site-packages/scanpy/plotting/_tools/scatterplots.py:394: UserWarning: No data for colormapping provided via 'c'. Parameters 'cmap' will be ignored
cax = scatter(
sc.pl.umap(adata_met, color = ['celltype'])cax = scatter(
细胞组成比例
展示了不同样本中各细胞类型的相对丰度。堆叠柱状图直观地反映了细胞组成的样本间异质性。
样本-细胞类型比例分布图
该图展示了各样本中不同甲基化细胞类型的占比情况。
- X 轴:代表不同的样本(SAMple)。
- Y 轴:代表细胞比例(Proportion, 0-1.0)。
- 颜色:不同颜色的色块代表不同的甲基化细胞类型。
def plot_bar_fraction_data(adata, x_key, y_key):
    df = adata_met.obs[[x_key, y_key]].copy()
    df[y_key] = df[y_key].astype('category')
    df[x_key] = df[x_key].astype('category')

    counts = df.groupby([x_key, y_key]).size().reset_index(name='count')
    totals = counts.groupby(x_key)['count'].transform('sum')
    counts['prop'] = counts['count'] / totals

    prop_pivot = counts.pivot(index=x_key, columns=y_key, values='prop').fillna(0)

    clusters = list(prop_pivot.columns)
    if f'{y_key}_colors' in adata_met.uns.keys():
        palette = adata.uns['celltype_colors']
    palette = sc.pl.palettes.default_20
    color_map = {c: palette[i % len(palette)] for i, c in enumerate(clusters)}
    bar_colors = [color_map[c] for c in clusters]

    return prop_pivot, bar_colors


# 计算每个样本的各 cluster 占比并绘制堆叠柱状图
y_key = 'celltype'
prop_pivot, bar_colors = plot_bar_fraction_data(adata_met, x_key = "Sample", y_key = y_key)
plt.rcParams['figure.dpi'] = 150
plt.rcParams['figure.figsize'] = (3,3)
fig, ax = plt.subplots()
prop_pivot.plot(kind='bar', stacked=True, color=bar_colors, ax=ax)
ax.set_ylabel('Proportion')
ax.set_xlabel("Sample")
ax.legend(title=y_key, bbox_to_anchor=(1, 1), loc='upper left', frameon=False, fontsize=7, markerscale=0.5, handlelength=1.0, handletextpad=0.4, borderaxespad=0.4)
plt.tight_layout()

#prop_pivot.to_csv(f'{sample_col}_{y_key}_frac.csv')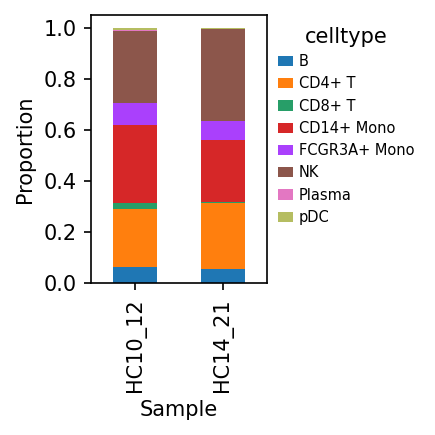
质控指标的空间分布可视化
质控指标分布分析:UMAP 图可视化
可视化目的
通过 UMAP 降维空间可视化关键质控指标,我们能够直观地评估数据质量在细胞群体中的分布模式,识别潜在的技术偏差区域,并验证细胞亚群划分的可靠性。
total_cpg_number | CpG 位点总数
解读要点:颜色梯度从深蓝到亮黄,反映了每个细胞捕获的甲基化位点总量
- 亮黄色区域:信息丰富,甲基化景观全面
- 深蓝色区域:数据稀疏,需谨慎解读生物学意义
- 异常模式:特定细胞簇普遍呈现低值可能提示技术问题
reads_counts | 测序深度
解读要点:展现每个细胞的独特比对序列数目
- 深度与精度:足够的测序深度是甲基化定量准确性的保障
- 质控标准:系统性低深度区域可能需考虑技术过滤
genome_cov | 基因组覆盖度 (0-1)
解读要点:量化测序数据在基因组区域的覆盖比例
- 全面性指标:高覆盖度代表更完整的表观遗传图谱
- 技术验证:异常低覆盖度可能指向细胞裂解或扩增问题
CpG% | CpG 甲基化率 (0-100%)
解读要点:展现整体 CpG 位点的甲基化水平
- 功能关联:通常与基因沉默和染色质状态相关
- 细胞状态:不同分化或功能状态的细胞可能呈现特征性模式
- 质量相关:极端高/低值可能反映技术异常而非生物学差异
CH% | CH 非 CpG 甲基化率 (0-100%)
解读要点:揭示非经典甲基化位点的修饰水平
- 生物学特化:在神经元、干细胞等特定类型中具有调控意义
- 信号识别:与 CpG%模式互补,提供更全面的表观遗传视图
- 基线参考:哺乳动物中通常维持较低水平,异常高值需审慎验证
def compute_cg_ch_level(df):
    # comput cpg methylation levels and ch methylation levels
    cg_cov_col = [i for i in df.columns[df.columns.str.startswith('CG')].to_list() if i.endswith('_cov')]
    cg_mc_col = [i for i in df.columns[df.columns.str.startswith('CG')].to_list() if i.endswith('_mc')]
    ch_cov_col = [i for i in df.columns[df.columns.str.contains('^(CT|CC|CA)')].to_list() if i.endswith('_cov')]
    ch_mc_col = [i for i in df.columns[df.columns.str.contains('^(CT|CC|CA)')].to_list() if i.endswith('_mc')]

    df['CpG_cov'] = df[cg_cov_col].sum(axis=1)
    df['CpG_mc'] = df[cg_mc_col].sum(axis=1)
    df['CpG%'] = round(df['CpG_mc'] * 100 / df['CpG_cov'], 2)

    df['CH_cov'] = df[ch_cov_col].sum(axis=1)
    df['CH_mc'] = df[ch_mc_col].sum(axis=1)
    df['CH%'] = round(df['CH_mc'] * 100 / df['CH_cov'], 2)

    return df


suffix_map = {f'{value}': index for index, value in enumerate(samples)}
meta_list = list()
keep_col = ['barcode', 'total_cpg_number', 'genome_cov', 'reads_counts', 'CpG%', 'CH%']

for i in samples:

    s_cells_meta = pd.read_csv(os.path.join(f'{i}', f'{i}_methy', 'step3', 'split_bams','merged', f'{i}_cells.csv'), header = 0)
    s_cells_meta['barcode'] = [b.replace('_allc.gz','') for b in s_cells_meta['cell_barcode']]
    s_reads_counts = pd.read_csv(os.path.join(f'{i}', f'{i}_methy', 'step3', 'split_bams','merged', 'filtered_barcode_reads_counts.csv'), header = 0)
    s_merged_df = s_cells_meta.merge(s_reads_counts, how = 'inner', left_on = 'barcode', right_on = 'barcode')
    s_merged_df = compute_cg_ch_level(s_merged_df)
    s_merged_df = s_merged_df[keep_col]
    if len(samples) > 1:
        s_merged_df['barcode'] = [f'{b}-{suffix_map[i]}'for b in s_merged_df['barcode']]
    meta_list.append(s_merged_df)
adata_met.obs = adata_met.obs.merge(
    pd.concat(meta_list).set_index('barcode'),
    how = 'left',
    left_index=True,
right_index = True)ch_cov_col = [i for i in df.columns[df.columns.str.contains('^(CT|CC|CA)')].to_list() if i.endswith('_cov')]
/tmp/ipykernel_143/2478518388.py:6: UserWarning: This pattern is interpreted as a regular expression, and has match groups. To actually get the groups, use str.extract.
ch_mc_col = [i for i in df.columns[df.columns.str.contains('^(CT|CC|CA)')].to_list() if i.endswith('_mc')]
/tmp/ipykernel_143/2478518388.py:5: UserWarning: This pattern is interpreted as a regular expression, and has match groups. To actually get the groups, use str.extract.
ch_cov_col = [i for i in df.columns[df.columns.str.contains('^(CT|CC|CA)')].to_list() if i.endswith('_cov')]
/tmp/ipykernel_143/2478518388.py:6: UserWarning: This pattern is interpreted as a regular expression, and has match groups. To actually get the groups, use str.extract.
ch_mc_col = [i for i in df.columns[df.columns.str.contains('^(CT|CC|CA)')].to_list() if i.endswith('_mc')]
plt.rcParams['figure.dpi'] = 150
plt.rcParams['figure.figsize'] = (3,3)
sc.pl.umap(adata_met, color = ['total_cpg_number','reads_counts','genome_cov'], cmap = 'inferno')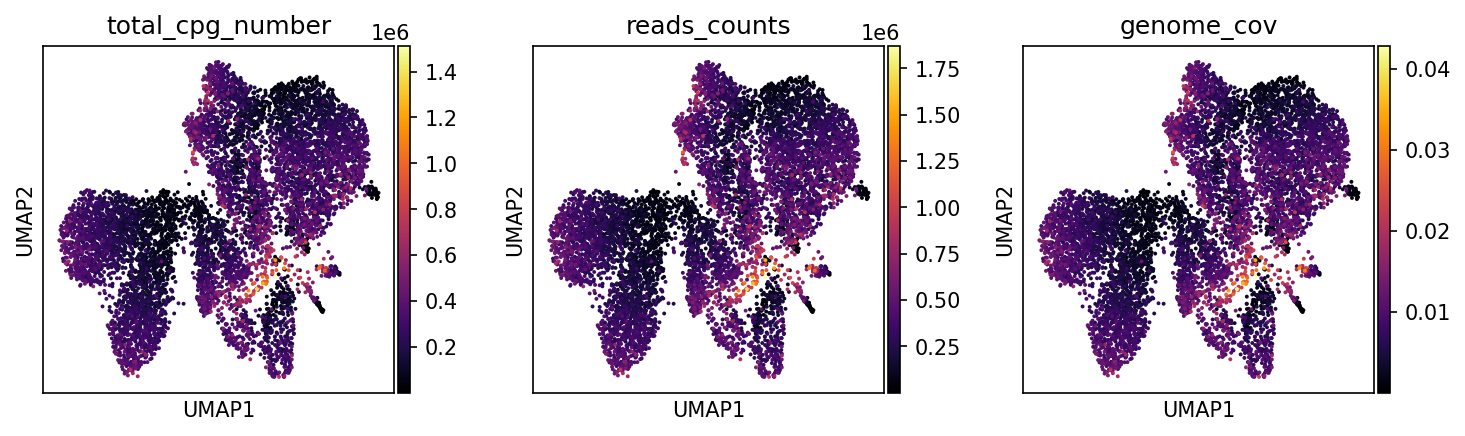
plt.rcParams['figure.dpi'] = 150
plt.rcParams['figure.figsize'] = (3,3)
sc.pl.umap(adata_met, color = ['CpG%','CH%'], cmap = 'inferno')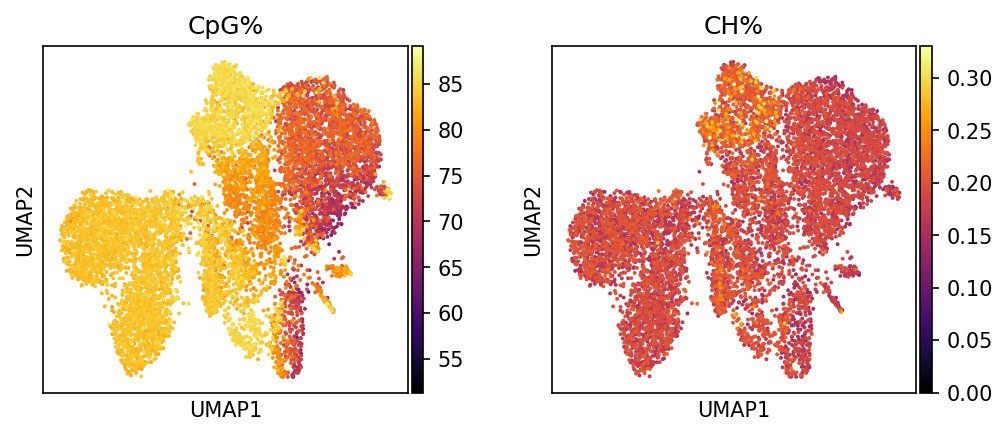
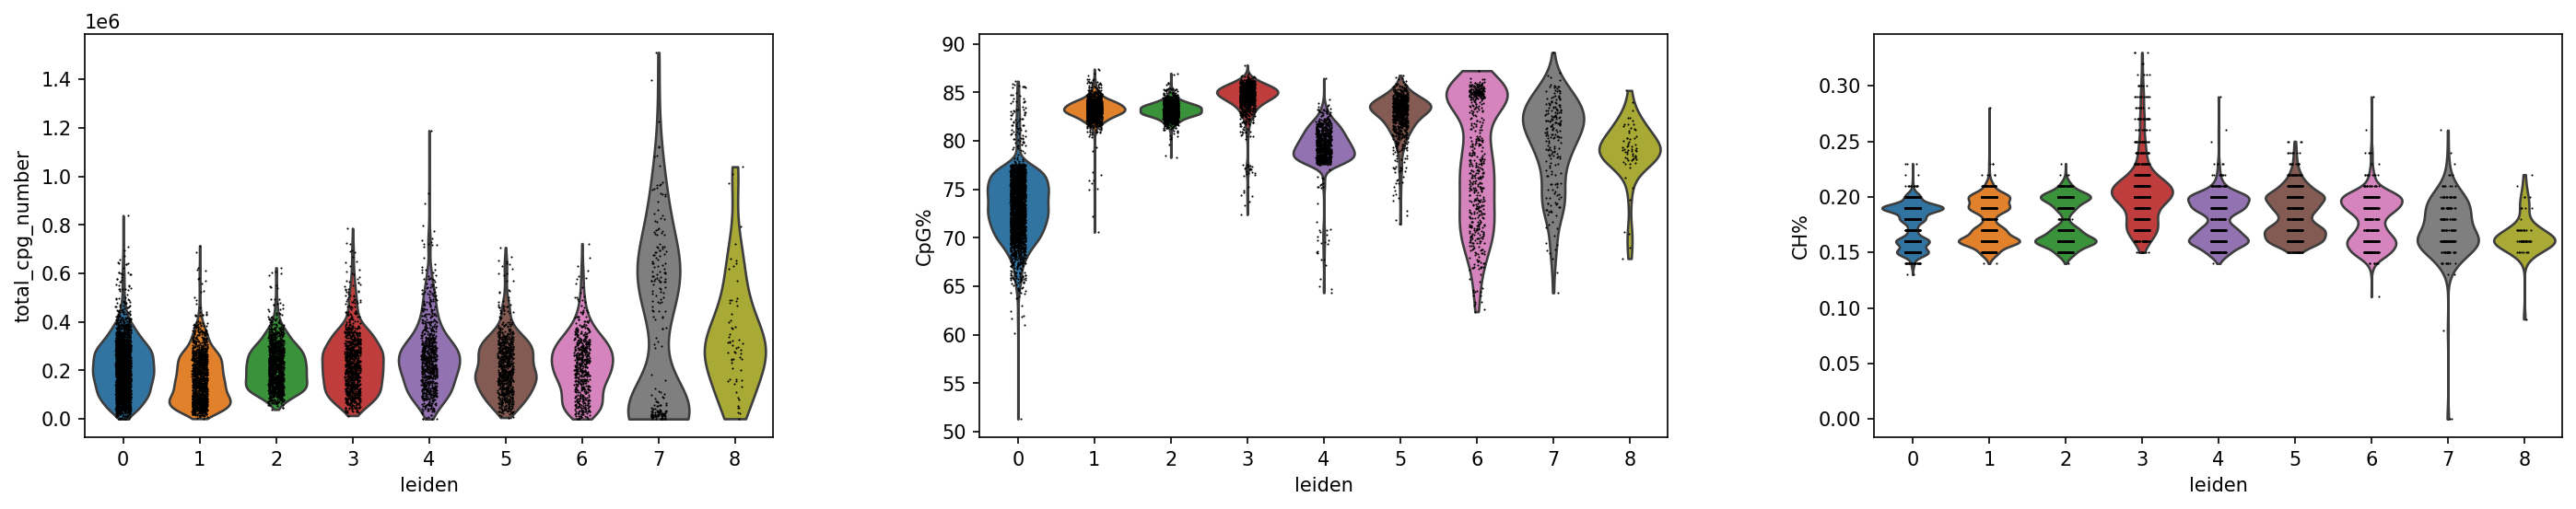
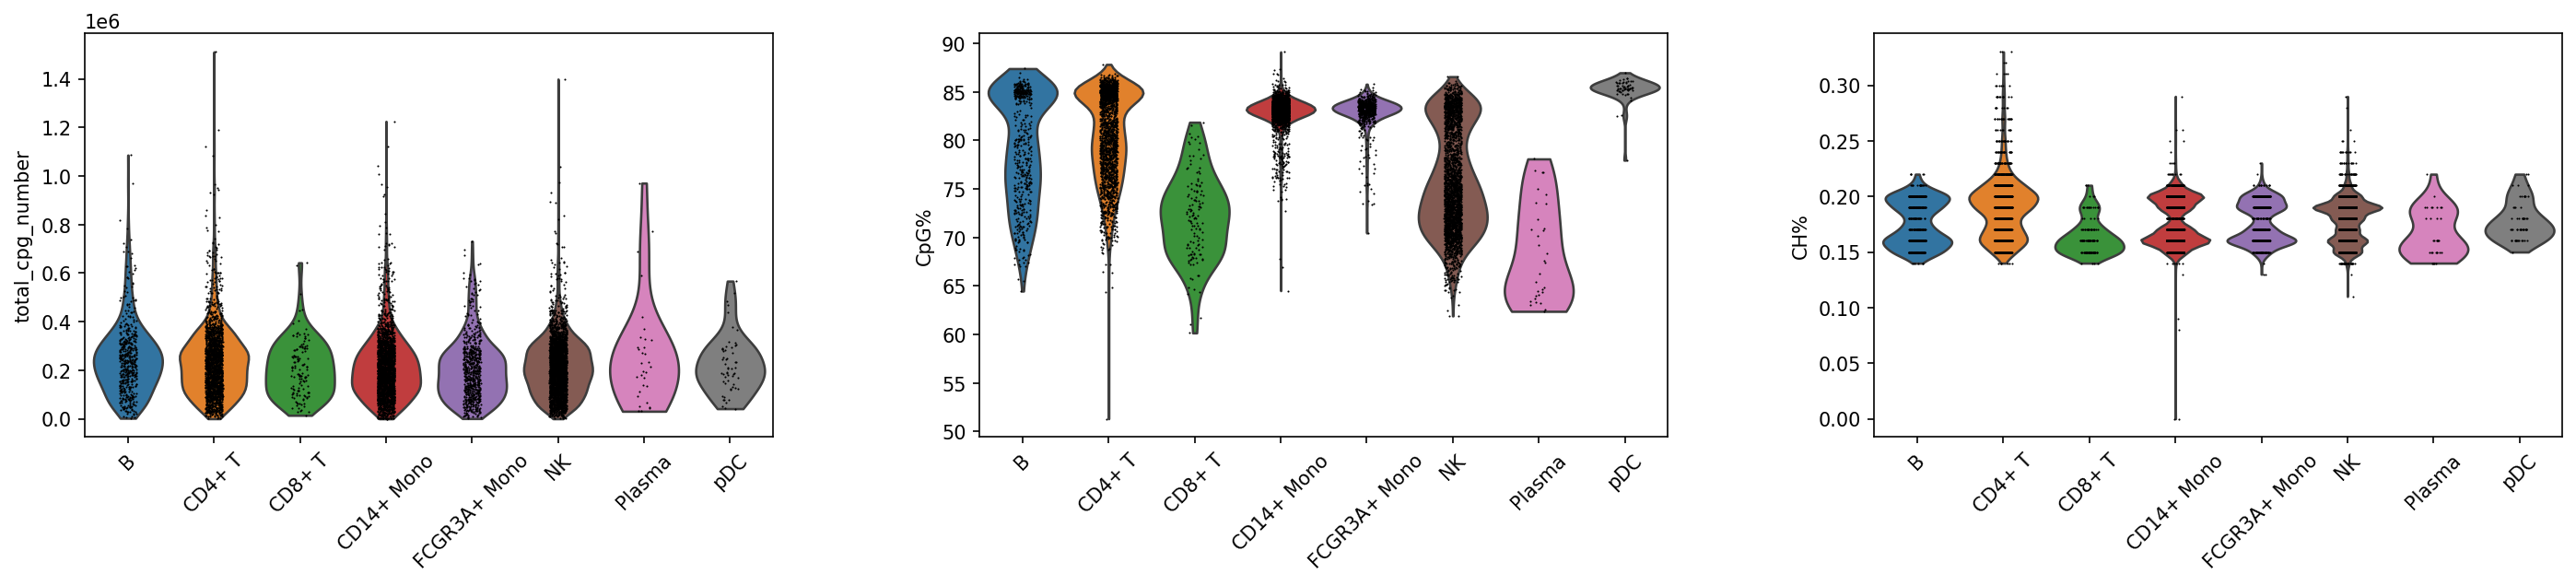
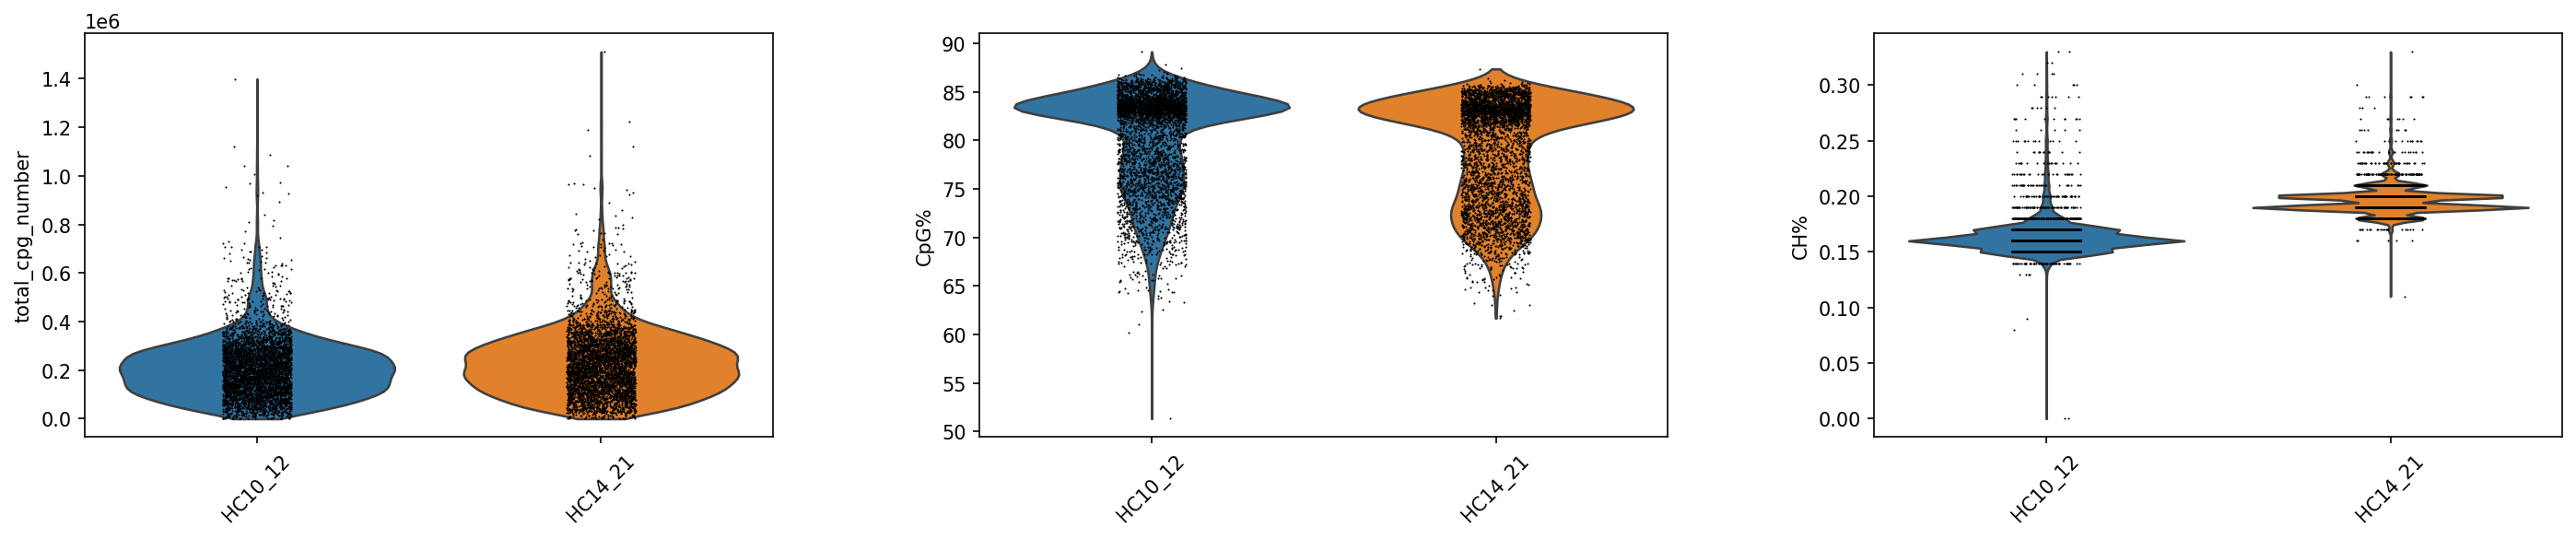
质控指标分布分析:小提琴图可视化
可视化目的
通过小提琴图(Violin Plot)直观展示不同细胞分组中关键质控指标的分布特征,评估数据质量均匀性,识别潜在的批次效应或技术偏差,确保后续生物学发现的可靠性。
CpG 位点数量分布
- 理想模式:各簇间分布相似,中位数接近
- 异常预警:特定簇位点数量显著偏低
- 生物学意义:反映细胞捕获效率和 DNA 质量
CpG 甲基化率分布
- 预期范围:通常在哺乳细胞中维持相对稳定的基线水平
- 簇间差异:不同细胞类型可能表现出特征性的甲基化水平
- 质控标准:异常低/高值可能指示技术问题
CH 甲基化率分布
- 基线特征:通常远低于 CpG 甲基化率
- 生物学特异:神经元、胚胎干细胞等特定类型中可能升高
- 技术鉴别:需区分真实生物学特征与技术偏差
plt.rcParams['figure.figsize'] = (6,4)
sc.pl.violin(adata_met, keys=['total_cpg_number', 'CpG%', 'CH%'], groupby='leiden')
#_ = sc.pl.violin(adata_met, keys=['total_cpg_number', 'CpG%', 'CH%'], groupby='leiden', save = '_leiden_cpg_ch.png', show = False)Passing \`palette\` without assigning \`hue\` is deprecated and will be removed in v0.14.0. Assign the \`x\` variable to \`hue\` and set \`legend=False\` for the same effect.
ax = sns.violinplot(
/PROJ2/FLOAT/jinwen/apps/miniconda3/envs/allcools/lib/python3.8/site-packages/scanpy/plotting/_anndata.py:839: FutureWarning:
The \`scale\` parameter has been renamed and will be removed in v0.15.0. Pass \`density_norm='width'\` for the same effect.
ax = sns.violinplot(
/PROJ2/FLOAT/jinwen/apps/miniconda3/envs/allcools/lib/python3.8/site-packages/scanpy/plotting/_anndata.py:839: FutureWarning:
Passing \`palette\` without assigning \`hue\` is deprecated and will be removed in v0.14.0. Assign the \`x\` variable to \`hue\` and set \`legend=False\` for the same effect.
ax = sns.violinplot(
/PROJ2/FLOAT/jinwen/apps/miniconda3/envs/allcools/lib/python3.8/site-packages/scanpy/plotting/_anndata.py:839: FutureWarning:
The \`scale\` parameter has been renamed and will be removed in v0.15.0. Pass \`density_norm='width'\` for the same effect.
ax = sns.violinplot(
plt.rcParams['figure.figsize'] = (6,4)
sc.pl.violin(adata_met, keys=['total_cpg_number', 'CpG%', 'CH%'], groupby="celltype",rotation = 45)
#_ = sc.pl.violin(adata_met, keys=['total_cpg_number', 'CpG%', 'CH%'], groupby=anno_col, save = f'_{anno_col}_cpg_ch.png', rotation = 45,show = False)Passing \`palette\` without assigning \`hue\` is deprecated and will be removed in v0.14.0. Assign the \`x\` variable to \`hue\` and set \`legend=False\` for the same effect.
ax = sns.violinplot(
/PROJ2/FLOAT/jinwen/apps/miniconda3/envs/allcools/lib/python3.8/site-packages/scanpy/plotting/_anndata.py:839: FutureWarning:
The \`scale\` parameter has been renamed and will be removed in v0.15.0. Pass \`density_norm='width'\` for the same effect.
ax = sns.violinplot(
/PROJ2/FLOAT/jinwen/apps/miniconda3/envs/allcools/lib/python3.8/site-packages/scanpy/plotting/_anndata.py:839: FutureWarning:
Passing \`palette\` without assigning \`hue\` is deprecated and will be removed in v0.14.0. Assign the \`x\` variable to \`hue\` and set \`legend=False\` for the same effect.
ax = sns.violinplot(
/PROJ2/FLOAT/jinwen/apps/miniconda3/envs/allcools/lib/python3.8/site-packages/scanpy/plotting/_anndata.py:839: FutureWarning:
The \`scale\` parameter has been renamed and will be removed in v0.15.0. Pass \`density_norm='width'\` for the same effect.
ax = sns.violinplot(
/PROJ2/FLOAT/jinwen/apps/miniconda3/envs/allcools/lib/python3.8/site-packages/scanpy/plotting/_anndata.py:839: FutureWarning:
Passing \`palette\` without assigning \`hue\` is deprecated and will be removed in v0.14.0. Assign the \`x\` variable to \`hue\` and set \`legend=False\` for the same effect.
ax = sns.violinplot(
/PROJ2/FLOAT/jinwen/apps/miniconda3/envs/allcools/lib/python3.8/site-packages/scanpy/plotting/_anndata.py:839: FutureWarning:
The \`scale\` parameter has been renamed and will be removed in v0.15.0. Pass \`density_norm='width'\` for the same effect.
ax = sns.violinplot(
plt.rcParams['figure.figsize'] = (6,4)
sc.pl.violin(adata_met, keys=['total_cpg_number', 'CpG%', 'CH%'], groupby="Sample",rotation = 45)
#_ = sc.pl.violin(adata_met, keys=['total_cpg_number', 'CpG%', 'CH%'], groupby=sample_col, save = f'_{sample_col}_cpg_ch.png',rotation = 45, show = False)Passing \`palette\` without assigning \`hue\` is deprecated and will be removed in v0.14.0. Assign the \`x\` variable to \`hue\` and set \`legend=False\` for the same effect.
ax = sns.violinplot(
/PROJ2/FLOAT/jinwen/apps/miniconda3/envs/allcools/lib/python3.8/site-packages/scanpy/plotting/_anndata.py:839: FutureWarning:
The \`scale\` parameter has been renamed and will be removed in v0.15.0. Pass \`density_norm='width'\` for the same effect.
ax = sns.violinplot(
/PROJ2/FLOAT/jinwen/apps/miniconda3/envs/allcools/lib/python3.8/site-packages/scanpy/plotting/_anndata.py:839: FutureWarning:
Passing \`palette\` without assigning \`hue\` is deprecated and will be removed in v0.14.0. Assign the \`x\` variable to \`hue\` and set \`legend=False\` for the same effect.
ax = sns.violinplot(
/PROJ2/FLOAT/jinwen/apps/miniconda3/envs/allcools/lib/python3.8/site-packages/scanpy/plotting/_anndata.py:839: FutureWarning:
The \`scale\` parameter has been renamed and will be removed in v0.15.0. Pass \`density_norm='width'\` for the same effect.
ax = sns.violinplot(
/PROJ2/FLOAT/jinwen/apps/miniconda3/envs/allcools/lib/python3.8/site-packages/scanpy/plotting/_anndata.py:839: FutureWarning:
Passing \`palette\` without assigning \`hue\` is deprecated and will be removed in v0.14.0. Assign the \`x\` variable to \`hue\` and set \`legend=False\` for the same effect.
ax = sns.violinplot(
/PROJ2/FLOAT/jinwen/apps/miniconda3/envs/allcools/lib/python3.8/site-packages/scanpy/plotting/_anndata.py:839: FutureWarning:
The \`scale\` parameter has been renamed and will be removed in v0.15.0. Pass \`density_norm='width'\` for the same effect.
ax = sns.violinplot(
adata_met.write_h5ad('adata_met.h5ad')