ATAC + RNA multi-omics epiAneuFinder CNV detection from scATAC
Document Overview
epiAneuFinder is an algorithm for detecting copy number variation (CNV) from single-cell ATAC (scATAC) data[^1]. Single-cell multi-omics data contains scATAC-seq information, and epiAneuFinder can be used to perform CNV analysis on scATAC-seq in multi-omics data to reveal tumor cell heterogeneity.
Significance of CNV Analysis
What is CNV
Copy Number Variation (CNV) refers to structural variations in the quantity of large DNA fragments in the genome, primarily manifested as amplification (gain) or deletion (loss) of chromosomal regions. Under normal conditions, human cells are diploid (each autosome typically has 2 copies); when amplification occurs, the copy number exceeds 2, and when deletion occurs, the copy number is below 2.
CNV is an important driver of the occurrence and progression of various diseases such as cancer. Traditional CNV analysis is primarily based on whole-genome sequencing (WGS) or whole-exome sequencing (WES), which can only provide population-average information. Single-cell CNV analysis infers the copy number state of each cell at single-cell resolution, enabling the revelation of genomic differences and heterogeneity among different cells within tissues.
Two Directions of Single-cell Multi-omics CNV Analysis
Single-cell multi-omics data for CNV analysis mainly has two directions:
- Direction 1: Based on scRNA-seq data - Uses gene expression information to infer CNV, with infercnv as the main tool
- Direction 2: Based on scATAC-seq data - Uses Read Count information to infer CNV, with main tools including epiAneuFinder, AtaCNV, and CopyscAT
TIP
Introduction to Mainstream Single-cell ATAC-seq CNV Analysis Tools
Currently, commonly used tools for CNV detection in scATAC-seq data include: epiAneuFinder, CopyscAT, and AtaCNV. This guide focuses on the detailed usage of epiAneuFinder. For other tools, please refer to the official documentation for AtaCNV and CopyscAT for more information.
Applicable Scenarios and Main Objectives
Suitable sample types:
- Tumor tissue samples (strongly recommended) - Contain numerous CNV events, can reveal tumor heterogeneity and subclonal structure
- Precancerous lesions or developmental abnormality samples - Can detect early genomic structural variations
Unsuitable sample types:
- Normal healthy tissues - Most cells are diploid, lack significant CNV events, CNV analysis has limited significance
Main objectives of single-cell CNV analysis:
- Malignant cell identification - Distinguish malignant cells from non-malignant cells (malignant cells typically exhibit large-scale, non-random CNV patterns)
- Tumor heterogeneity resolution - Identify subclonal populations with different CNV characteristics
- Clonal evolution tracking - Infer tumor clonal evolution relationships through CNV pattern similarity
Implementation of epiAneuFinder Analysis
Principles of epiAneuFinder Tool
epiAneuFinder uses the number of reads mapped to genomic regions in scATAC-seq data as a proxy indicator of DNA copy number in that region. To overcome the inherent coverage sparsity of single-cell sequencing, the system employs the following strategies:
- Data filtering: Filters low-coverage cells to ensure subsequent analysis is based on high-quality single-cell data
- Genomic window partitioning: Divides the genome into equal-length windows (default window size is 100,000 base pairs) and quantifies the number of mapped reads in each window
- Blacklist region removal: Removes ENCODE blacklist regions—genomic sites containing telomeric ends, repetitive regions, etc., with systematic mapping biases—to avoid interfering with copy number inference
- Low-coverage window filtering: For each dataset, epiAneuFinder also removes windows with excessive zero-count proportions across all cells to exclude genomic regions that are generally poorly mappable in specific datasets
The overall detection workflow of epiAneuFinder using single-cell ATAC-seq data includes the following key steps:
- Raw data input: Input quality-controlled scATAC-seq Fragment files or processed Count matrices
- Window Count Matrix generation: Divides the genome into equal-length windows and calculates Read Counts for each cell in each window
- Data quality control: Filters low-quality cells and low-coverage windows, removes Blacklist Regions
- CNV inference and visualization: Analyzes Read Counts in each window through statistical models to infer copy number variation in each cell and generate visualization results
By using different cancer scATAC-seq datasets, epiAneuFinder can identify intratumoral clonal heterogeneity in cell populations based on single-cell CNA profiles. Studies have proven that these CNA profiles are consistent with results inferred from single-cell whole-genome sequencing data of the same samples. epiAneuFinder allows inference of single-cell CNA information from scATAC-seq data without additional experiments, thereby unlocking genomic variation dimensions that would otherwise be unexplorable.
The following figure illustrates the main epiAneuFinder analysis workflow:
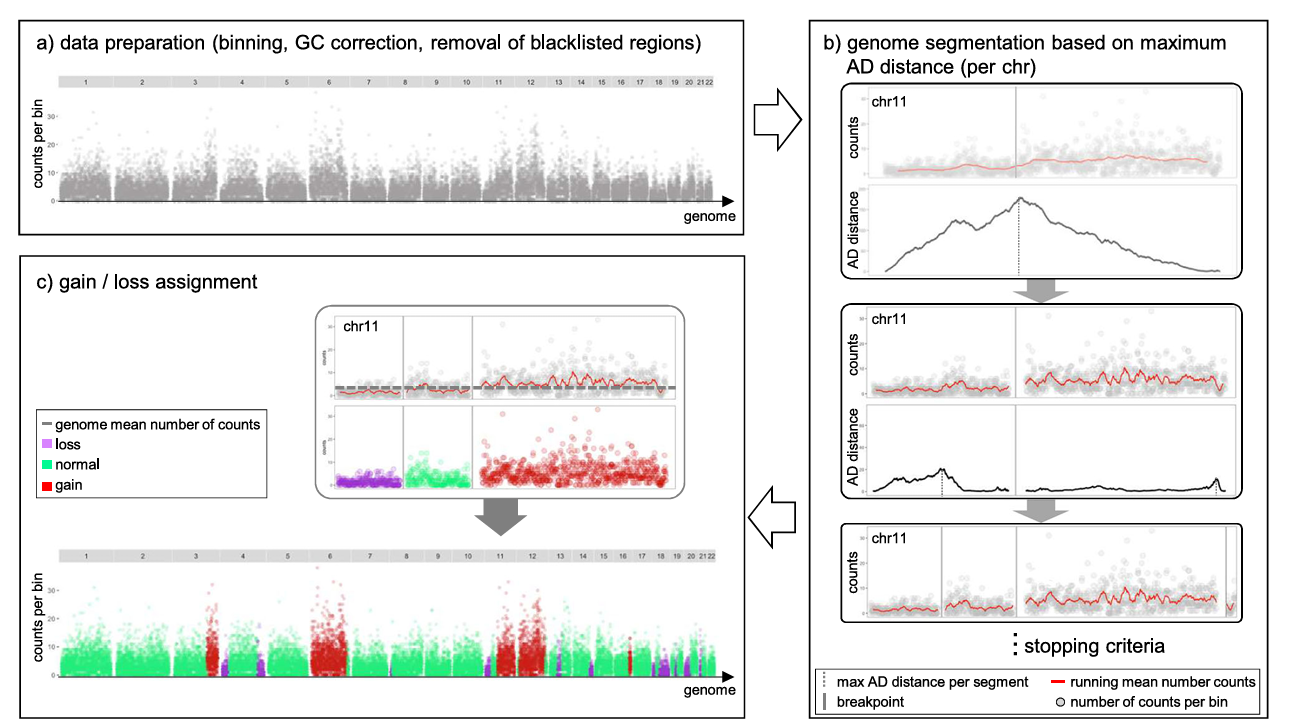
Implementation of epiAneuFinder Analysis
epiAneuFinder can implement CNV analysis through the following steps. This approach can precisely quantify the copy number state of each cell across the entire genome, which is a key step in identifying malignant cells and resolving tumor heterogeneity. When implementing actual projects, it is recommended to adjust parameters such as window size based on data characteristics to obtain the most accurate CNV detection results.
#!/usr/bin/env Rscript

args = commandArgs(trailingOnly=TRUE)

print("Running script for epiAneufinder")

library(epiAneufinder)

# If the genome version used is not BSgenome.Hsapiens.UCSC.hg38, please uncomment the following line and fill in the corresponding R package
# library(BSgenome.XXX.YYY)

# Input data path, can be a fragment tsv file or a directory containing multiple BAM files
input <- "Please fill in the directory or fragment tsv filename of input data here"

# Output directory, will be created automatically if it does not exist
outdir <- "epiAneufinder_results"

# Need to have the corresponding BSgenome genome information package installed in R, this example uses UCSC hg38 genome
genome <- "BSgenome.Hsapiens.UCSC.hg38"

# Chromosome names to exclude, must be consistent with genome naming
exclude <- c('chrX','chrY','chrM')

# Blacklist bed file path, users need to download according to the genome used
blacklist <- "Please fill in the path filename of blacklist.bed here"

# Genomic window size, default 1e5 (100kb)
windowSize <- 1e5

# Whether to reuse previous analysis results, default TRUE (may error after some parameter changes, set as appropriate)
reuse.existing=TRUE

# Upper and lower quantile thresholds
uq=0.9
lq=0.1

# Karyotype plot title
title_karyo="Karyoplot"

# Number of CPU cores for analysis
ncores=4

# Minimum number of single-cell fragments (only valid for Fragment files)
minFrags = 20000

# Filter if a bin has zero counts in cells above the set proportion. 0 means filtering is disabled
threshold_blacklist_bins=0.85

# Number of breakpoints for CNV inference, 1 means all breakpoints. Greater than 1 can speed up analysis but reduce resolution
minsize=1

# Number of segments per chromosome (2 to the power of k)
k=4

# Minimum number of consecutive bins constituting CNV
minsizeCNV=0

dir.create(outdir, showWarnings=FALSE)

epiAneufinder::epiAneufinder(
  input = input,
  outdir = outdir,
  blacklist = blacklist,
  windowSize = windowSize,
  genome = genome,
  exclude = exclude,
  reuse.existing = reuse.existing,
  uq = uq, lq = lq,
  title_karyo = title_karyo,
  ncores = ncores,
  minFrags = minFrags,
  minsize = minsize,
  k = k,
  threshold_blacklist_bins = threshold_blacklist_bins,
  minsizeCNV = minsizeCNV
)
TIP
Parameter Adjustment Recommendations
epiAneuFinder provides multiple adjustable parameters to adapt to different data characteristics:
- Window size (window_size): Default 100kb, can be appropriately reduced for data with higher sequencing depth (e.g., 50kb), and can be appropriately increased for data with lower sequencing depth (e.g., 200kb)
- Blacklist regions: Strongly recommend using ENCODE blacklist region files to exclude genomic sites with systematic mapping biases
- Filtering thresholds: The
min_cellsandmin_windowsparameters need to be adjusted based on data characteristics; overly strict filtering may lose useful information, while overly lenient filtering may introduce noise - CNV inference method: HMM (Hidden Markov Model) method is generally suitable for most cases, changepoint method may provide better results in some cases
It is recommended to run with default parameters first, then make appropriate adjustments based on result quality.
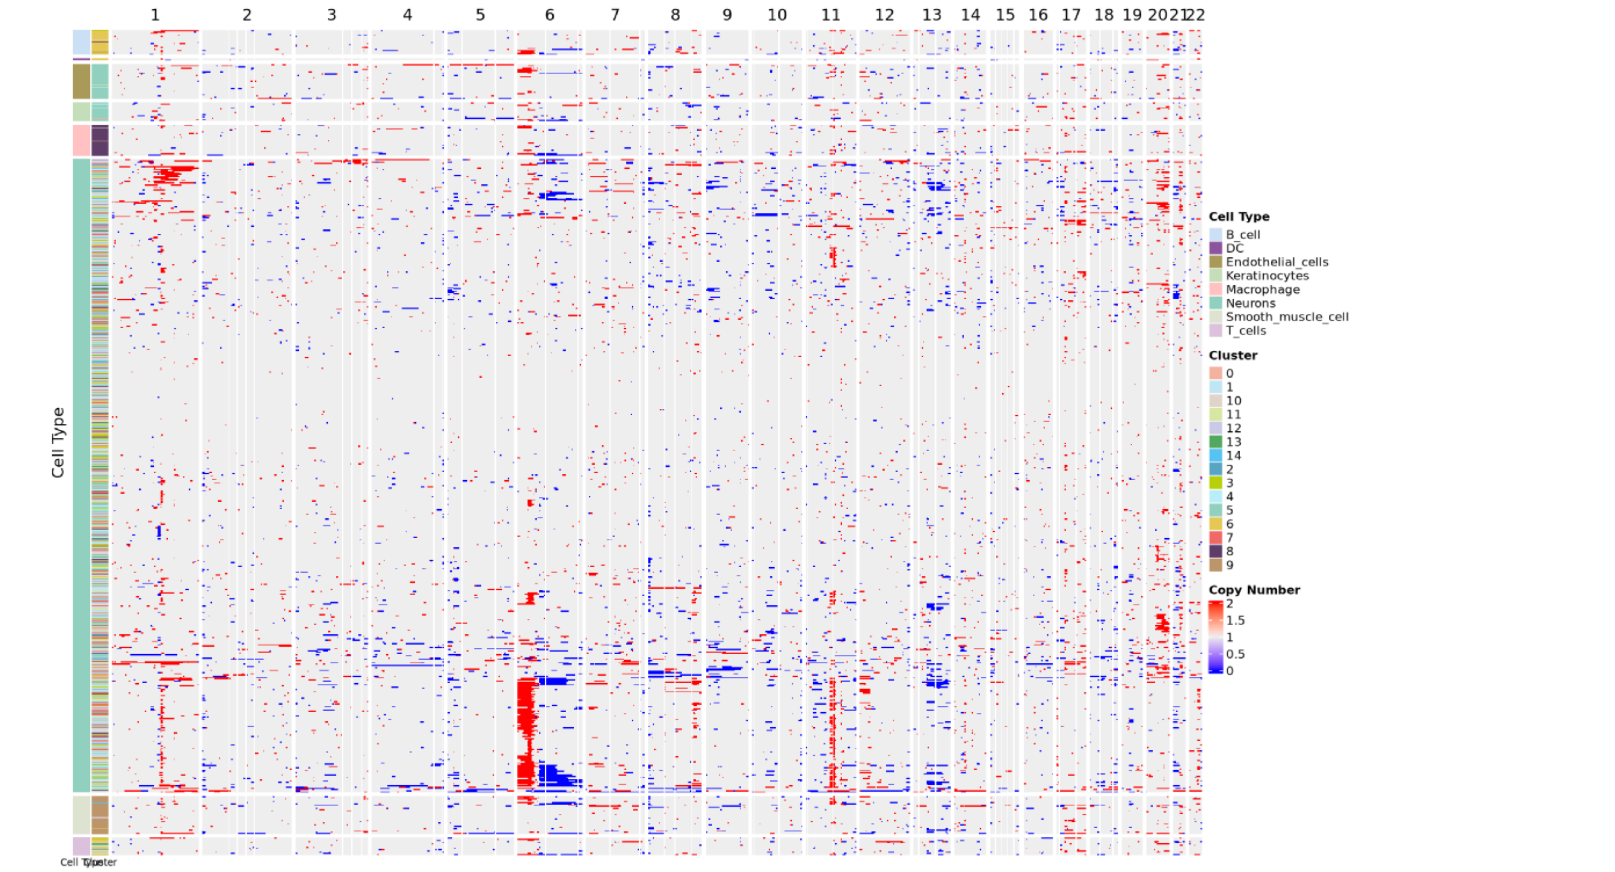
CNV Results Display--Copy Number Variation Heatmap
The copy number variation heatmap is the core visualization result of CNV analysis, comprehensively displaying the copy number state of all cells across the entire genome:
Meaning of rows and columns:
- Each row represents a cell
- Each column represents a chromosome arm, and the color of the heatmap represents CNV scores
- The order of columns corresponds to the linear arrangement of the genome from chromosome 1 to sex chromosomes (if retained)
Color mapping:
- Copy number values around 2 indicate normal diploid state
- Copy number between 1~2 indicates chromatin deletion, closer to 1 indicates more severe deletion
- Copy number between 2~3 indicates chromatin amplification, closer to 3 indicates more severe amplification
- Redder colors indicate more severe amplification, bluer colors indicate more severe deletion
Cell annotation:
- The color bars on the left side of the heatmap represent arranging cells according to cell type and cell clustering
- The heatmap usually adds cell type annotations or cluster information on the row side to facilitate distinguishing malignant and non-malignant cell groups
- Malignant cells typically exhibit obvious CNV patterns (large-scale amplification or deletion), while non-malignant cells (such as T cells, B cells) maintain relatively normal diploid state
Frequently Asked Questions
Q1: How to select an appropriate window size?
A: Window size selection needs to balance resolution and statistical power:
- Smaller windows (50kb): Provide higher resolution but require higher sequencing depth, noise may be larger
- Default window (100kb): Suitable for most cases, balances resolution and statistical power
- Larger windows (200kb or larger): Suitable for data with lower sequencing depth but will reduce resolution
- Recommendation: Can first run with default window size, and if too many or too few CNV events are detected, adjust window size based on data characteristics
Q2: How to interpret the values in copy number results?
A: In copy number inference results:
- Close to 2: Indicates normal copy number (diploid state), meaning the region maintains normal copy number in the corresponding cell
- Between 1 ~ 2: Indicates copy number deletion (loss), the copy number of this region in the corresponding cell is below normal levels, closer to 1 indicates more severe deletion
- Between 2 ~ 3: Indicates copy number amplification (gain), the copy number of this region in the corresponding cell is above normal levels, closer to 3 indicates more severe amplification
- These values reflect the copy number state of each cell in each genomic window and can be used to identify malignant cells and subclonal structure
Q5: What are the advantages of epiAneuFinder compared to other CNV detection tools?
A: The main advantages of epiAneuFinder include:
- Designed specifically for scATAC-seq: Fully utilizes the characteristics of scATAC-seq data, directly infers CNV from chromatin accessibility data
- No additional experiments required: Can detect CNV using only scATAC-seq data without additional sequencing experiments
- Validated consistency: Studies have proven that its CNV detection results are consistent with results inferred from single-cell whole-genome sequencing data
- Flexible parameters: Provides multiple adjustable parameters that can be optimized based on data characteristics
References
[1] SCHEP A N, et al. epiAneufinder: Detecting copy number alterations in single-cell ATAC-seq data[J]. Nature Methods, 2021, 18(12): 1473-1481.