CellChat
Preface
IMPORTANT
This document is based on CellChat cell communication analysis materials, including method principles, SeekSoulOnline platform parameter descriptions, result interpretation, and case demonstrations. Please combine with original data quality control and biological validation when using.
This document references the official CellChat documentation and is written in combination with SeekSoulOnline operation workflows and result reports.
1 Principle Overview
1.1 Basic Concept of CellChat
CellChat is an R package based on prior ligand-receptor databases combined with gene expression data for inferring cell-cell communication networks. Its core includes:
- Using manually curated CellChatDB (supporting human/mouse) as prior knowledge for ligands, receptors, multi-subunit complexes, and cofactors;
- Estimating signal flux and interaction strength based on gene expression, and computationally considering multi-subunit structures and cofactors;
- Using systematic network analysis (such as social network analysis, pattern recognition, flow metrics, etc.) to quantify communication strength, roles, and pathway similarities.
1.2 Key Points of Computational Model
- Expression Aggregation: For multi-subunit ligands/receptors, CellChat uses appropriate aggregation functions to estimate overall complex activity;
- Kinetic Modeling (Michaelis-Menten Equation): When evaluating receptor-ligand interaction strength, considers the nonlinear relationship between expression and binding kinetics;
- Statistical Significance Assessment: Evaluates the significance of each L-R pair through permutation tests or other randomization methods;
- Signal Pathway Summary: Maps multiple L-R pairs to biological signal pathways, providing pathway-level comparative analysis and visualization.
1.3 Advantages and Limitations of CellChat Compared to Other Tools
- Advantages: Detailed multi-subunit annotation, rich visualization forms (circle, chord, sankey, heatmap, bubble, etc.), support for human/mouse databases, extended support for non-protein-mediated interactions (v2).
- Limitations: Dependent on prior library coverage; cannot directly provide causal validation; sensitive to low expression/rare cell types.
2 SeekSoulOnline Platform (CellChat Module) Parameter Description and Operation Guide
NOTE
The following are platform parameter examples.

2.2 Main Parameter Description
- Task Name: Starts with a letter, supports underscores, example:
cellchat_analysis_2025. - Species:
HumanorMouse, affects the selection of CellChatDB. - Grouping.by: Cell annotation column name, such as
celltypeorCellAnnotation. - Method: Calculation method, optional values are triMean or truncatedMean. The former yields fewer but stronger interactions, while the latter yields more interactions.
- Ratio: Only used when the analysis method is truncatedMean. When the expression proportion is below a certain percentage, the gene expression mean is considered 0. Single-cell transcriptomics defaults to 0.25, spatial data is recommended to be set smaller, such as 0.1. If focusing on rare cells, the expression threshold can be appropriately lowered.
- Cell Count Effect: Whether to consider the impact of cell numbers within cell groups. Sorted cell groups are set to "No", unsorted cell groups are set to "Yes", spatial data is uniformly set to "No".
2.4 Submission and Result Retrieval
- After clicking submit, please check progress in the task list; analysis time depends on cell number and comparison group number;
- After completion, you can download images (PNG), tables (TSV/XLS), and interactive HTML reports.
3 Report Result Interpretation
NOTE
Results must be combined with biological background and expression validation. CellChat provides prediction results based on statistics and prior knowledge, not direct experimental validation.
3.1 Core Result File Description
*_cellchat_netp_lr.xls: Ligand-receptor pair communication data based on signal pathways;*_cellchat_net_lr.xls: Communication data based on ligand-receptor pairs;- Various images:
netVisual_circle.png,bubble.png,heatmap.png,chord.png,sankey.png, etc.
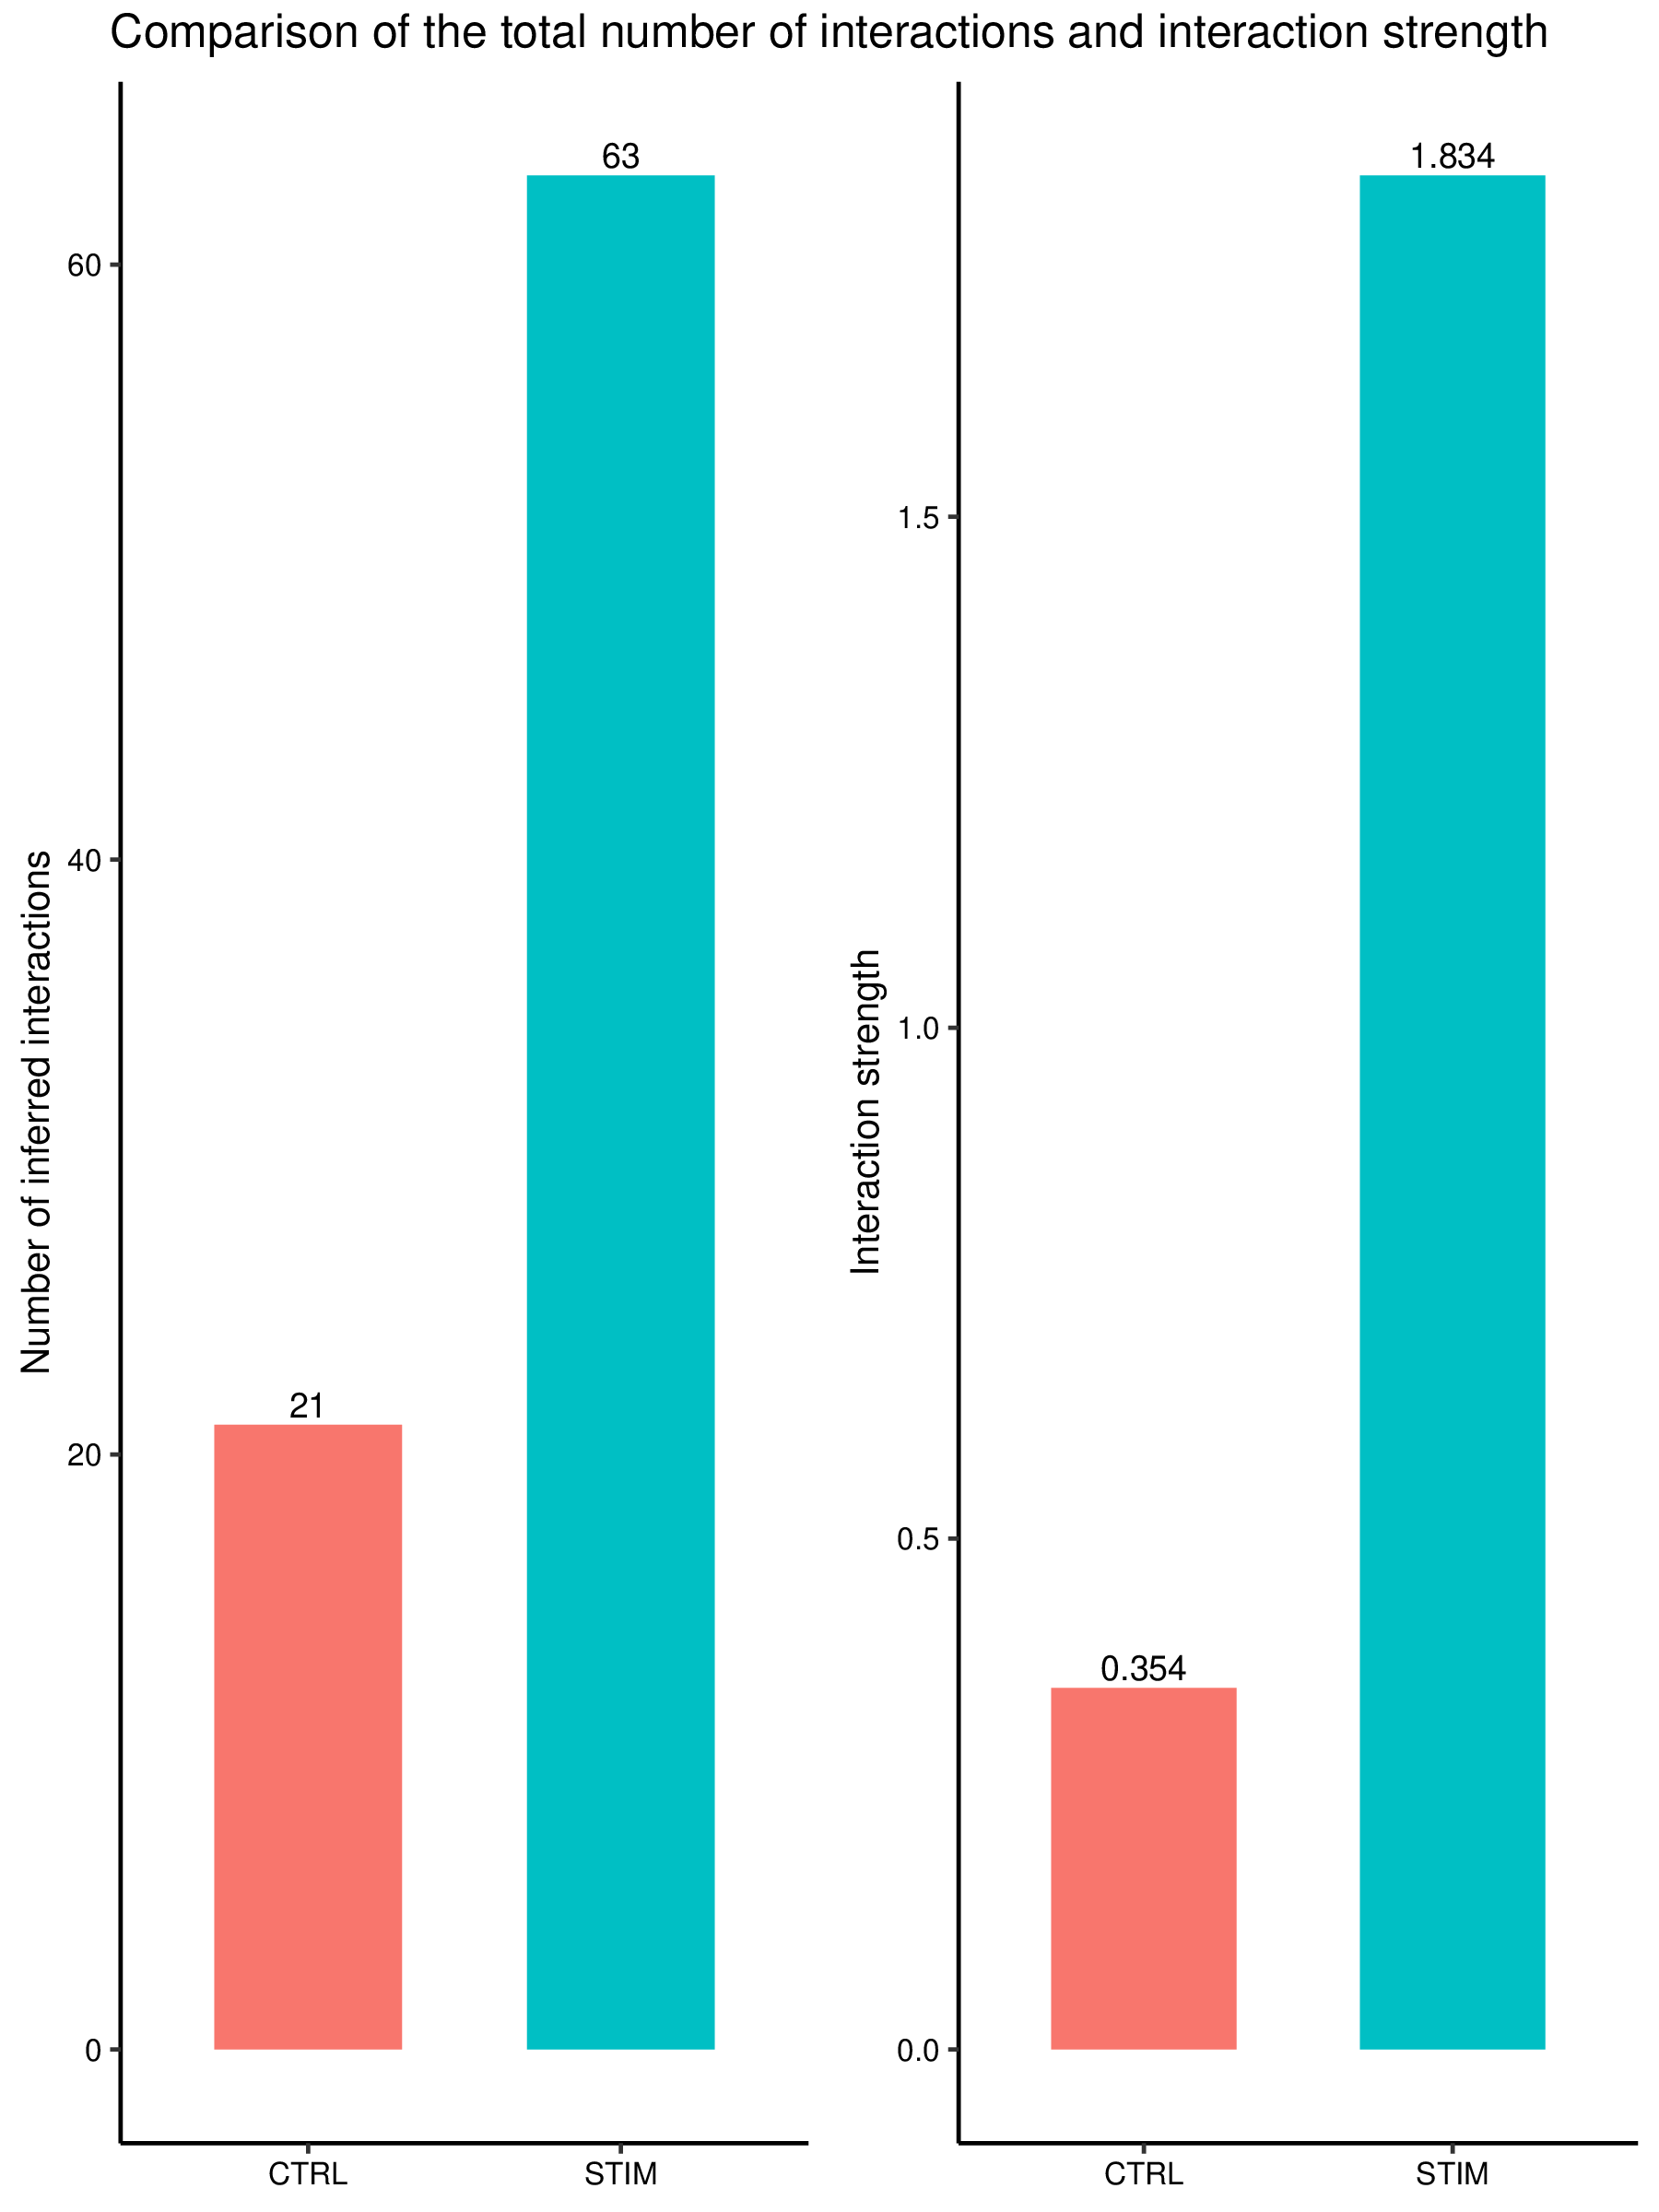
Figure: Comparison of total L-R pairs number and communication strength across different groups/samples (example figure).
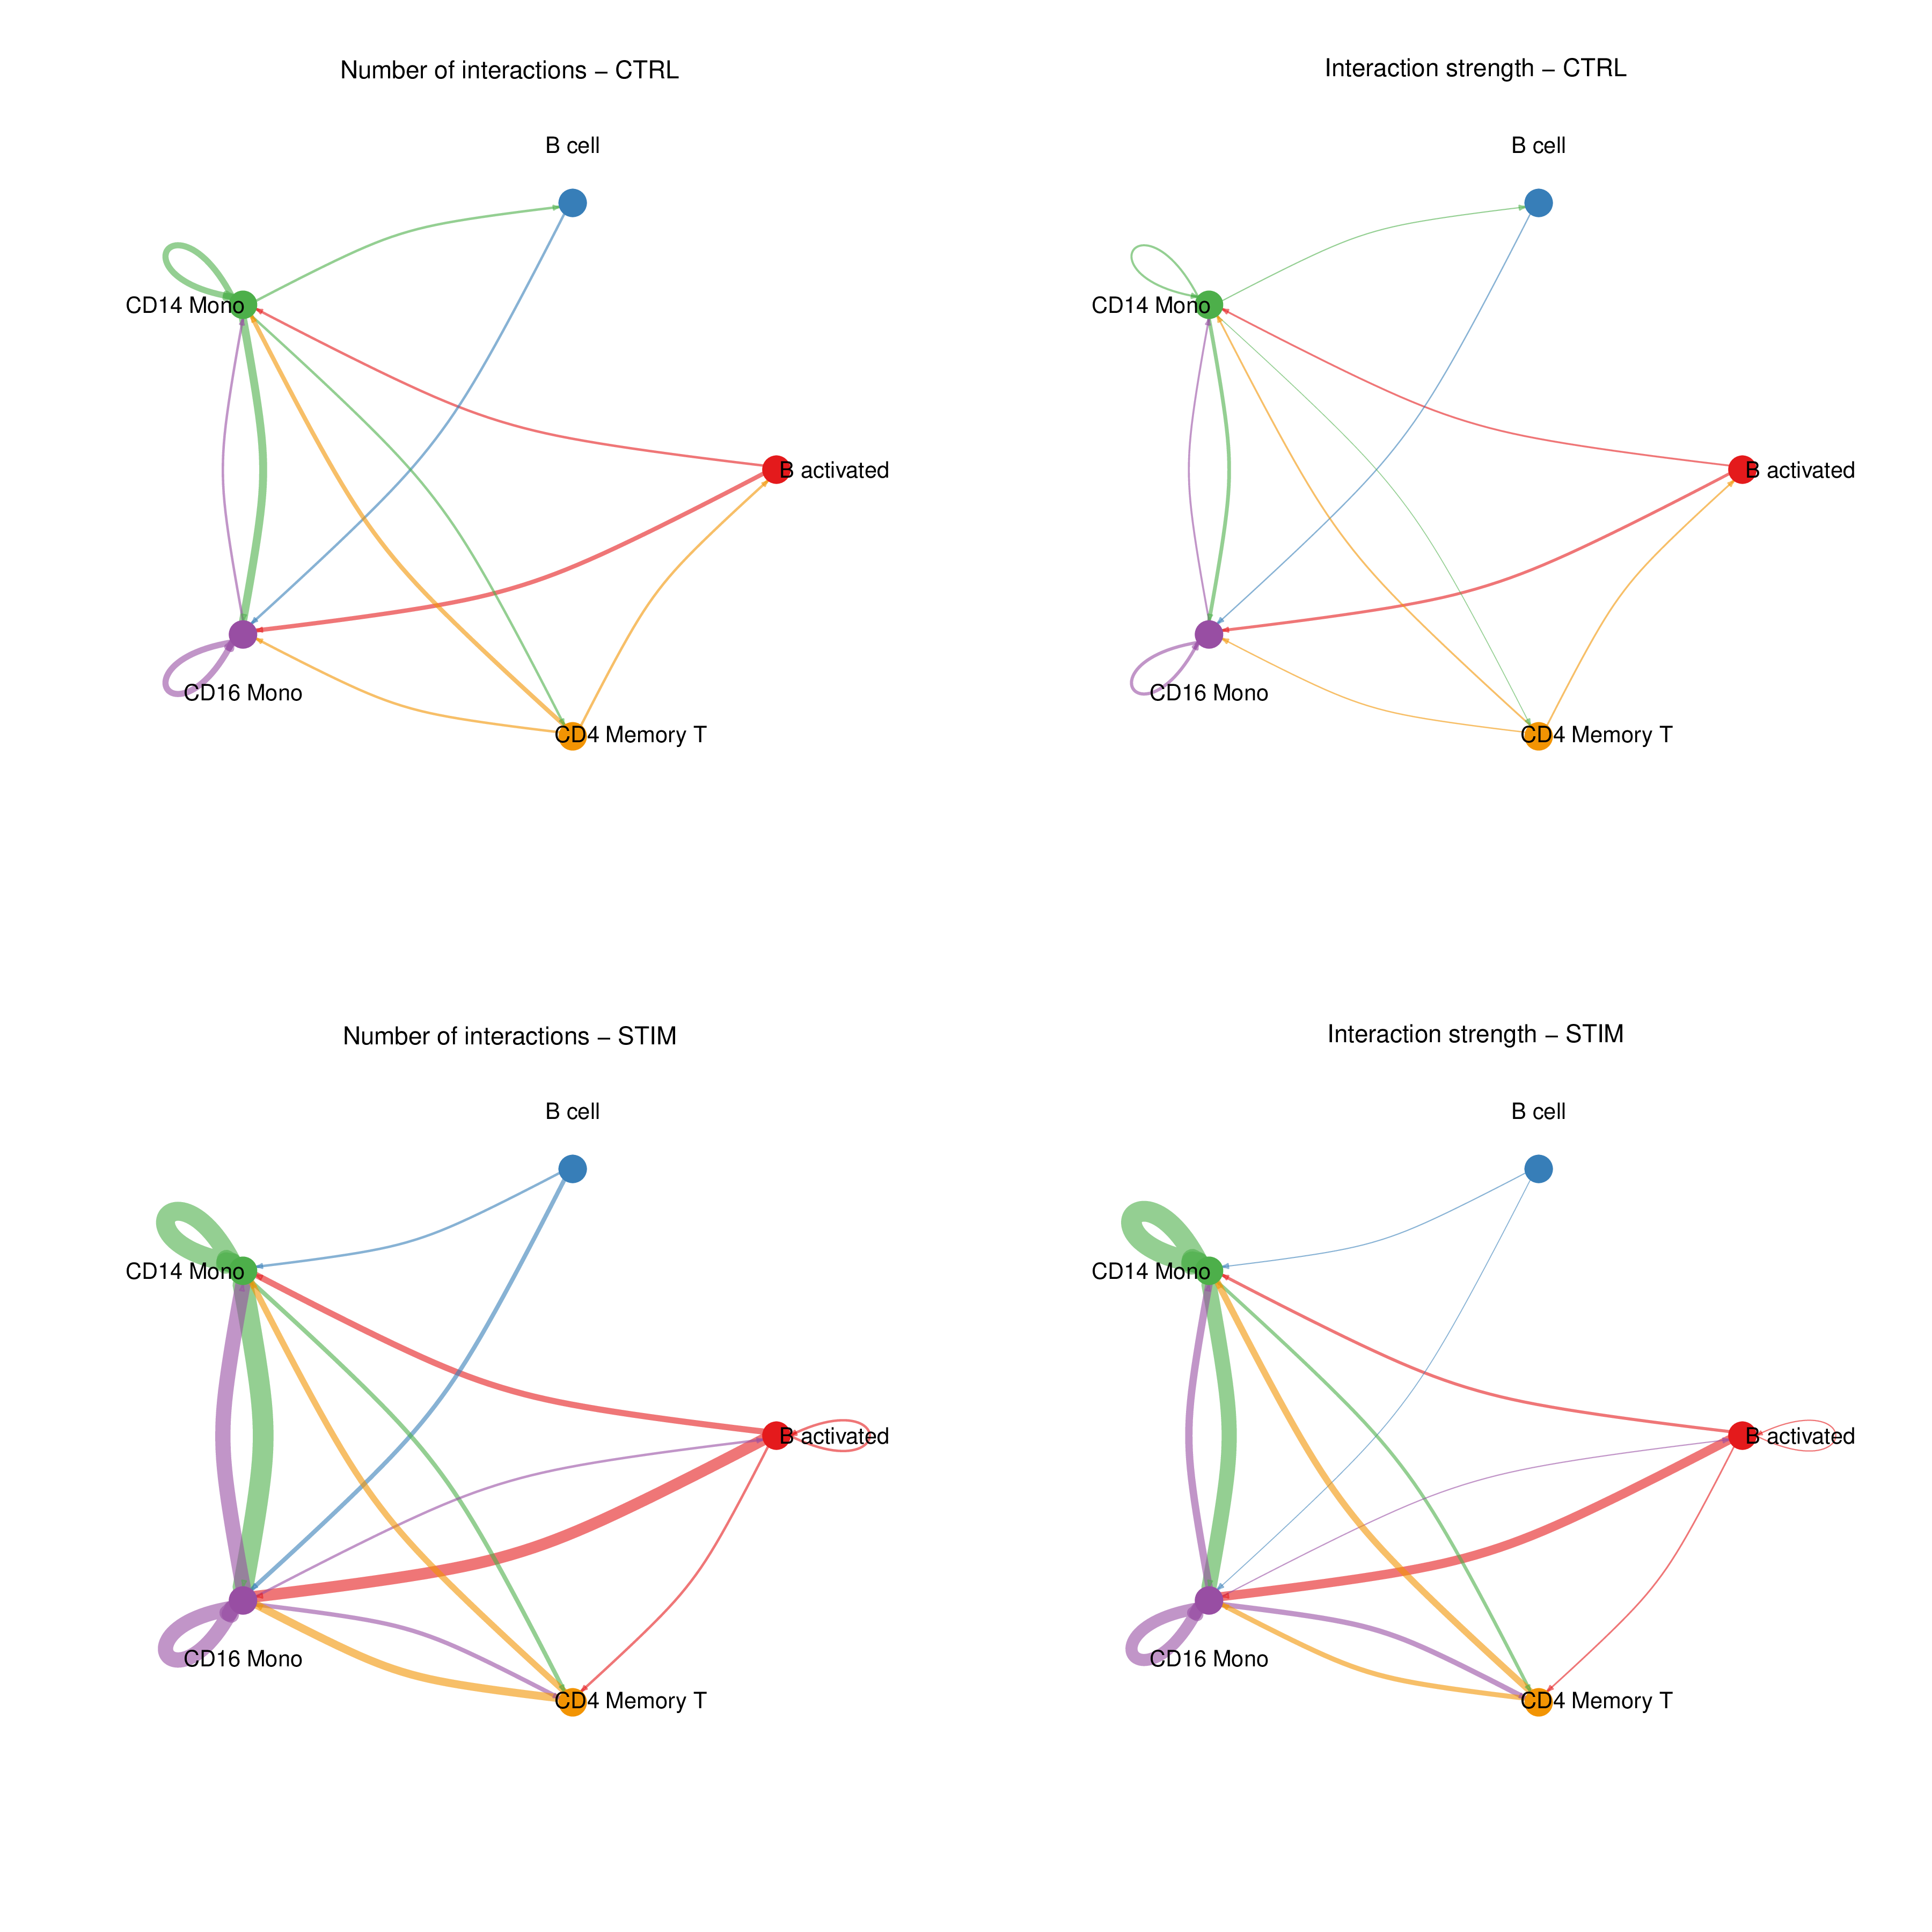
Figure: Circle plot showing send/receive relationships and strength between cell groups (example figure).
3.2 Biological Interpretation of Common Charts
- Circle/Chord Plot: Displays overall interaction relationships between cell groups. Ring width/arc represents total send or receive strength, connecting lines represent interaction amounts between cells.
- Heatmap (Interaction Matrix): Rows/columns represent sending/receiving cells, color depth represents interaction strength or L-R pair number, facilitating quick identification of the most active cell pairs.
- Bubble Plot: Displays expression of specific L-R pairs in each cell group, point size represents expression proportion, color represents average expression.
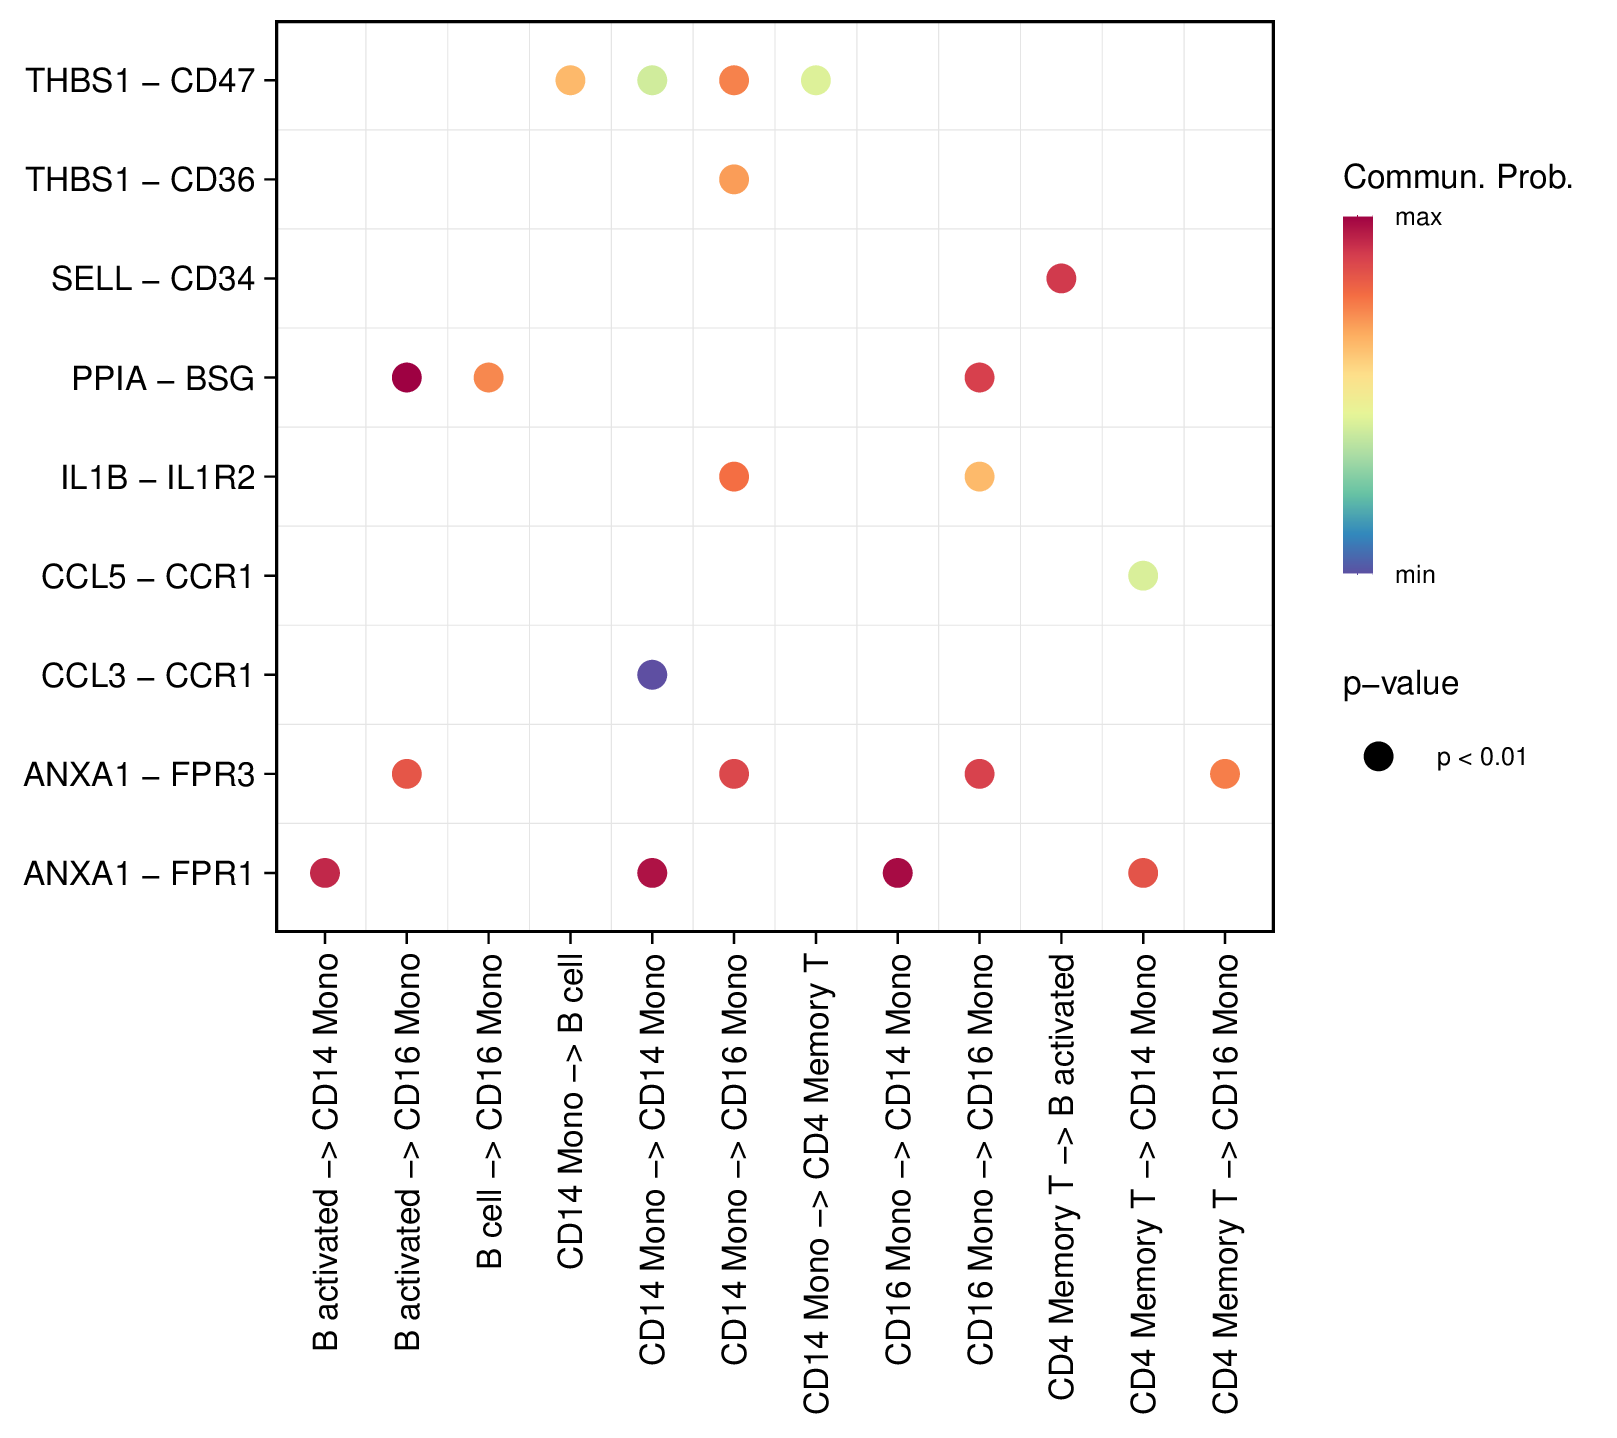
Figure: Ligand-receptor bubble plot, showing expression proportion and average expression of ligands in different cell groups (example figure).
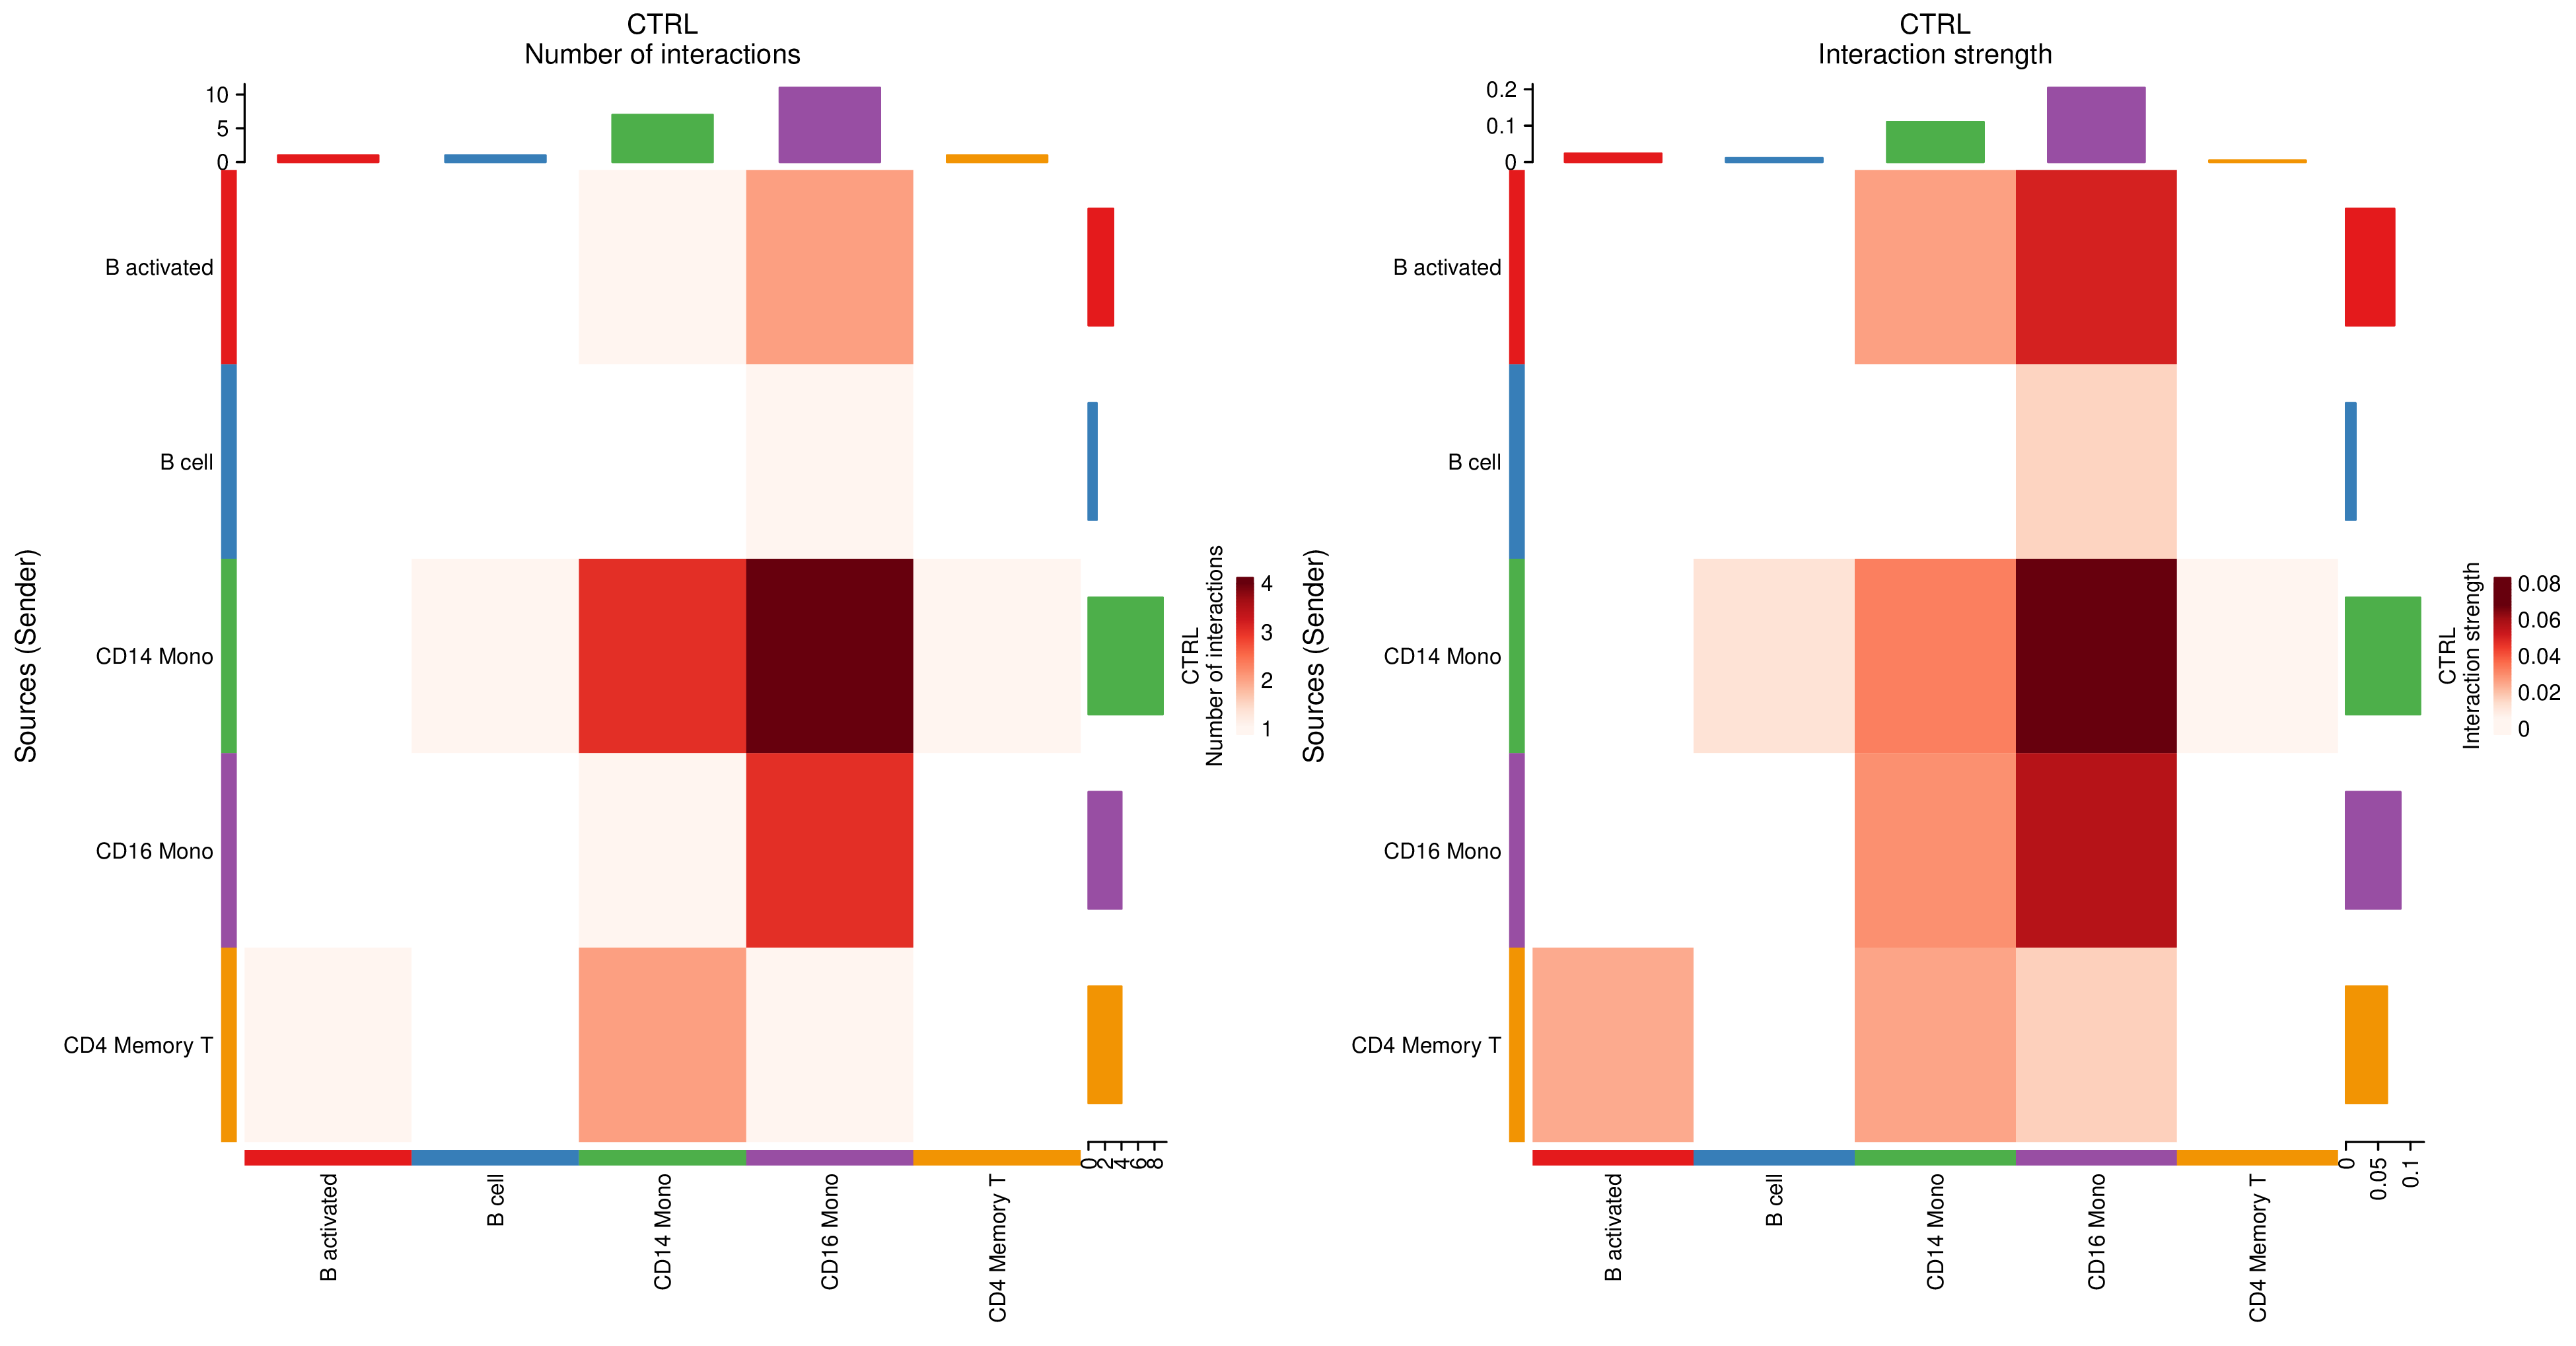
Figure: Interaction strength heatmap, used for intuitive comparison of communication differences between cell groups (example figure).
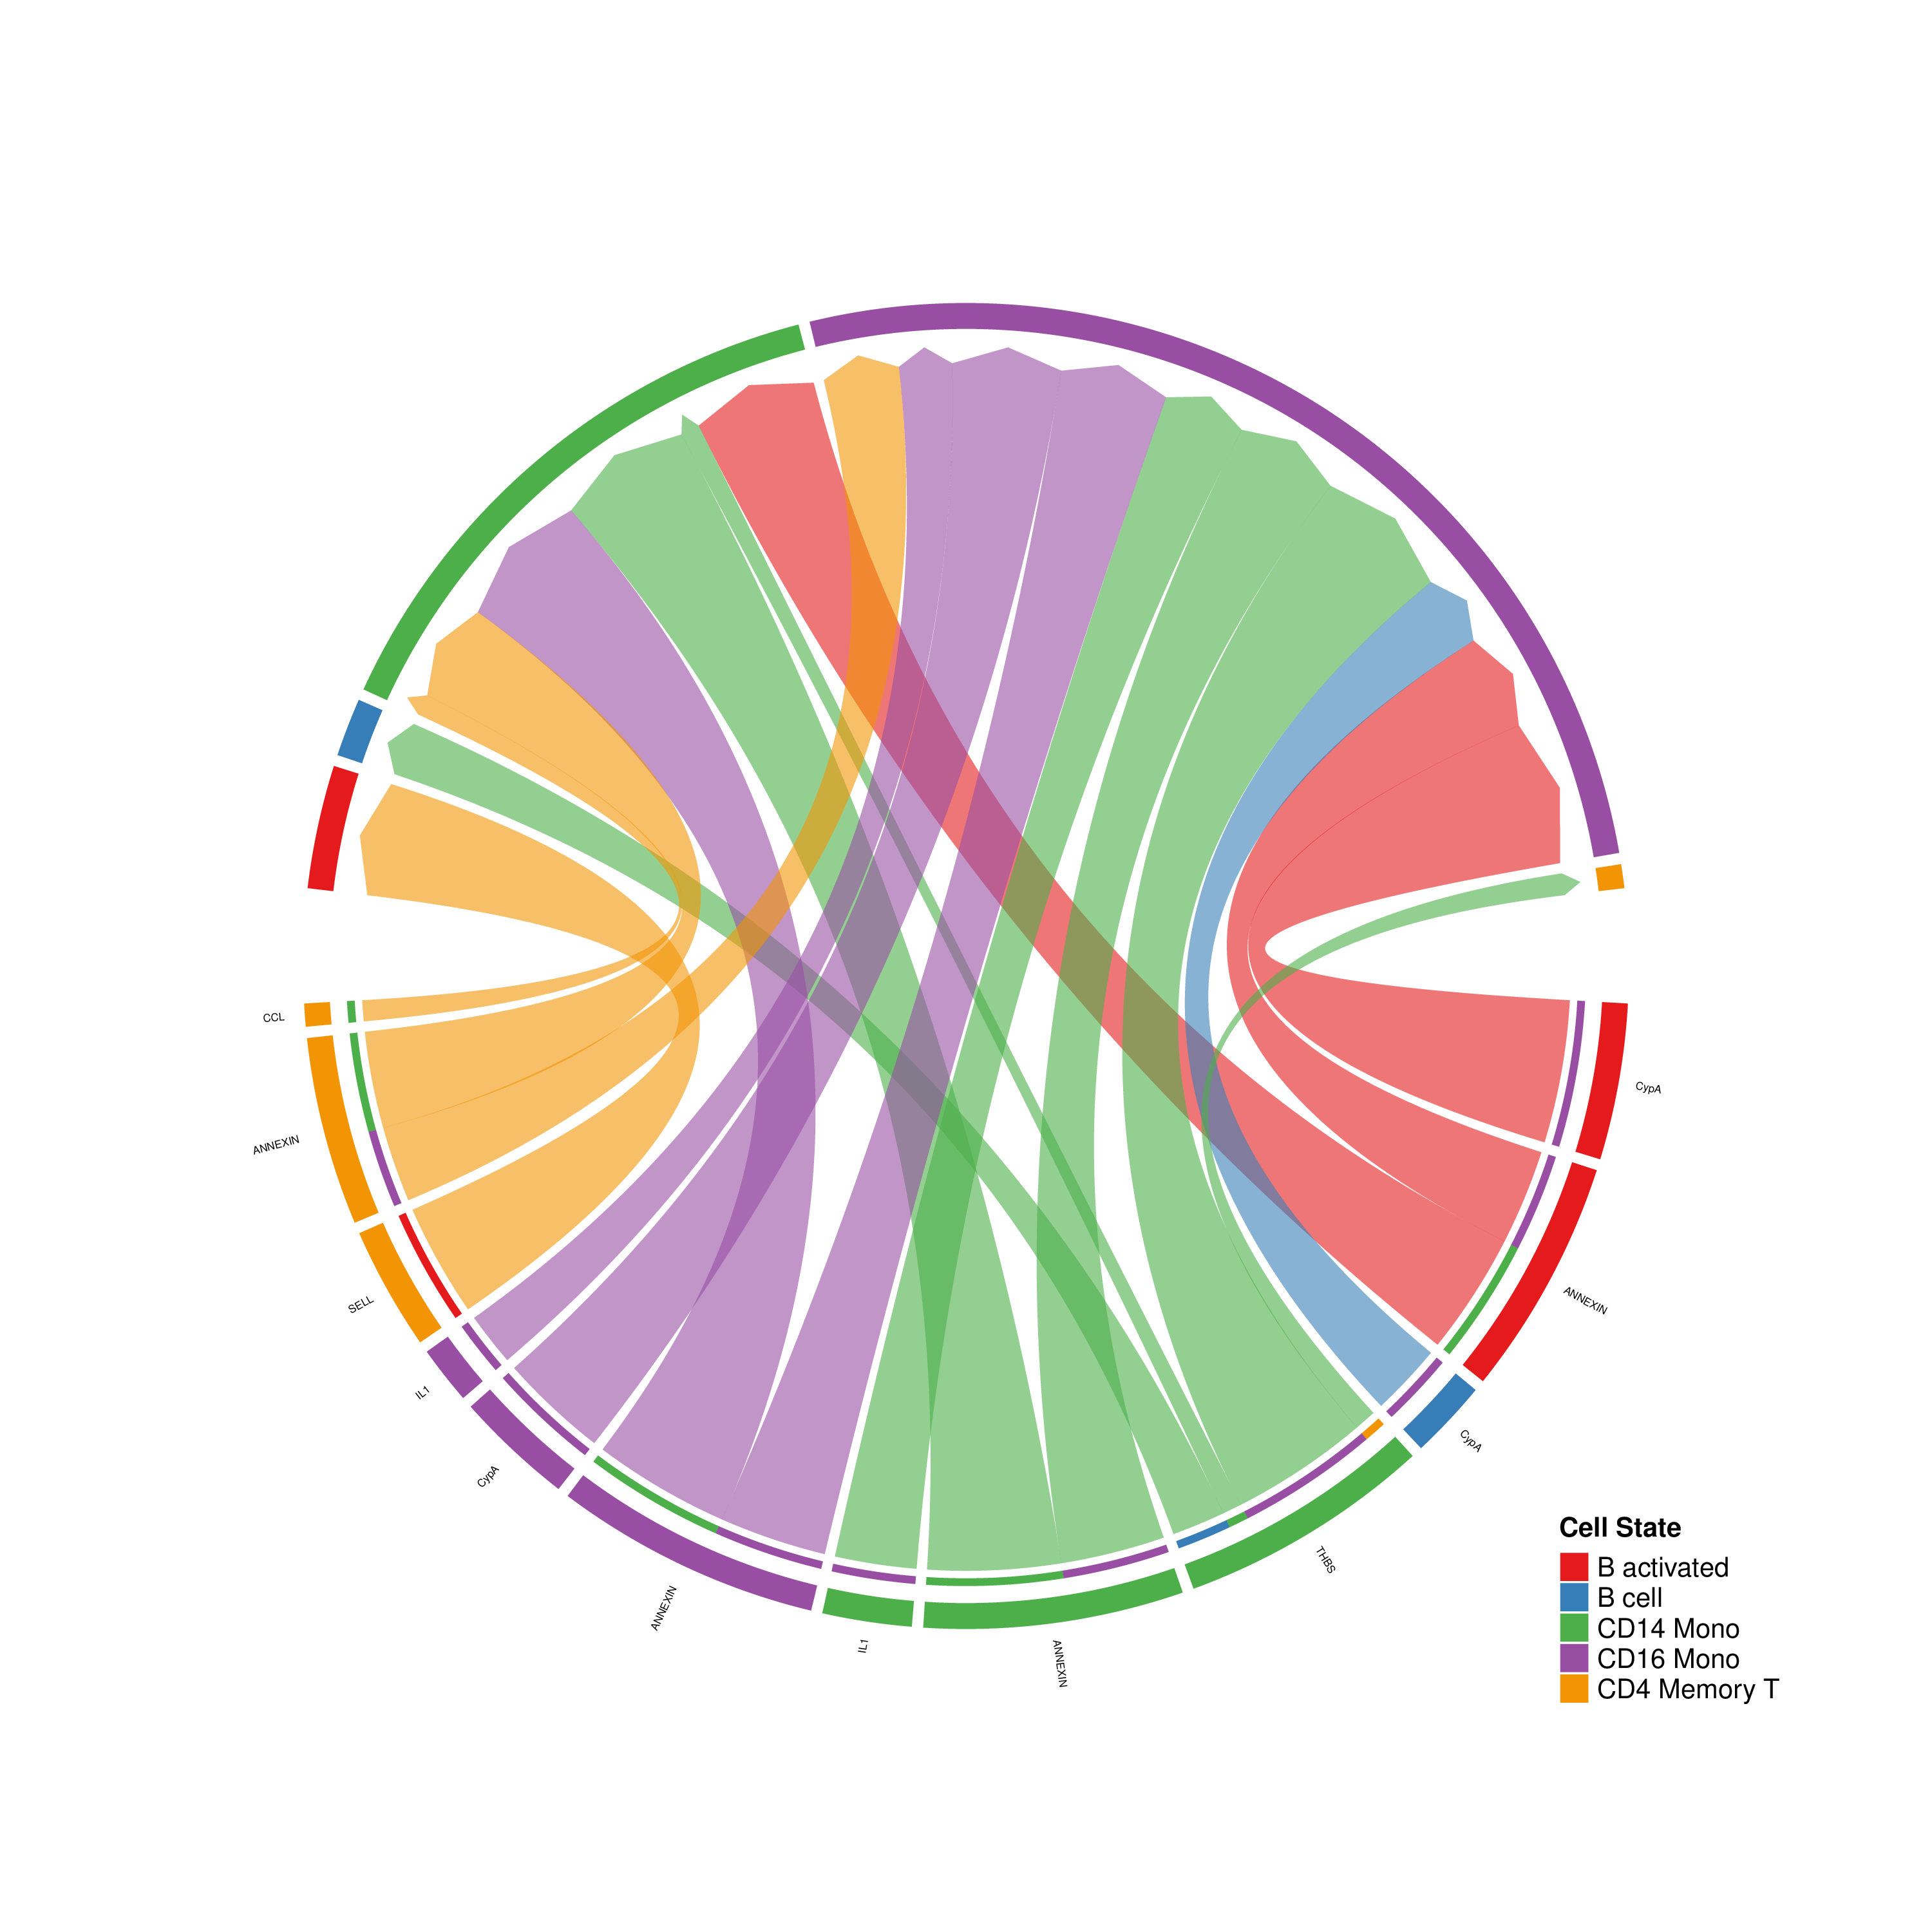
Figure: Chord plot used to display pairwise interactions between cell groups (example figure).
3.3 Interpretation Points and Screening Strategy
- Prioritize high-intensity and biologically reasonable L-R pairs (high expression + high statistical significance + literature support);
- Combine pathway analysis: If multiple L-R pairs concentrate on the same pathway, that pathway may be a key communication pathway;
- Focus on cell roles: Analyze scatter plots or role heatmaps of send/receive roles to identify main senders and receivers;
- Verification priority: Prioritize verification of Top ligands and their predicted target genes or receptor expression.
4 Case: Communication Analysis Between B Cells and Monocytes in Human Immune Microenvironment (Example)
4.1 Analysis Objective
Identify important ligand-receptor communication between B cells and CD14 monocytes, and evaluate changes in inflammation-related pathways (such as TNF, IL1) between different treatment groups.
4.2 Key Findings (Example)
- CD14_Mono → B_cell: Found that IL1 family ligands are highly expressed in monocytes, and corresponding receptors are enriched in B cells;
- Pathway level: IL1 signaling pathway is significantly enhanced in the treatment group, with pathway strength differences prioritized;
- Image validation: Bubble plot shows high expression proportion and average expression of IL1B in CD14_Mono, heatmap and chord plots both support this pathway as the dominant signal.
4.3 Biological Significance and Recommended Validation Experiments
- Biological Significance: IL1-mediated monocyte-lymphocyte communication may be involved in inflammatory responses and immune regulation;
- Experimental Validation Recommendations: Flow cytometry or immunohistochemistry to validate cell localization of IL1B/IL1R1; in vitro co-culture combined with blocking antibodies to validate functional effects;
- Downstream Analysis: Combine differential expression and enrichment analysis to confirm expression changes of IL1 downstream target genes.
5 Notes and Best Practices
WARNING
Avoid overinterpretation: CellChat provides statistical inference results that need to be combined with literature and experimental validation.
- Data Quality: Ensure each cell type has sufficient cell numbers (recommended at least 50 cells); rare cells require careful threshold adjustment and combined downsampling strategies;
- Batch Effects: Process batch effects first in multi-sample comparisons to avoid false positive signals;
- Species Consistency: Ensure using species databases (human/mouse) consistent with samples.
6 References and Resources
- CellChat official website and documentation:
https://github.com/sqjin/CellChat. - Jin S, et al. Inference and analysis of cell-cell communication using CellChat. Nat Commun. 2021;12:1088.