
ATAC_DiffEnrich Analysis Documentation
Introduction
TIP
ATAC_DiffEnrich is an analysis tool for differential chromatin accessibility and regulatory network reconstruction from single-cell ATAC-seq data.
ATAC_DiffEnrich analysis identifies differential accessibility regions (DARs) between different cell groups or conditions, and reconstructs the upstream regulatory network through a multi-evidence chain closure strategy, tracing from differential accessibility regions to core transcription factors (TF). Unlike traditional differential expression analysis, ATAC_DiffEnrich focuses on chromatin accessibility changes, revealing the dynamic processes of epigenetic regulation from a regulatory perspective.
Core Functions
- Differential Accessibility Analysis: Identifies differential accessibility regions (Differentially Accessible Regions, DARs) between different cell groups or experimental conditions
- TF Motif Enrichment Analysis: Identifies transcription factor motifs significantly enriched in differential accessibility regions
- TF Activity Inference: Infers TF activity changes through chromVAR algorithm
- Regulatory Network Reconstruction: Reconstructs TF → Peak regulatory relationships through multi-evidence chain closure strategy
Theoretical Foundation
Core Principles
ATAC_DiffEnrich analysis follows the "regulatory perspective" logic: chromatin accessibility changes are often the starting point of gene regulation, and by identifying differential accessibility regions and tracing back to core TF, it is possible to reveal the dynamic processes of epigenetic regulation.
The core analysis workflow includes:
- Differential Accessibility Identification: Identifies differential accessibility regions between different cell groups or conditions
- TF Motif Enrichment Analysis: Identifies TF motifs significantly enriched in differential accessibility regions
- TF Activity Inference: Infers TF activity changes through chromVAR algorithm
- Multi-Evidence Chain Closure: Reconstructs high-confidence TF → Peak regulatory relationships by combining motif enrichment and activity inference evidence
Key Algorithms
- Differential Accessibility Analysis: Identifies differential accessibility regions using Wilcoxon rank-sum test
- TF Motif Enrichment Analysis: Identifies enriched TF motifs through motif scanning and hypergeometric test
- chromVAR Algorithm: Infers TF activity changes by calculating chromatin accessibility deviations at TF binding sites
- Multi-Evidence Chain Closure: Reconstructs regulatory relationships through integration of motif enrichment and activity inference evidence
Cloud Platform Operation Guide
On the cloud platform, the ATAC_DiffEnrich analysis workflow is designed to be intuitive and user-friendly. You don't need to write code; you can complete the analysis simply through the parameter configuration interface.
Pre-Analysis Preparation
TIP
The success of ATAC_DiffEnrich analysis largely depends on the quality of input data and cell group definition. Before starting the analysis, please ensure:
- Data preprocessing is complete: Your single-cell ATAC data has undergone standard quality control, dimensionality reduction (PCA, UMAP), and clustering.
- Clear cell group definition: Define the comparison groups to analyze (such as different cell types, different experimental conditions, etc.).
- Motif annotation is complete: Ensure the input Seurat object has completed
AddMotifsoperation, containing complete Motif sequence annotation. - Reference genome is correct: Ensure the reference genome matches the species of the data.
Parameter Details
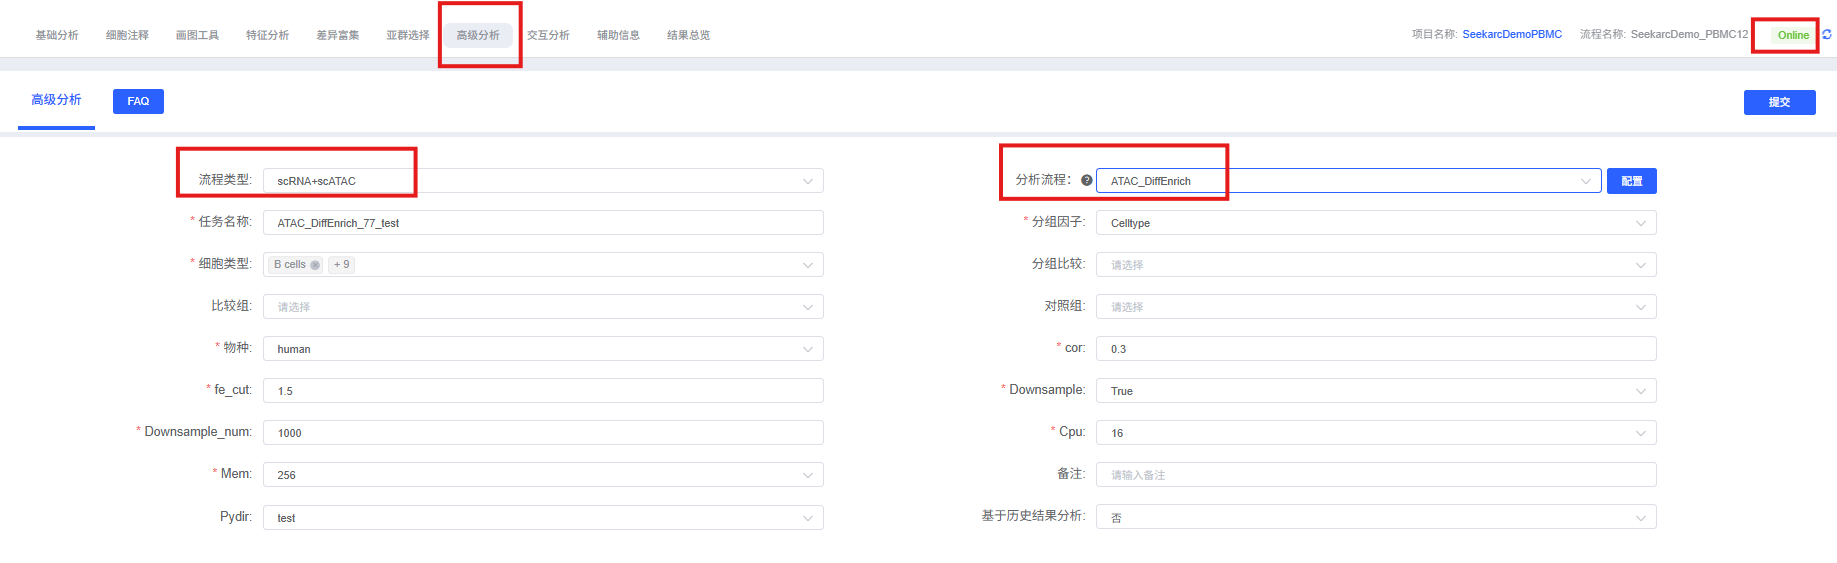
The table below lists the main parameters of the ATAC_DiffEnrich analysis module on the cloud platform and their descriptions.
| Interface Parameter | Description |
|---|---|
| Task Name | The name of this analysis task, must start with an English letter, can contain English letters, numbers, underscores, and Chinese characters. |
| Grouping Factor | Cell grouping column name, used to define comparison groups (such as cell type, experimental condition, etc.). |
| Cell Types | Cell types to include in the analysis, only these types of cells will be used for differential accessibility analysis. |
| Dimensionality Reduction Method | Dimensionality reduction embedding method, optional "UMAP", "ATACUMAP", "WNNUMAP" (case-insensitive). |
| Species | Species information, used for Motif analysis and GO/KEGG functional enrichment analysis. Currently supports Human and Mouse. |
| Downsample | Logical value, whether to downsample cells before analysis, suitable for ultra-large-scale datasets, can significantly improve computational speed. |
| Downsample_num | Integer, if downsampling is enabled, this parameter specifies the maximum number of cells to retain for each cell type. |
Important Notes
TIP
- Cell group definition: Comparison groups must be clearly defined, such as different cell types or different experimental conditions. Overly fuzzy group definitions will lead to unreliable differential analysis results.
- Motif annotation dependency: Input data must contain complete Motif annotation information, otherwise TF motif enrichment analysis and chromVAR activity inference cannot be performed.
- Reference genome matching: The reference genome must match the species of the data, otherwise peak annotation and motif scanning will fail.
- Multiple testing correction: Differential accessibility analysis will perform multiple testing correction (Benjamini-Hochberg method) to control the false discovery rate (FDR).
- Result interpretation caution: Differential accessibility regions are only statistical results, and their biological significance needs to be combined with other experimental evidence for verification.
Operation Workflow
- Enter analysis module: Navigate to the "Advanced Analysis" module on the cloud platform, select "ATAC_DiffEnrich".
- Create new task: Name your analysis task and select the sample or project to analyze.
- Configure parameters: According to the above guidelines, select comparison groups, cell types, and other parameters.
- Submit task: After confirming parameters are correct, click the "Submit" button and wait for analysis to complete.
- View results: After analysis is complete, view the generated analysis report and result files in the task list.
Result Interpretation
1. Differential Accessibility Region Identification
1.1 Differential Accessibility Region Table
The platform outputs a detailed table of differential accessibility regions, containing the following key information:
- Peak coordinates: Genomic coordinates (chromosome, start position, end position)
- Statistical indicators: Fold change, p-value, FDR
- Cell group specificity: Cell groups or conditions where the region shows significant differential accessibility
Analysis Points
- FDR threshold: Usually use FDR < 0.05 as the significance threshold
- Fold change: Regions with large fold changes often have stronger biological significance
- Cell group specificity: Regions showing differential accessibility in specific cell groups may be related to cell type-specific regulatory programs
1.2 Differential Accessibility Region Heatmap
Displays the accessibility patterns of differential accessibility regions in different cell groups through a heatmap:
- Rows: Differential accessibility regions (Peak)
- Columns: Cell groups
- Color: Normalized accessibility signal intensity, red indicates high accessibility, blue indicates low accessibility
Analysis Points
- Clustering patterns: Differential accessibility regions with similar accessibility patterns may be regulated by the same TF
- Cell group specificity: Regions showing specific accessibility patterns in certain cell groups may be related to cell type-specific functions
2. TF Motif Enrichment Analysis
2.1 TF Motif Enrichment Bar Plot
Displays the top TF motifs significantly enriched in differential accessibility regions:
- X-axis: Enrichment score (-log10(p-value))
- Y-axis: TF motif name
- Color: Indicates the number of differential accessibility regions where the motif appears
Analysis Points
- Enrichment significance: Motifs with high -log10(p-value) values have stronger enrichment significance
- Biological relevance: The functions of TF corresponding to top enriched motifs need to be combined with known biological knowledge for interpretation
2.2 TF Motif Enrichment Heatmap
Displays the enrichment patterns of multiple TF motifs in different differential accessibility region sets through a heatmap:
- Rows: TF motif
- Columns: Differential accessibility region set (such as cell group-specific differential regions)
- Color: Enrichment score, red indicates significant enrichment, blue indicates not enriched
Analysis Points
- Motif combination patterns: TF motif combinations enriched in the same differential region set may work together to regulate chromatin accessibility
- Cell group specificity: Motifs showing specific enrichment patterns in certain cell groups may be related to cell type-specific regulatory networks
3. TF Activity Inference
3.1 TF Activity Distribution Plot
Shows the distribution of TF activity in different cell groups:
- X-axis: TF activity score (z-score)
- Y-axis: Cell group
- Color: Activity distribution density
Analysis Points
- Activity differences: TF with significantly different activity in different cell groups may be key factors driving cell group differences
- Activity distribution: The width and peak position of the activity distribution curve reflect the consistency and magnitude of TF activity
3.2 TF Activity Heatmap
Displays the activity patterns of key TF in different cell groups through a heatmap:
- Rows: TF
- Columns: Cell groups
- Color: TF activity score (z-score), red indicates high activity, blue indicates low activity
Analysis Points
- Activity patterns: TF with similar activity patterns may participate in the same regulatory network
- Cell group specificity: TF with specific high or low activity in certain cell groups may be related to cell type-specific regulatory programs
4. Regulatory Network Reconstruction
4.1 TF → Peak Regulatory Network Diagram
Visualizes the TF → Peak regulatory relationships reconstructed through multi-evidence chain closure:
- Center node: Core TF
- Peripheral nodes: Target Peak regions
- Connecting lines: Regulatory relationships, thickness indicates regulatory strength
Analysis Points
- Core TF: TF with many target Peaks and high regulatory strength may be core factors of the regulatory network
- Regulatory hierarchy: Regulatory relationships can be hierarchically displayed based on regulatory strength
4.2 Regulatory Network Statistics Table
Provides detailed statistics of the regulatory network:
- TF: Transcription factor name
- Number of target Peaks: Number of Peak regions regulated by the TF
- Regulatory strength: Comprehensive regulatory strength score
- Motif enrichment significance: Motif enrichment p-value
- Activity change significance: chromVAR activity change p-value
Analysis Points
- Network hubs: TF with many target Peaks and high regulatory strength are key nodes of the network
- Evidence reliability: Regulatory relationships need to be comprehensively evaluated based on the significance of multiple evidence
Important Notes
1. Importance of data quality: The results of ATAC_DiffEnrich analysis largely depend on the quality of input data. Please ensure the input data has undergone standard quality control and preprocessing, including removal of low-quality cells, removal of double cells, and normalization.
2. Cell group definition: Comparison groups must be clearly defined and biologically meaningful. Overly fuzzy or unreasonable group definitions will lead to unreliable differential analysis results.
3. Motif annotation necessity: Input data must contain complete Motif annotation information. If Motif annotation is missing, TF motif enrichment analysis and chromVAR activity inference cannot be performed, affecting the completeness of results.
4. Multiple testing correction: Differential accessibility analysis will perform multiple testing correction to control the false discovery rate. It is recommended to use the FDR-corrected p-value as the significance threshold.
5. Result interpretation caution: Differential accessibility regions and inferred TF → Peak regulatory relationships are only statistical results, and their biological significance needs to be combined with other experimental evidence (such as gene expression data, functional experiments) for verification.
6. Computational resource requirements: ATAC_DiffEnrich analysis involves a large number of statistical tests and Motif scanning, with significant computational load. For ultra-large-scale datasets, it is recommended to enable downsampling to speed up analysis.
Frequently Asked Questions (FAQ)
Q1: What is the difference between ATAC_DiffEnrich and differential expression analysis?
A: The main differences are:
- ATAC_DiffEnrich: Focuses on differential analysis of chromatin accessibility, identifying differential accessibility regions and reconstructing upstream regulatory networks
- Differential expression analysis: Focuses on differential analysis of gene expression, identifying differentially expressed genes
- Complementary relationship: The two can be used together; ATAC_DiffEnrich can reveal the epigenetic regulatory mechanisms behind gene expression changes
Q2: What to do if differential accessibility regions are few?
A: Possible reasons and solutions include:
- Cell count is too few: Leading to insufficient statistical power, it is recommended to increase cell count
- Cell group definition is unreasonable: Cell groups are too similar or too different, it is recommended to redefine comparison groups
- Data quality issues: Low-quality cells or batch effects affecting results, it is recommended to perform more stringent quality control
Q3: How to interpret TF motif enrichment results?
A: Interpretation recommendations:
- Biological relevance: The functions of TF corresponding to top enriched motifs need to be combined with known biological knowledge for interpretation
- Literature validation: Validate whether TF have been reported to play regulatory roles in related cell types or conditions through literature search
- Experimental validation: For key TF, it is recommended to verify their regulatory functions through experiments such as knockdown or overexpression
Q4: How to evaluate the reliability of TF activity inference?
A: Evaluation recommendations:
- Multiple evidence validation: Evaluate reliability by combining motif enrichment and TF activity inference results
- Expression level correlation: Verify whether TF expression levels are consistent with activity changes
- Functional annotation: Verify whether TF target gene functions are related to expected biological processes
Q5: Can ATAC_DiffEnrich results be integrated with other analysis results?
A: It can be integrated with multiple analyses:
- Peak2Gene analysis: Validate whether differential accessibility regions regulate the expression of nearby genes
- Trios analysis: Reconstruct more complete TF → Peak → Gene regulatory chains
- SCENIC+ analysis: Cross-validate TF → target gene regulatory relationships
- Differential expression analysis: Integrate chromatin accessibility changes and gene expression changes to reveal regulatory mechanisms
Methods
ATAC_DiffEnrich Methods Download
References
[1] Stuart T, Srivastava A, Madad S, et al. Single-cell chromatin state analysis with Signac. Nature Methods, 2021, 18(11): 1333-1341.
[2] Schep AN, Wu B, Buenrostro JD, et al. chromVAR: inferring transcription-factor-associated accessibility chromatin using single-cell data. Genome Biology, 2017, 18: 180.
[3] Pliner HA, Packer JS, McFaline-Figueroa JL, et al. Cicero predicts cis-regulatory DNA interactions from single-cell chromatin accessibility data. Molecular Cell, 2018, 71(5): 858-871.