
Single-cell scATAC-seq & scRNA-seq Dual-omics Standard Analysis: Peak2Gene Analysis
Introduction
TIP
Peak2Gene (Peak-Gene linking) analysis is a method specifically designed for single-cell multi-omics (ATAC + RNA) data. Its core goal is to identify significant regulatory relationships between gene expression and nearby chromatin accessibility peaks.
In single-cell multi-omics research, scATAC-seq and scRNA-seq data provide information from different dimensions. scATAC-seq data reveals chromatin accessibility status, indicating which genomic regions are open and potentially active in regulation; scRNA-seq data reveals gene expression levels, reflecting the final output of transcriptional activity. Peak2Gene analysis, by statistically analyzing the correlation between gene expression and ATAC signal intensity of nearby peaks in each cell, and using generalized linear models to correct technical biases such as GC content, peak length, and distance, infers which peaks may participate in regulating which genes.
Peak2Gene analysis not only helps reveal cis-regulatory networks (such as enhancer-gene connections) but can also be combined with motif enrichment/activity results to systematically mine direct target genes and regulatory effects of key transcription factors, making it one of the fundamental tools for multi-omics regulatory mechanism research.
Core Functions of Peak2Gene
peak-gene association identification By calculating the correlation between gene expression and accessibility signals of nearby peaks, identify peak sets that may regulate the gene, overcoming the limitations of relying solely on linear distance annotation.
Technical bias correction Use generalized linear models to correct multiple technical biases such as GC content, overall accessibility, and peak length, obtaining more reliable peak-gene associations.
Cis-regulatory network construction Help reveal cis-regulatory networks (such as enhancer-gene connections), providing a foundation for multi-omics regulatory mechanism research.
Integration with Motif analysis Combining motif analysis (TF → peak) with Peak2Gene analysis (peak → gene), systematically depict the direct regulatory axis among transcription factors, regulatory element peaks, and their target genes.
This document aims to provide single-cell multi-omics researchers with a detailed Peak2Gene technical guide, covering its basic principles, operation methods on the SeekSoul Online cloud platform, result interpretation, and common issues, helping you quickly master and apply this tool.
Peak2Gene Theoretical Foundation
Core Principles
The core idea of Peak2Gene analysis is: By statistically analyzing the correlation between gene expression and ATAC signal intensity of nearby peaks in each cell, and using generalized linear models to correct multiple technical biases, infer which peaks may participate in regulating which genes.
Gene Regulatory Network Overview
A Gene Regulatory Network (GRN) consists of transcription factors (TF), regulatory elements (such as promoters, enhancers, peaks), and target genes. TF initiates specific regulation by recognizing and binding to characteristic Motif sequences on target DNA. The advantage of single-cell multi-omics technology is that it can simultaneously observe TF and target gene expression (scRNA-seq) at single-cell resolution, as well as chromatin accessibility of TF binding sites (scATAC-seq, combined with motif recognition for inference).
By integrating single-cell ATAC and RNA data, we can achieve:
- Determination of TF expression profiles
- Evaluation of TF binding site (peak) openness
- Inference of motif enrichment status and functional activity
- Monitoring of dynamic changes in target gene expression
This three-dimensional integration of "TF expression × motif-peak binding × target gene expression" helps reconstruct the regulatory causal chain at single-cell scale, accurately capture key regulatory and action targets, and provide着力点 for GRN mapping and mechanism exploration.
How Peak2Gene Analysis Helps Parse GRN Gene Regulatory Networks
Motif Analysis: By comparing with known transcription factor recognition sequences, identify regions where TF may bind from open chromatin peaks, which is an important foundation for accurately describing TF → peak regulatory relationships. These motif-enriched peaks are considered as TF regulatory potential targets and are the "upstream" foundation of regulatory networks.
Peak2Gene Analysis: By examining the correlation between peak accessibility signals and nearby gene expression at single-cell level, accurately capture regulatory pairings between each peak and its potential target genes, overcoming the limitations of relying solely on linear distance annotation. This strategy strongly characterizes the real evidence of open peaks actually participating in gene regulation, explaining the "downstream" links of regulatory networks.
Integrated Analysis: Combining motif analysis (TF → peak) with Peak2Gene analysis (peak → gene) can systematically depict the direct regulatory axis among transcription factors, regulatory element peaks, and their target genes, providing multi-evidence support for multi-omics regulatory mechanism research.
TIP
Standard Analysis Workflow
- Differential peak screening: Locate open regions with biological significance
- Peak2Gene annotation: Integrate expression and distance, establish peak-gene associations
- Motif analysis: Identify and evaluate motif enrichment and activity, predict key TF
- Multi-omics joint validation: Analyze regulatory consistency among motif activity, TF/target gene expression, and peak accessibility
Key Algorithms and Workflows
For each target gene, Peak2Gene analysis includes the following key steps:
- Screen nearby peaks: Screen peaks within a certain distance range (such as ±500 kb) from the gene
- Calculate correlation: Calculate the correlation between these peaks' accessibility and gene expression
- Bias correction: Use generalized linear models to correct GC%, peak size, overall accessibility and other biases, obtaining more reliable peak-gene associations
This approach can precisely quantify the regulatory support evidence of each peak for target genes, which is a key step in reconstructing multi-omics regulatory networks. In practical applications, it is recommended to evaluate genes of interest first, and it can also be extended to whole-genome automatic annotation.
Cloud Platform Operation Guide
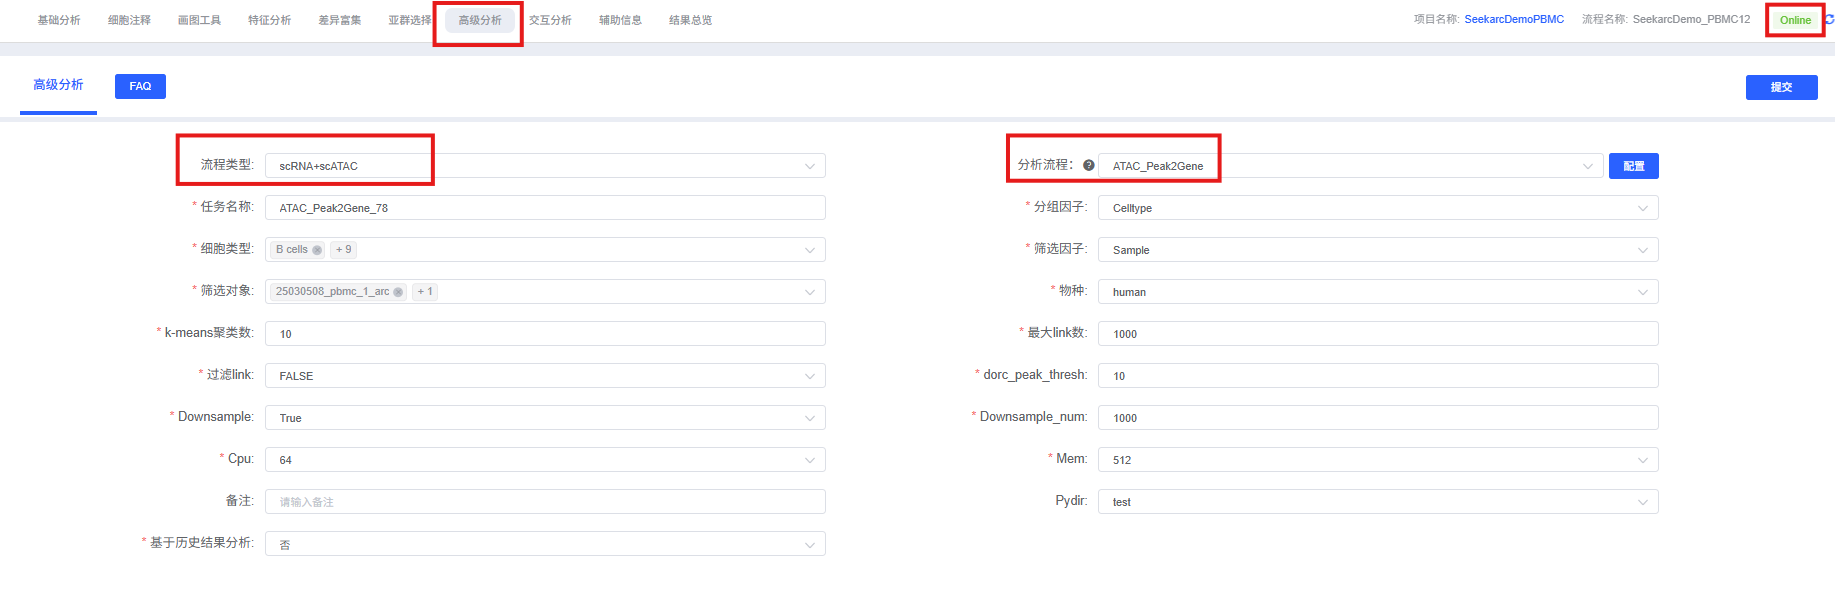
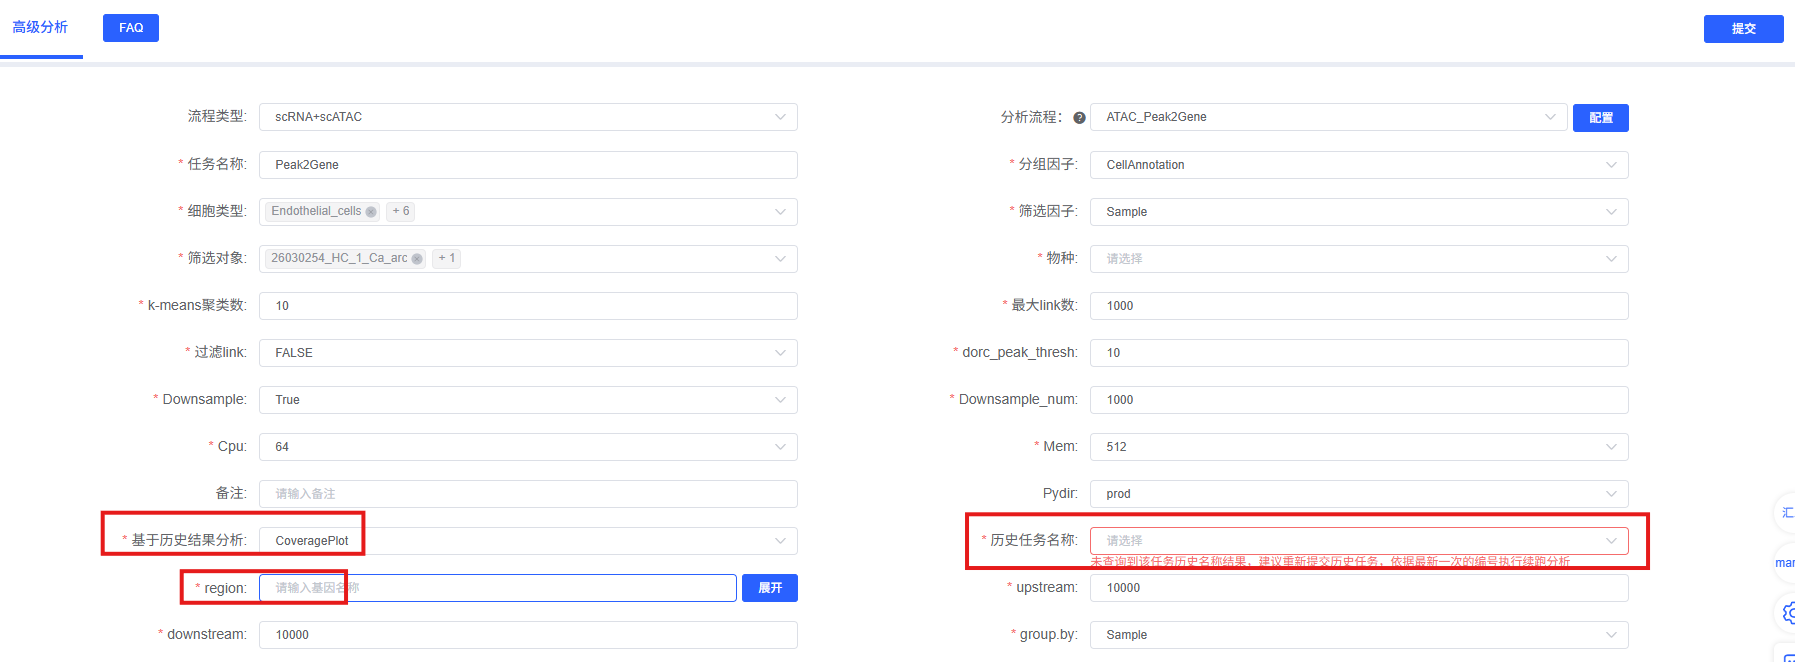
On the cloud platform, the Peak2Gene analysis workflow is designed to be intuitive and user-friendly. You don't need to write code; you can complete the analysis simply through the parameter configuration interface.
Pre-Analysis Preparation
TIP
The success of Peak2Gene analysis largely depends on the quality of input data and the matching of multi-omics data. Before starting the analysis, please ensure:
- Data preprocessing is complete: Your single-cell ATAC and RNA data has undergone standard quality control, dimensionality reduction, clustering, and cell type annotation.
- Data matching: Ensure ATAC and RNA data come from the same cells or matched cell populations for correlation analysis.
- Complete annotation information: Ensure data contains necessary cell type, sample grouping, and other annotation information for result display and interpretation.
- RegionStats step: Ensure RegionStats step has been executed to annotate GC content and other features of each peak region for subsequent bias correction.
Parameter Details
The table below lists the main parameters of the Peak2Gene analysis module on the cloud platform and their descriptions.
| Parameter Name | Description |
|---|---|
| Task Name | The name of this analysis task, must start with an English letter, can contain English letters, numbers, underscores, and Chinese characters. |
| Grouping Factor | Cell grouping column name. |
| Cell Types | Cell types to analyze. |
| Filter Factor | Sample name or grouping name to analyze. |
| Filter Object | Sample name or grouping name to analyze. |
| k-means Cluster Number | Number of clusters for k-means clustering, used for link grouping, default is 10. |
| Maximum Link Number | Maximum number of links to plot, default is 5000. |
| Filter Links | Option TRUE or FALSE, if TRUE then displays the following four parameters. |
| Correlation Threshold | Correlation threshold, used to filter links, default is 0.1. |
| P-value Threshold | P-value threshold, used for statistical significance filtering, default is 0.01. |
| ATAC Variance Threshold | Variance threshold for ATAC data, used to filter low-variability peaks, default is 0.25. |
| RNA Variance Threshold | Variance threshold for RNA data, used to filter low-variability genes, default is 0.25. |
| Downsample | Whether to randomly downsample each cell subgroup before analysis to save memory, default is TRUE. |
| Downsample_num | Maximum number of cells to retain for each cell subgroup, only effective when downsampling is enabled, default is 1000. |
| dorc_peak_thresh | Minimum number of associated Peaks required to define DORC genes. Genes with associated Peak counts exceeding this threshold are identified as DORC genes, default is 10. |
Important Notes
TIP
- Data quality requirements: Ensure the quality of ATAC and RNA data meets requirements. Low-quality data will lead to inaccurate peak-gene associations.
- Data matching: When performing correlation analysis, ensure ATAC and RNA data come from the same cells or matched cell populations.
- Distance window: Peak-to-Gene association analysis by default takes peaks within 500 kb upstream and downstream of gene TSS as candidate regulatory element pools. Shorter thresholds may miss long-range regulatory elements (such as distal enhancers), longer thresholds may introduce noise.
- Pseudobulk mechanism: To reduce sparsity (Dropout effect) of single-cell data and improve signal-to-noise ratio, the platform aggregates multiple cells into a "pseudo-cell" by cell subgroup before performing correlation calculation and heatmap plotting. Downsampling parameters will affect pseudobulk construction quality.
- Significance threshold: Links
P-value thresholddefault is 0.01. Only effective when "Filter Links" is enabled; when filtering is turned off, the platform will still automatically remove zero-variance peak/gene to ensure clustering stability, but will not apply significance filtering. Overly strict thresholds may lose true associations, overly lenient thresholds may introduce false positives. - DORC threshold:
dorc_peak_threshdefault is 10 (i.e., genes associated with ≥ 10 Peaks are defined as DORC). For datasets with less data, this threshold can be appropriately reduced (such as 5), for high-quality large datasets it can be appropriately increased. - KEGG enrichment network dependency: KEGG pathway enrichment requires access to online databases. If the network is unavailable, this part of results may be skipped, not affecting other analysis workflows.
- Integration with Motif analysis: Peak2Gene analysis results can be integrated with Motif analysis results to construct complete TF → peak → gene regulatory axes.
Operation Workflow
- Enter analysis module: Navigate to the "Advanced Analysis" module on the cloud platform, select "Peak2Gene".
- Create new task: Name your analysis task and select the sample or project to analyze.
- Configure parameters: According to the above guidelines, select cell types to analyze, grouping information, target genes, and other parameters.
- Submit task: After confirming parameters are correct, click the "Submit" button and wait for analysis to complete.
- View results: After analysis is complete, view the generated analysis report and result files in the task list, including peak-gene association heatmaps, correlation analysis results, etc.
Result Interpretation
Peak2Gene analysis reports contain rich charts and data files. Below is a detailed interpretation of core results.
Peak-Gene Co-regulatory Module Joint Heatmap (with Motif/GO Annotation)
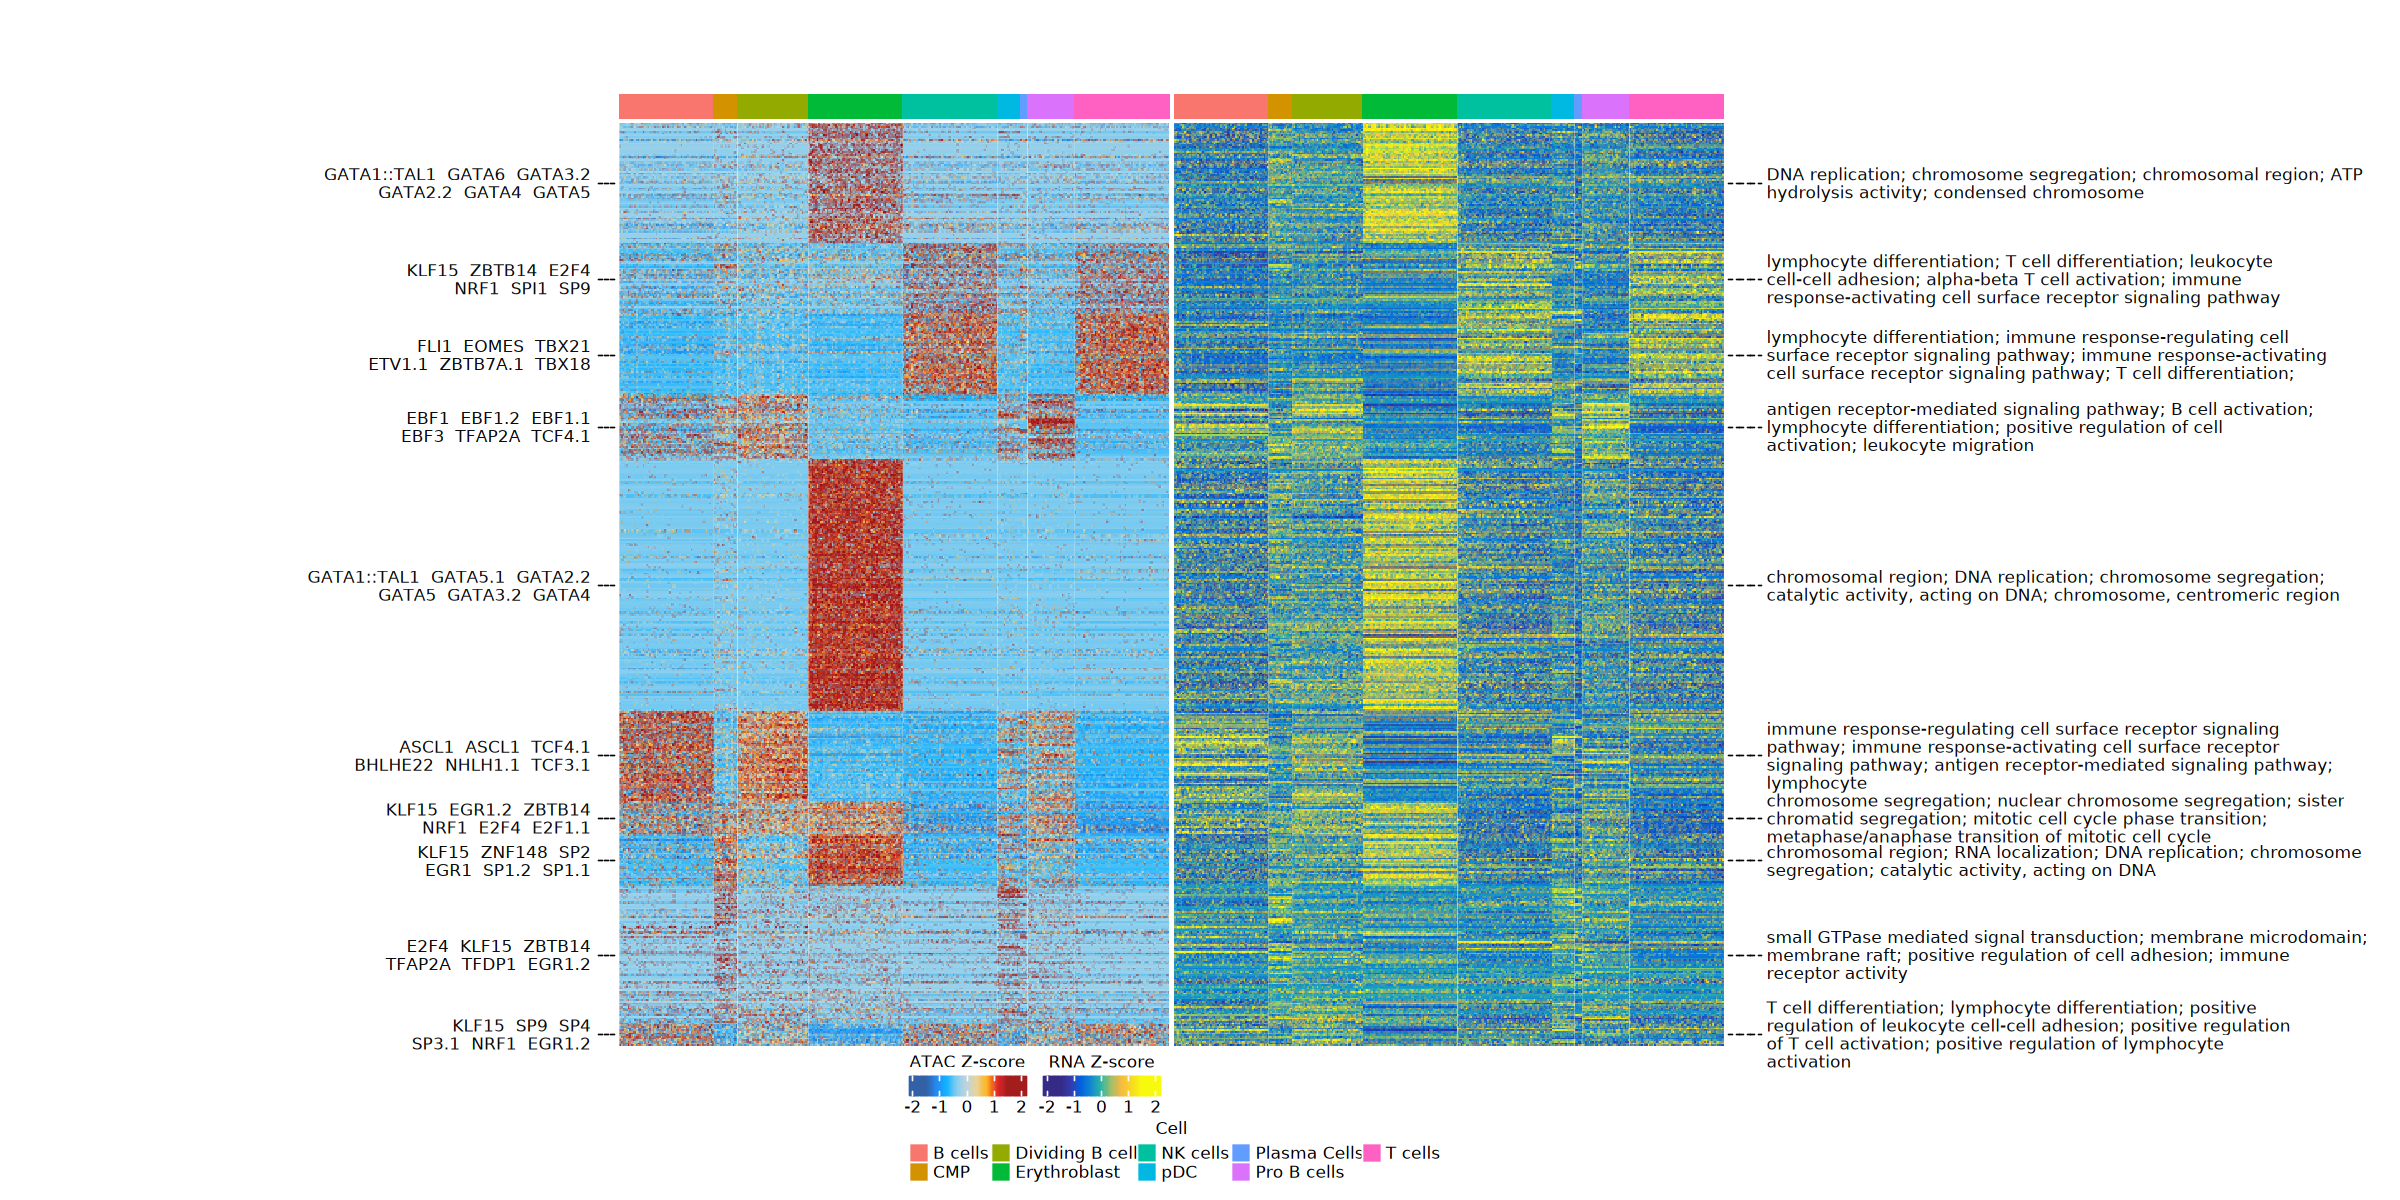
After K-means clustering is complete, the heatmap will also add Motif enrichment annotation and GO functional annotation on the left and right sides respectively, forming a complete multi-omics regulatory network panoramic view:
Plot Interpretation
This heatmap displays the co-regulatory patterns between chromatin accessibility regions and gene expression. All row data has been divided into K-means clusters based on co-regulatory patterns:
- Top color bar: Identifies different cell types or populations, helping intuitively compare Peak-Gene association activity patterns in specific cell subpopulations.
- ATAC heatmap (left): Displays ATAC-seq signal intensity (Z-score normalized accessibility). The bluer the color, the lower the accessibility; the redder the color, the higher the accessibility.
- RNA heatmap (right): Displays corresponding target gene expression levels (Z-score normalized expression). The bluer the color, the lower the expression; the yellower the color, the higher the expression.
- Motif annotation (leftmost text): Identifies transcription factor binding motifs significantly enriched in each K-means cluster (Top Motifs). These TF are often the upstream core regulatory factors driving gene expression in that cluster.
- GO functional annotation (rightmost text): Identifies Gene Ontology entries significantly enriched in target genes of each K-means cluster (Top GO Terms), intuitively revealing the core biological functions or cellular pathways that this co-regulatory module participates in.
Analysis Points
- Co-regulatory module identification: Through K-means clustering, Peak-Gene association pairs with similar cross-cell group variation patterns are divided into independent co-regulatory clusters.
- Upstream regulatory factor tracing: Left Motif annotation reveals the upstream transcription factor driving factors for each module.
- Downstream functional revelation: Right GO annotation explains which biological processes the target genes associated with each module mainly participate in.
Motif Enrichment Analysis
Perform transcription factor Motif enrichment analysis on the Peak sequences of each K-means clustering module to infer which TF drive the opening of that module. The platform will automatically perform hypergeometric tests for each Cluster and output Motif enrichment result tables (including Motif name, p-value, enrichment fold change, etc.), and annotate Top enriched Motifs on the left side of the joint heatmap.
GO/KEGG Functional Enrichment Analysis
Perform pathway enrichment analysis on the target genes associated with each K-means clustering module to reveal the core biological functions that the regulatory network participates in. The platform will perform GO enrichment and KEGG pathway enrichment separately, outputting enrichment result tables and visualization charts (bar plots, bubble plots, etc.), and annotate Top GO Terms on the right side of the joint heatmap.
Associated Peak Count Distribution Histogram
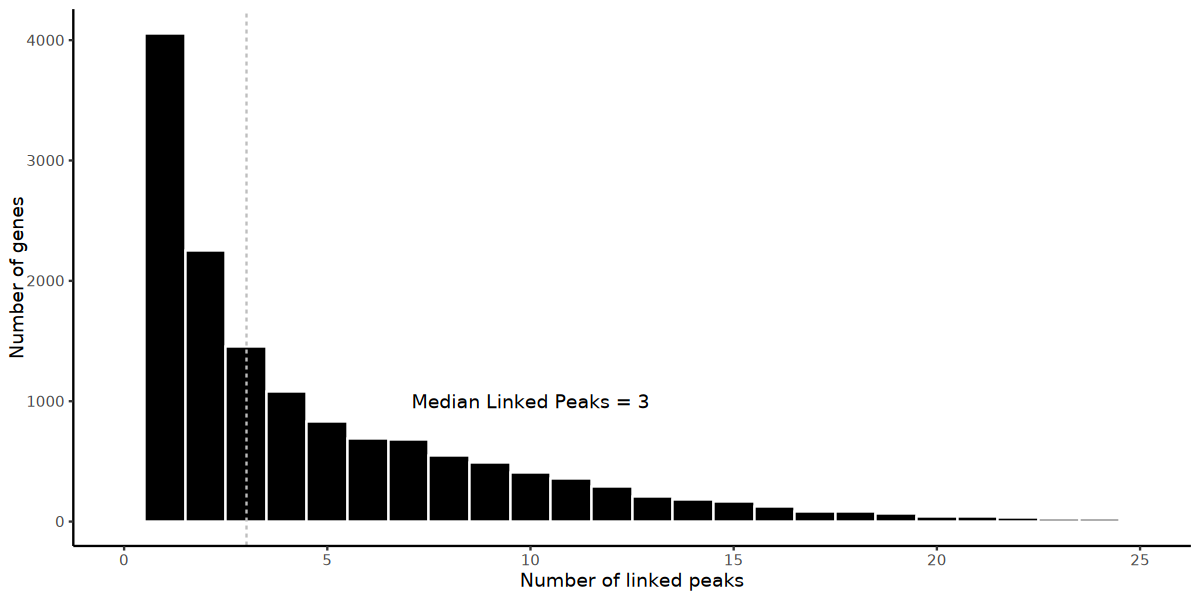
This histogram displays the quantity distribution of genes associated with 1~25 peaks:
Plot Interpretation
- X-axis: Number of peaks associated with genes (1~25)
- Y-axis: Number of genes with corresponding associated peak counts
- Dashed lines indicate median positions and annotate specific medians with text
Analysis Points
- Association quantity distribution: By observing the histogram, you can understand the distribution of peak counts associated with most genes.
- Median evaluation: The median reflects the typical level of peak counts associated with genes, helping to evaluate analysis quality.
- Outlier identification: Genes with abnormally many or abnormally few associated peaks are worth further attention.
Top Significant peak-gene Association Volcano Plot
The volcano plot focuses on the Top 10 most significant peak-gene associations:
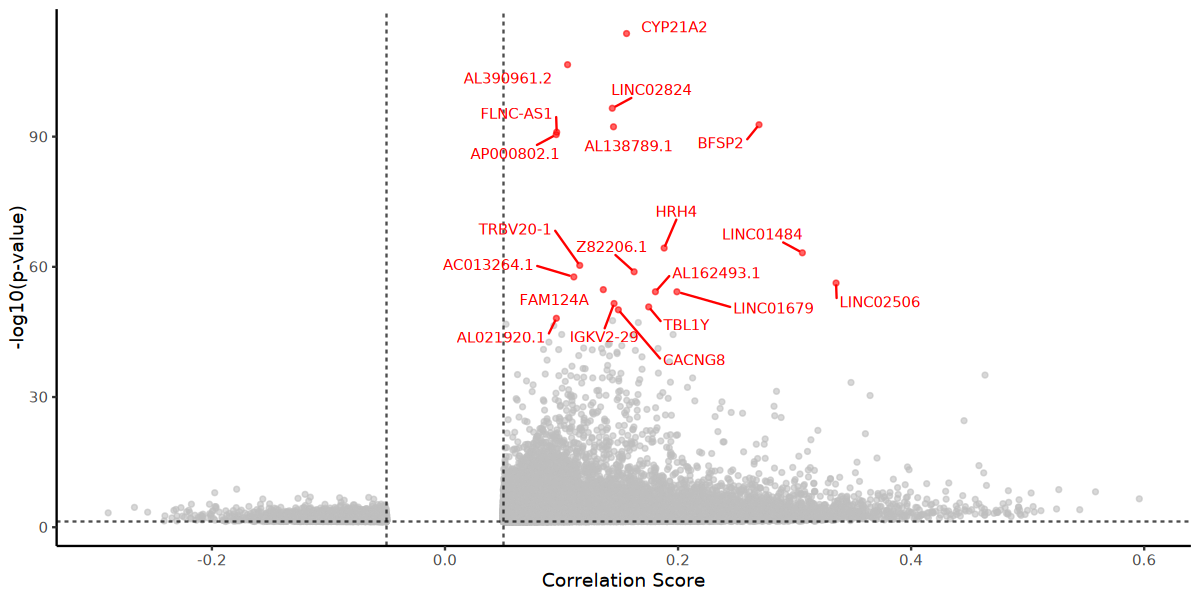
Plot Interpretation
- X-axis: Correlation score
- Y-axis: -log10(p) value
- Annotates Top 10 significant genes for intuitive presentation
Analysis Points
- Significant association identification: The Top 10 most significant peak-gene associations are research priorities, worth further analysis.
- Correlation strength: By observing correlation scores, you can evaluate the strength of peak-gene associations.
- Statistical significance: By observing -log10(p) values, you can evaluate the statistical significance of associations.
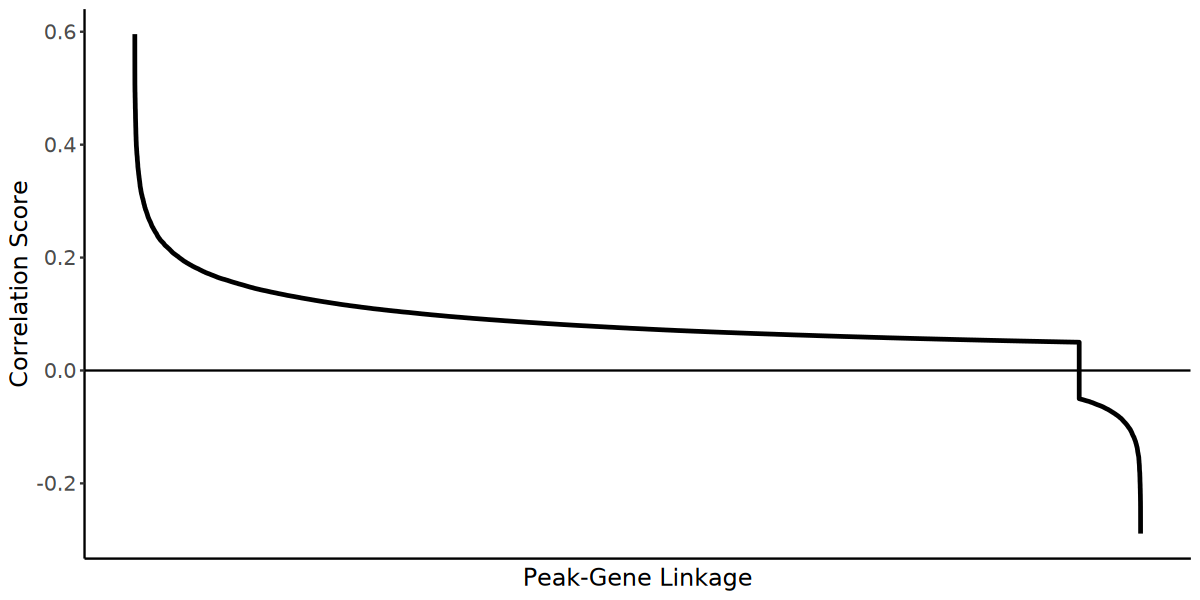
All peak-gene Pair Correlation Distribution Curve
The curve plot overall displays the correlation coefficient distribution of all peak-gene pairs:
Plot Interpretation
- X-axis: peak-gene pairs (ordered by correlation from high to low)
- Y-axis: Corresponding correlation coefficients
Analysis Points
- Overall distribution pattern: By observing the curve plot, you can understand the correlation distribution patterns of all peak-gene pairs.
- Strong association identification: peak-gene pairs with strong correlations are located on the left side of the curve, which are research priorities.
- Threshold selection: You can select appropriate correlation thresholds based on the curve plot for filtering significant associations.
DORC Gene Identification
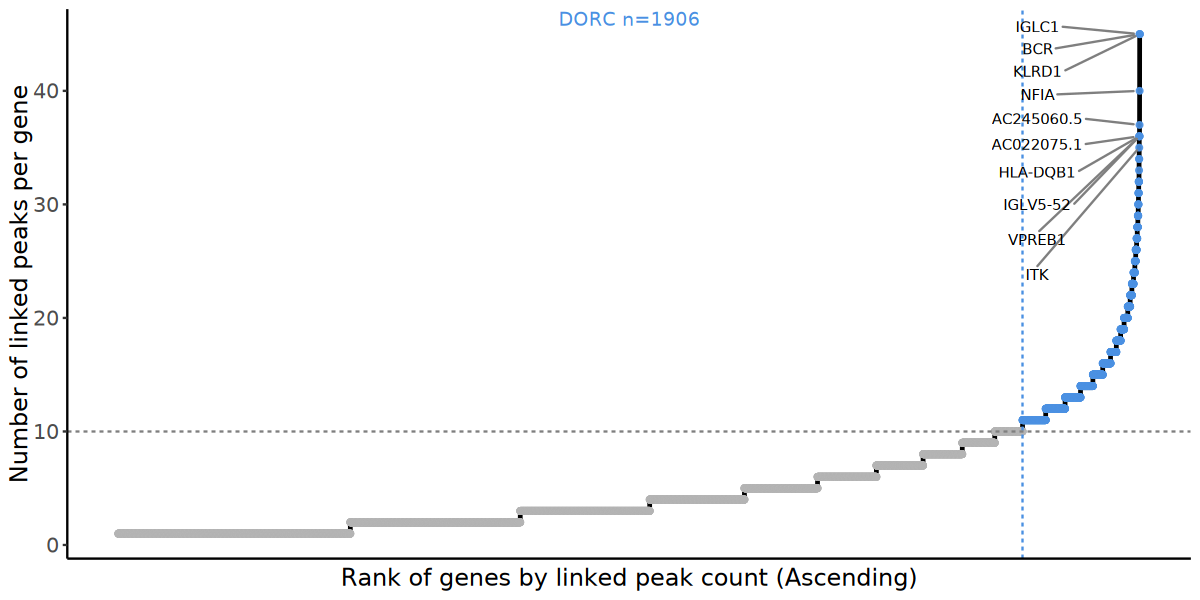
DORC (Domains of Regulatory Chromatin) refers to super target genes controlled by a large number of cis-regulatory elements in coordination. Based on the results of global Peak-to-Gene association analysis, the platform counts the total number of Peaks associated with each target gene and sets a threshold (controlled by the "DORC Peak Threshold" parameter, default is ≥ 10 associated Peaks), identifying genes exceeding this threshold as DORC genes. These DORC genes are usually the core regulatory hubs that determine cell fate, maintain cell state, or drive disease progression.
Plot Interpretation
This ranking plot displays the ranking overview of all target genes by associated Peak counts:
- X-axis (Rank): All target genes are arranged in ascending order by associated Peak counts from less to more.
- Y-axis (Number of linked peaks): The absolute number of Peaks significantly associated with each target gene in the whole genome.
- Gray horizontal dashed line: Defines the truncation threshold for DORC genes (default is ≥ 10 associated Peaks).
- Blue vertical dashed line: Separates super regulatory genes on the right that meet the threshold condition (blue dots) from ordinary genes on the left (gray dots).
- Text annotation: The chart top annotates the total number of identified DORC genes, while the right dense area annotates some representative DORC gene names, helping to quickly locate potential key core driving genes.
DORC Activity Assessment
Weight or merge the ATAC accessibility signals of all Peaks belonging to the same DORC gene to generate a comprehensive "DORC Score" (Accessibility Score) representing the overall upstream regulatory strength of that DORC gene for each cell. This scoring matrix will be used for subsequent differential analysis and visualization.
DORC Activity Differential Analysis
Based on the single-cell DORC activity scoring matrix, use Seurat's FindAllMarkers function to perform differential activity analysis, identifying DORC genes that specifically show high regulatory activity in each cell subgroup, thereby identifying标志性 regulatory hubs that maintain specific cell group homeostasis or drive their differentiation. The result table contains information such as p-value, avg_log2FC, pct.1/pct.2, p_val_adj, and cluster for each DORC gene.
DORC Activity UMAP Spatial Visualization
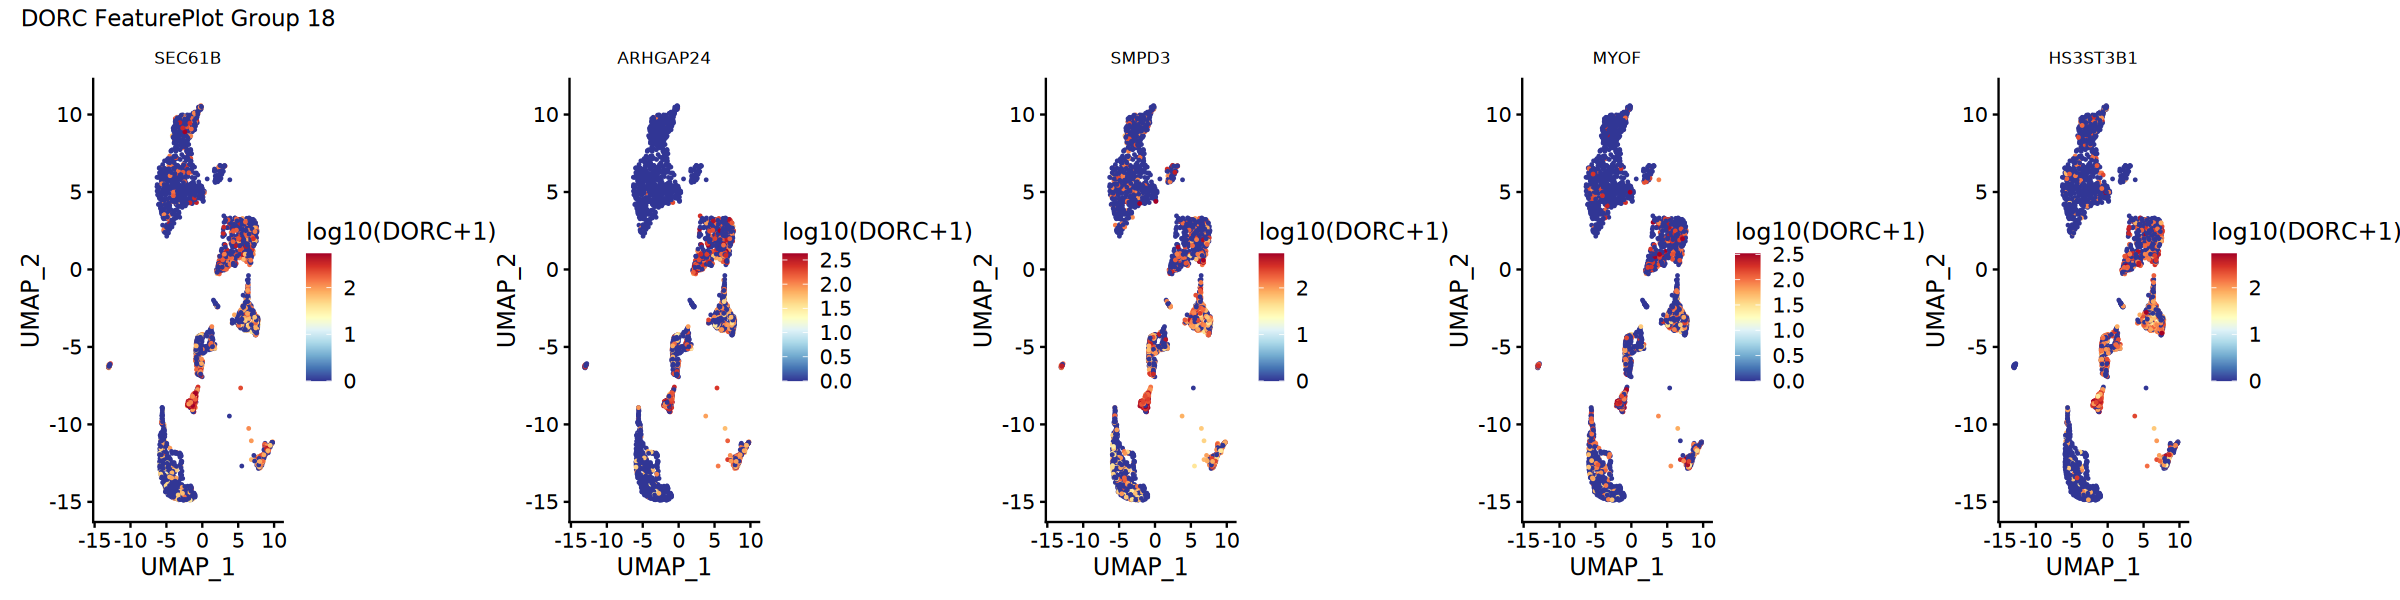
Based on the specific Top DORC genes for each cell subgroup, display their single-cell level activity distribution in UMAP dimensionality reduction space. Since DORC score differences may be very large, log10 transformation and quantile truncation are performed in advance to smooth extreme values.
Plot Interpretation
This FeaturePlot displays the spatial distribution and relative regulatory activity of each core DORC gene in different single-cell populations:
- Scatter points (cells): Each scatter point represents a single cell, and its position in two-dimensional space reflects the overall transcriptome or chromatin state similarity between cell populations.
- Color gradient (activity score): Colors reflect the log-smoothed values (log10(DORC+1)) of the cumulative accessibility scores of specific DORC genes in that cell.
- Dark blue: Represents unactivated or very low activity.
- Yellow-green: Represents medium transition state.
- Orange to dark red: Represents that the multiple enhancer elements associated with that gene are highly open in that cell, with very strong regulatory activity.
- Group display: Each group displays 5 genes in pages. The FeaturePlots of all DORC genes can be found in the result directory
DORC_FeaturePlot_5in1/.
DORC Cell Group Level Activity Heatmap
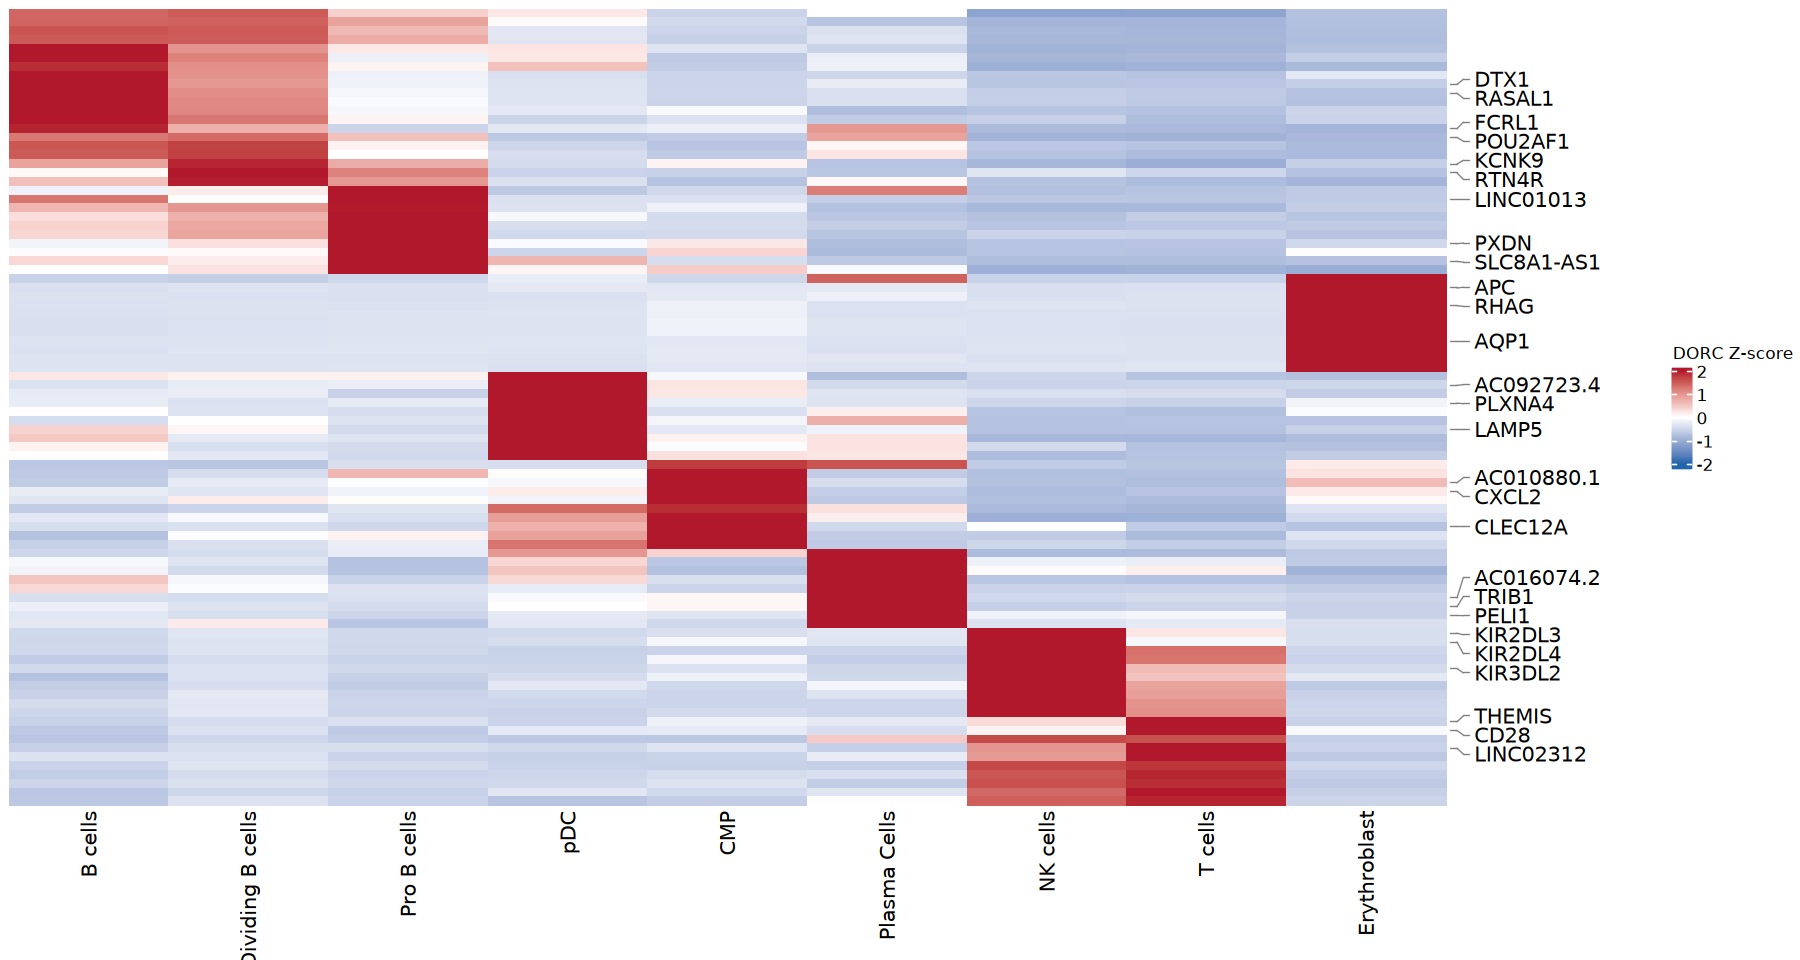
To display the core DORC gene activity patterns for each cell subgroup from a global perspective, aggregate and fit the single-cell level DORC matrix by cell subgroup (Pseudobulk) and calculate average activity. Then extract the Top 10 specific DORC genes for each subgroup, perform Z-score standardization, and plot hierarchical clustering heatmaps.
Plot Interpretation
This heatmap displays the global activity atlas of specific core DORC genes for each cell subgroup:
- Y-axis (rows): Represents the Top 10 most significant differential DORC genes extracted from each cell subgroup. Row data has been hierarchically clustered.
- X-axis (columns): Represents different cell subgroups defined in the data.
- Color gradient (Z-score): Reflects the relative regulatory activity of specific genes in different cell groups. Red indicates activity significantly higher than the average level, blue indicates activity significantly lower than the average level, white indicates close to the average value.
- Right annotation: Labels the DORC gene names corresponding to each clustering cluster through connecting lines.
- Core findings: By observing the "red highlight color block matrix" on the heatmap, you can intuitively lock onto the core transcriptional regulatory hubs that drive the development or maintenance of biological characteristics of specific cell classes.
Result File List
| File Name | Content Description |
|---|---|
Gene2PeakLinks.xls | Core data: Contains all significant Peak-to-Gene associations and their correlation scores and p-values (internal file name in R script is Gene2PeakLinks.xls). |
Peak2Gene_Kmeans_Clusters.tsv | K-means clustering results, recording the co-regulatory cluster number each Peak-Gene association pair belongs to. |
Peak2GeneHeatmap.pdf/png | Peak-to-Gene association heatmap. |
Peak2GeneHistogram.pdf/png | Peak-to-Gene histogram. |
Peak2GeneVolcano.pdf/png | Peak-to-Gene volcano plot. |
Peak2GeneRank.pdf/png | Peak-to-Gene ranking curve plot. |
Peak2GeneGeneLinkCountRank.pdf/png | DORC identification scatter plot: Display all genes in ascending order by associated Peak counts, defining and highlighting DORC genes exceeding the threshold. |
output.rds | Seurat object after completing Peak2Gene analysis (contains RegionStats/LinkPeaks information). |
Cluster_Enrichment/ | Enrichment analysis result directory for each K-means clustering cluster. |
Cluster_N_Motif.tsv | Motif enrichment detailed results for a single Cluster. |
Cluster_N_GOenrich.xls | GO enrichment detailed results for a single Cluster. |
Cluster_N_KEGGenrich.xls | KEGG enrichment detailed results for a single Cluster. |
Cluster_N_GO_bar/dot.pdf/png | GO enrichment visualization charts for a single Cluster. |
Cluster_N_KEGG_bar/dot.pdf/png | KEGG enrichment visualization charts for a single Cluster. |
DORC_peaks_threshN_sum_sorted.tsv | DORC genes sorted summary table by associated Peak counts (N is the threshold). |
DORC_scores_threshN.tsv | Single-cell level DORC activity scoring matrix (TSV format). |
DORC_scores_threshN.rds | Single-cell level DORC activity scoring matrix (RDS format). |
DORC_FindAllMarkers.tsv | DORC gene differential activity analysis complete result table. |
DORC_top10_per_cluster_markers.tsv | Top 10 DORC genes with highest avg_log2FC in each cell subgroup table. |
DORC_top10_by_cluster.tsv | Top 10 DORC genes for each cell subgroup (sorted by cluster). |
DORC_pseudobulk_top10ByCluster.tsv | DORC gene average activity matrix after Pseudobulk aggregation. |
DORC_pseudobulk_top10ByCluster_heatmap.pdf | DORC gene activity clustering heatmap. |
output_with_dorc_downstream.rds | Seurat object after completing DORC downstream analysis (contains DORC assay). |
DORC_FeaturePlot_5in1/ | DORC gene UMAP FeaturePlot directory (5 genes per group). |
Important Notes
1. Importance of data quality: The result quality of Peak2Gene analysis largely depends on the quality of input data. Ensure both ATAC and RNA data have undergone sufficient quality control and normalization processing.
2. Data matching: When performing correlation analysis, ensure ATAC and RNA data come from the same cells or matched cell populations. Mismatched data will lead to incorrect associations.
3. Distance threshold selection: The default 500 kb distance threshold is suitable for most situations, but can be adjusted according to research needs. Smaller thresholds may miss long-range regulatory elements, larger thresholds may introduce noise.
4. Significance threshold: It is recommended to use the default p-value threshold (0.01). Overly strict thresholds may filter out many associations, overly lenient thresholds may introduce false positives.
5. Integration with Motif analysis: Peak2Gene analysis results can be integrated with Motif analysis results to construct complete TF → peak → gene regulatory axes. It is recommended to perform both types of analysis simultaneously in the analysis workflow.
6. Caution in result interpretation: Peak2Gene analysis identifies correlations, not causal relationships. Results need to be interpreted and validated in combination with biological knowledge and other evidence.
Frequently Asked Questions (FAQ)
Q1: What is the relationship between Peak2Gene analysis and Motif enrichment?
A: The two focus on different angles but results can be mutually validated:
- Peak2Gene: Mainly answers "which peaks actually regulate which genes", determining peak-gene regulatory relationships through correlation, outputting peak-gene pairs and correlation scores.
- Motif enrichment: Focuses on "which transcription factor binding sites (motifs) are enriched in a set of peaks", reflecting which TF may regulate these peaks, outputting motif abundance and statistical significance.
- Integrated analysis: Combining motif analysis (TF → peak) with Peak2Gene analysis (peak → gene) can systematically depict the direct regulatory axis among transcription factors, regulatory element peaks, and their target genes.
Q2: Why are there few associations obtained by Peak2Gene?
A: You can investigate the following aspects:
- Sample or cell count is small: Leading to insufficient statistical power, it is recommended to increase sample size
- Selected gene set is too small: Or target regions are restricted, it is recommended to expand analysis scope or perform whole-genome analysis
- Set significance threshold is too high: Filtering out many associations, it is recommended to appropriately relax thresholds
- RegionStats step not correctly executed: Lacking bias correction information, it is recommended to ensure RegionStats step has been correctly executed
- Data matching issues: Motif enrichment and Peak2Gene analysis used different cell subsets or filtering conditions, it is recommended to use the same cell subsets
Q3: How to choose appropriate distance thresholds?
A: Distance threshold selection needs to balance sensitivity and specificity:
- Default 500 kb: Suitable for most situations, can capture most cis-regulatory elements
- Smaller thresholds (such as 100 kb): More strict, may miss long-range regulatory elements, but can reduce noise
- Larger thresholds (such as 1 Mb): More lenient, may capture more long-range regulatory elements, but may introduce noise
- Recommendation: You can first use default thresholds, then adjust according to result quality
Q4: What downstream analyses can Peak2Gene analysis results be used for?
A: Peak2Gene analysis results can be used for various downstream analyses:
- Differential peak analysis: Combining differential peak analysis results to identify peak-gene associations with biological significance
- Motif analysis integration: Integrating with Motif analysis results to construct complete TF → peak → gene regulatory axes
- Functional enrichment analysis: Performing functional enrichment analysis on associated genes to reveal regulatory biological functions
- Multi-omics integration: Integrating with scRNA-seq data to reveal temporal correlations between chromatin accessibility and gene expression
- Regulatory network construction: Constructing gene regulatory networks based on peak-gene associations
Q5: How to judge the quality of Peak2Gene analysis?
A: Several key indicators for judging Peak2Gene analysis quality:
- Association count: Reasonable association counts reflect the statistical power of the analysis
- Correlation distribution: Correlation distribution should present reasonable patterns, with strong associations accounting for a certain proportion
- Biological rationality: Associated peak-gene pairs should conform to known biological knowledge
- Cell type specificity: Different cell types should show different peak-gene association patterns
Q6: What is the difference between Peak2Gene analysis and traditional distance annotation?
A: Peak2Gene analysis has the following advantages compared to traditional distance annotation:
- Correlation evidence: Based on single-cell level correlation analysis, providing more reliable regulatory evidence
- Technical bias correction: Using generalized linear models to correct multiple technical biases, improving accuracy
- Cell type specificity: Can identify cell type-specific peak-gene associations
- Dynamic changes: Can reveal dynamic changes of peak-gene associations in different cell states
Methods
Usage Tips: The ATAC_Peak2Gene, SCENICplus, Trios, and ATAC_Monocle3 modules on the cloud platform do not have sample grouping information in their parameters. To view the performance of different groups within the same cell type, follow these steps:
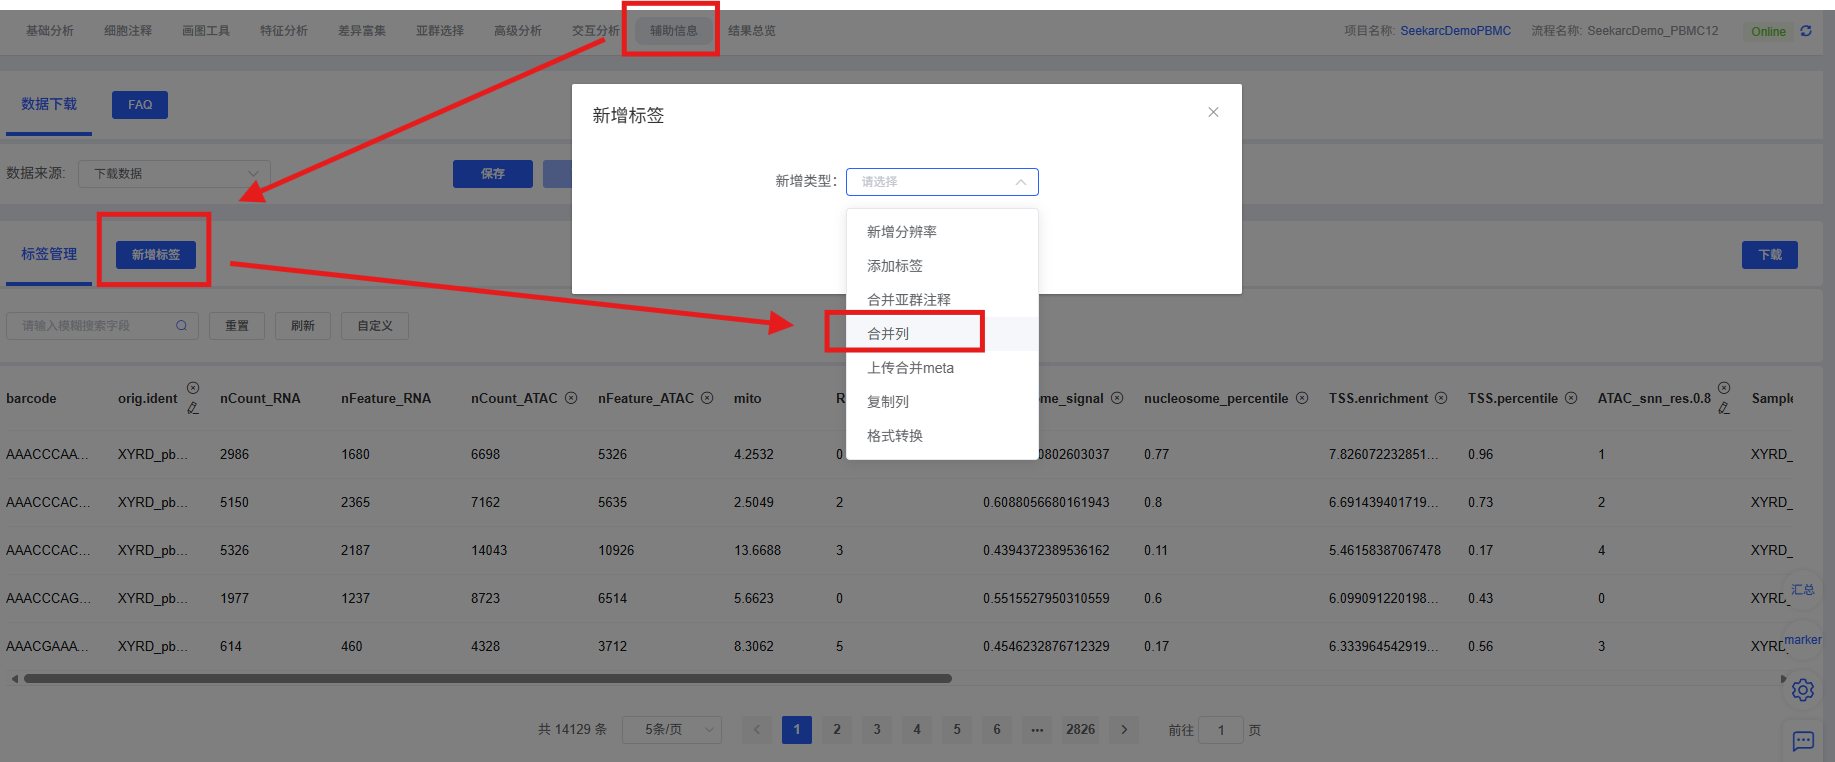
- Click [Auxiliary Information] - scroll down to [Label Management] - click [Add Label] - select [Merge Column] from the dropdown and confirm.
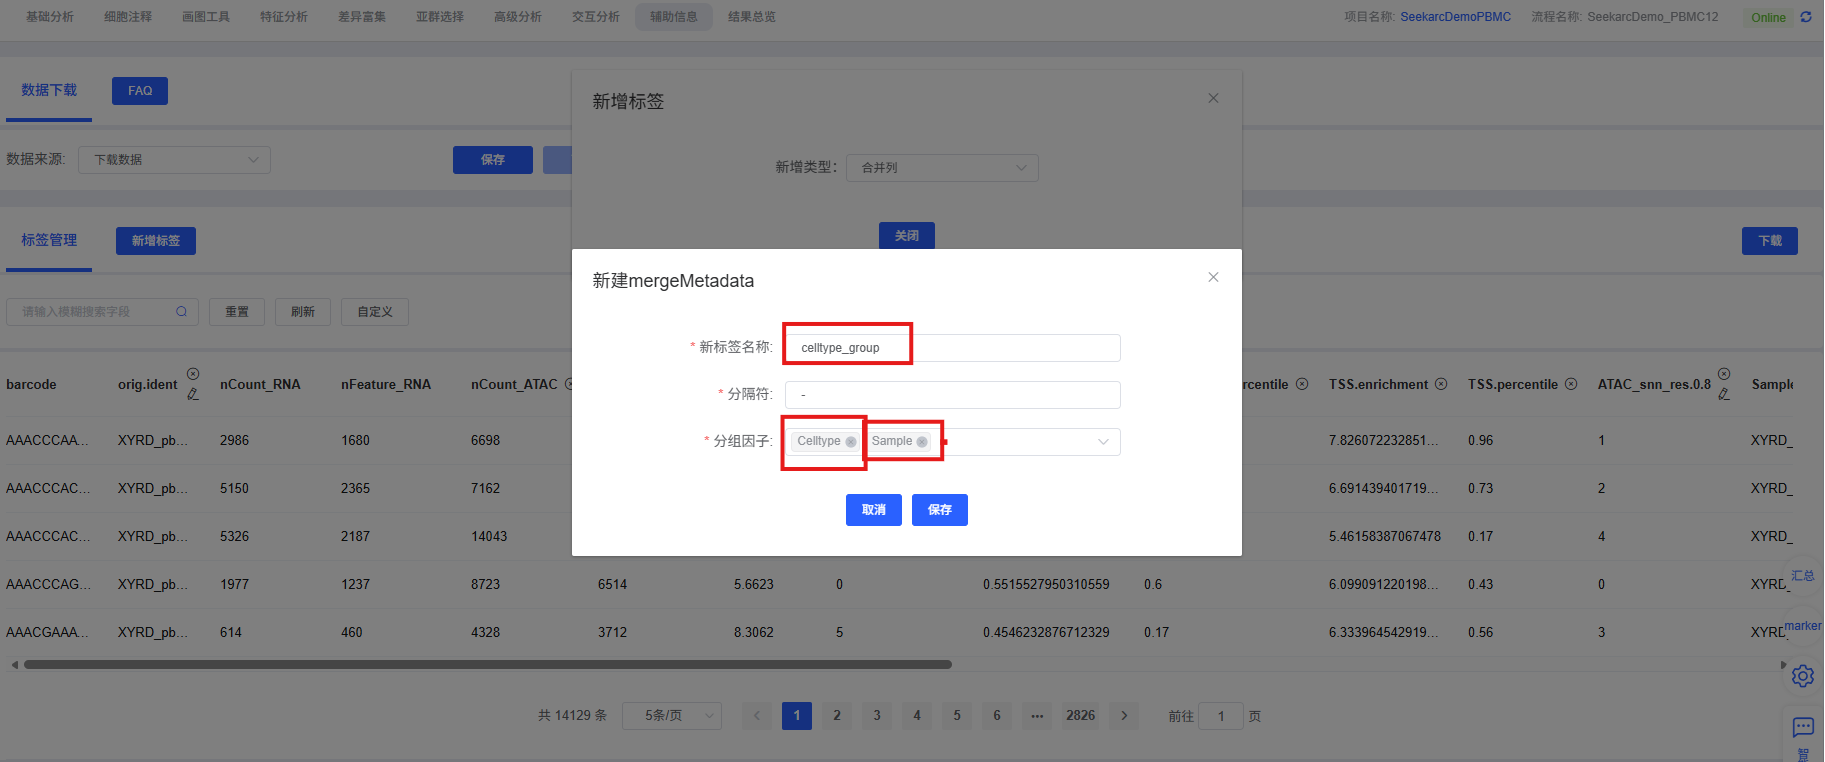
- A mergeMetadata form will appear. Fill in the information as required. Note that when filling in [Grouping Factor], select the column names corresponding to the cell annotation result and group information (e.g., celltype, group), which indicates merging these two columns into one.
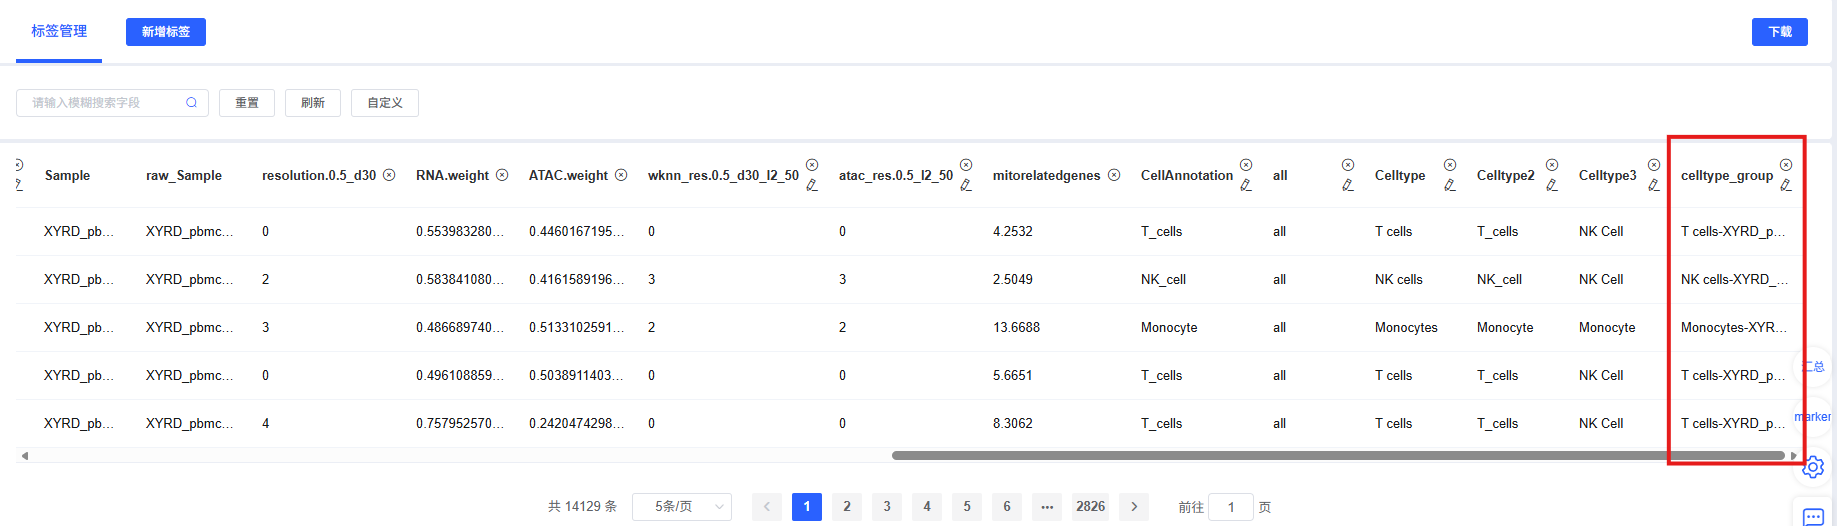
- The last column is the newly added merged column. When running the above modules and wanting to view information within groups, you can use this merged column for cell type-related parameters.
References
[1] STUART T, SRIVASTAVA A, MADAD S, et al. Single-cell chromatin state analysis with Signac[J]. Nature methods, 2021, 18(11): 1333-1341.
[2] GRANJA J M, KLEMM S, MCGEOUGH L J, et al. Single-cell multiomic analysis identifies regulatory programs in mixed-phenotype acute leukemia[J]. Nature biotechnology, 2019, 37(12): 1458-1465.
[3] PLINER H A, PACKER J S, MCFALINE-FIGUEROA J L, et al. Cicero predicts cis-regulatory DNA interactions from single-cell chromatin accessibility data[J]. Molecular cell, 2018, 71(5): 858-871.