Processing
Expression Library Analysis
NOTE
SeekSpace™ Tools uses the SeekSoul™ Tools rna module to analyze spatial transcriptomics expression libraries. For detailed algorithm description, see SeekSoul™ Tools.
R1 structure of spatial transcriptomics expression library:

Cell Determination
Compared to SeekSoul™ Tools, SeekSpace™ Tools defaults to using the "forceCell" method in the cell determination process. It defaults to extracting the top 80000 cells by UMI count and uses min_umi of 200 as the default threshold, filtering cells with UMI counts greater than this threshold as the final determined cells to generate the expression matrix.
Spatial Positioning
Extract Spatial Tags and Position Information
There are two libraries related to spatial position: Spatial Library and HDMI Library.
Spatial Library
The R1 structure of the spatial library is consistent with the expression library. The R2 structure is as follows:

For spatial library R1, the SeekSoul™ Tools rna module is also used for cell barcode correction and UMI extraction. Then, spatial barcodes are extracted on R2, and the correspondence between cell tags (cell barcode) and spatial tags (spatial barcode) is generated. Unlike the meaning represented by UMI in the expression library, the UMI (spatial UMI) in the spatial library represents the expression level of each spatial tag on each cell tag.
- HDMI Library The HDMI library is single-end sequencing. Each Read contains a 32-base spatial barcode, and each spatial barcode corresponds to position information. We use the spatial barcode extracted from the spatial library as a whitelist and use the SeekSoul™ Tools rna module to correct the spatial barcode of the HDMI library, while extracting the spatial coordinates corresponding to the spatial barcode.
Filtering
- In the spatial barcodes extracted from the spatial library, there may be some invalid barcodes. These invalid barcodes may be caused by mixing short mRNA fragments in the expression library. Since these fragments do not exist in the HDMI library, they cannot provide corresponding position information. In addition to the factors mentioned above, sequencing errors can also generate invalid barcodes. To ensure data accuracy, we filtered these invalid spatial barcodes and excluded them from the analysis.
- In the HDMI library, some spatial barcodes may appear multiple times, and each time they appear, they may carry different position information. Since we cannot determine the exact spatial position of these spatial barcodes, these spatial barcodes will be filtered out.
- For some spatial barcodes, we observed that their corresponding UMI support counts were abnormally high. We speculate that this may be because these spatial barcodes detached from the chip during experimental operations and were encapsulated by droplets. This part of spatial barcodes is considered inaccurate. To filter out these incorrect spatial barcodes, we took the following steps:
- Divide the position on the chip into multiple bins of size 30x30.
- Count the UMI support number of spatial barcodes in each bin.
- Sort bins in descending order of UMI support number.
- Calculate the threshold based on the distribution of sorted bins.
- If the UMI support number in a bin exceeds the threshold, we will remove all spatial barcodes corresponding to the cell barcode with the most UMI support in that bin.
- Finally, we will filter out all non-cell cell barcodes and their corresponding spatial barcodes, locating only biologically meaningful cells.
Cell Position Determination
When determining the center position of a cell, we must consider the existence of some noisy spatial barcodes. These spatial barcodes may exist as background in droplets during the experiment, or mark on the debris of cell nuclei, causing them to be marked as the same cell tag as other cell nuclei in the droplet. This situation leads to multiple center positions on the chip. Therefore, we need to filter cells with multiple centers on the chip to ensure that cells with clearly defined center positions are retained.
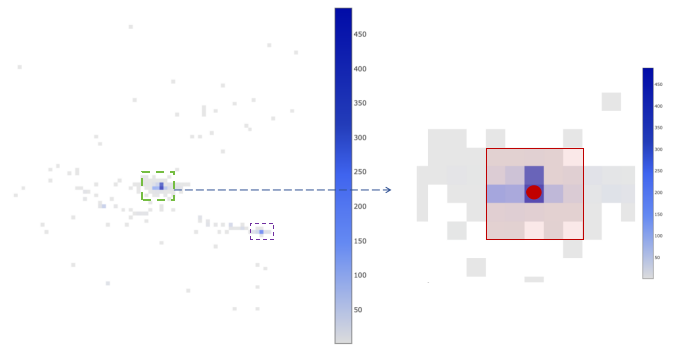
In the left figure, a schematic diagram of the distribution of a cell's spatial barcode in space is shown, where each grid represents a bin. The size of each bin is about 100 pixels, equivalent to 26.5 microns. The color in the figure represents the UMI support number of the spatial barcode in each bin, and darker colors indicate higher support numbers.
The right figure is a magnified view of the image in the green box in the left figure. The bin where the red dot is located represents the bin with the highest UMI support number in the cell, defined as the center of the cell. The red box includes the center bin and the surrounding 24 bins, constituting the core of the cell. To judge whether the cell is multi-center, we need to find the sub-center. The sub-center is defined as the bin with the highest UMI support number not in the core. We calculate the ratio of the total number of UMIs in the core to the total number of UMIs in the sub-center and the surrounding 24 bins. If the ratio is greater than or equal to 2, the cell is considered to have a unique center point. For other cells, we consider them to have multiple center points, so these cells are excluded.
Finally, using the spatial barcode distribution in the cell core, we can determine the position of the cell in the chip space.
After the above processing, there are the following data indicators:
- Total Spatial Reads: Number of Reads in the spatial library, representing all Reads obtained by sequencing.
- Valid Spatial Reads: Number of valid spatial Reads, referring to the number of Reads where R1 barcode does not need correction or is successfully corrected, and R2 has a length of at least 32 bases.
- Total Spatial UMIs: Total number of spatial UMIs, representing the number of UMIs obtained after deduplication by extracting cell barcode, spatial barcode and UMI from valid Reads.
- Spatial barcode Saturation: Spatial library saturation. 1 - Total Spatial UMIs / Valid Spatial Reads.
- Valid Spatial UMIs: Number of valid spatial UMIs, referring to the UMI support number of the remaining spatial barcodes after excluding invalid spatial barcodes.
- Spatial UMIs with Unique Locations: The proportion of UMI support number of spatial barcodes with unique positions to valid spatial UMIs.
- Accurate Spatial UMIs: The proportion of UMI support number of accurate spatial barcodes to valid spatial UMIs.
- Accurate Spatial UMI Bins: The proportion of bins with accurate spatial barcodes to total bins.
- Cell-Identified Spatial UMIs: Spatial UMIs related to cells. The proportion of UMI support number of spatial barcodes carried on cell barcodes determined as cells to accurate spatial UMIs.
- Mean Spatial UMIs per Cell: Average spatial UMI number per cell, spatial UMI number related to cells divided by the number of determined cells.
Tissue Image Recognition
- SeekSpace™ Tools identifies tissue images and extracts cells covered by tissues based on image processing algorithms for subsequent analysis. It can receive DAPI stained and DAPI-registered HE stained images. The input image is scaled and Gaussian blurred, and processed using image processing algorithms in OpenCV to finally achieve separation of tissue and background. Throughout the processing, the aspect ratio of the image remains consistent with the original image.
- If the tissue image and the cell area do not completely overlap, SeekSpace™ Tools provides a manual alignment function. Through the manual alignment function, the tissue image can be uniformly scaled, translated and rotated. After alignment, the image adjustment parameters can be downloaded and re-input into SeekSpace™ Tools to generate a new background image to ensure accurate correspondence between the tissue image and the cell area.
Subsequent Analysis
After the above steps, and obtaining the expression matrix of cells covered by tissue, we can proceed to the next analysis.
Seurat Analysis Workflow
Use Seurat to calculate mitochondrial content, total UMI count in cells, and total gene count in cells. Then normalize the matrix, find highly variable genes, reduce dimensionality and cluster, and then find differential genes.