
ATAC_Monocle3 Analysis Documentation
Introduction
TIP
ATAC_Monocle3 is a pseudotime analysis tool for single-cell ATAC-seq data, used to reconstruct cell development or differentiation trajectories.
ATAC_Monocle3 analysis reveals the dynamic patterns of chromatin accessibility, transcription factor binding activity, and gene expression by ordering cells along implicit biological process trajectories in high-dimensional space. Unlike traditional RNA-seq pseudotime analysis, ATAC_Monocle3 is based on chromatin accessibility data, analyzing the molecular mechanisms of cell fate determination from the perspective of epigenetic regulation.
Core Functions
- Chromatin accessibility dynamics analysis: Detect differentially accessible peaks that significantly change along pseudotime
- Transcription factor activity dynamics analysis: Track changes in chromVAR-inferred motif activity patterns along trajectories
- Gene expression dynamics analysis: Identify genes with differential expression along pseudotime
- Multi-omics integrated visualization: Integrate dynamic changes across Peak, Motif, and RNA levels into a unified heatmap framework
- Transcription factor-specific analysis: Focus on expression dynamics of transcription factor subpopulations to identify key regulatory factors
Theoretical Foundation
Core Principles
ATAC_Monocle3 is based on the Monocle3 algorithm framework, reconstructing cell development trajectories through the following steps:
- Dimensionality reduction embedding: Project high-dimensional chromatin accessibility data into low-dimensional space (UMAP)
- Graph learning: Learn principal graph structures between cell states in the dimensionality-reduced space
- Pseudotime ordering: Calculate pseudotime values for each cell starting from a specified root cell population
- Multi-modal dynamic detection: Use generalized linear models (GLM) and spatial autocorrelation tests to identify molecular features that significantly change along pseudotime
Key Algorithms
- Graph learning algorithm: Monocle3 uses DDRTree or UMAP-based graph learning algorithms to construct cell state transition graphs in dimensionality-reduced space
- Differential analysis:
- Peak differential analysis: Generalized linear model based on bin aggregation (
fit_models) - RNA differential analysis: Spatial autocorrelation test based on principal graph topology (
graph_test) - Motif differential analysis: chromVAR activity change detection based on linear regression
- Peak differential analysis: Generalized linear model based on bin aggregation (
- Smoothing matrix construction: Generate continuous signal curves along pseudotime through local weighted averaging
Cloud Platform Operation Guide
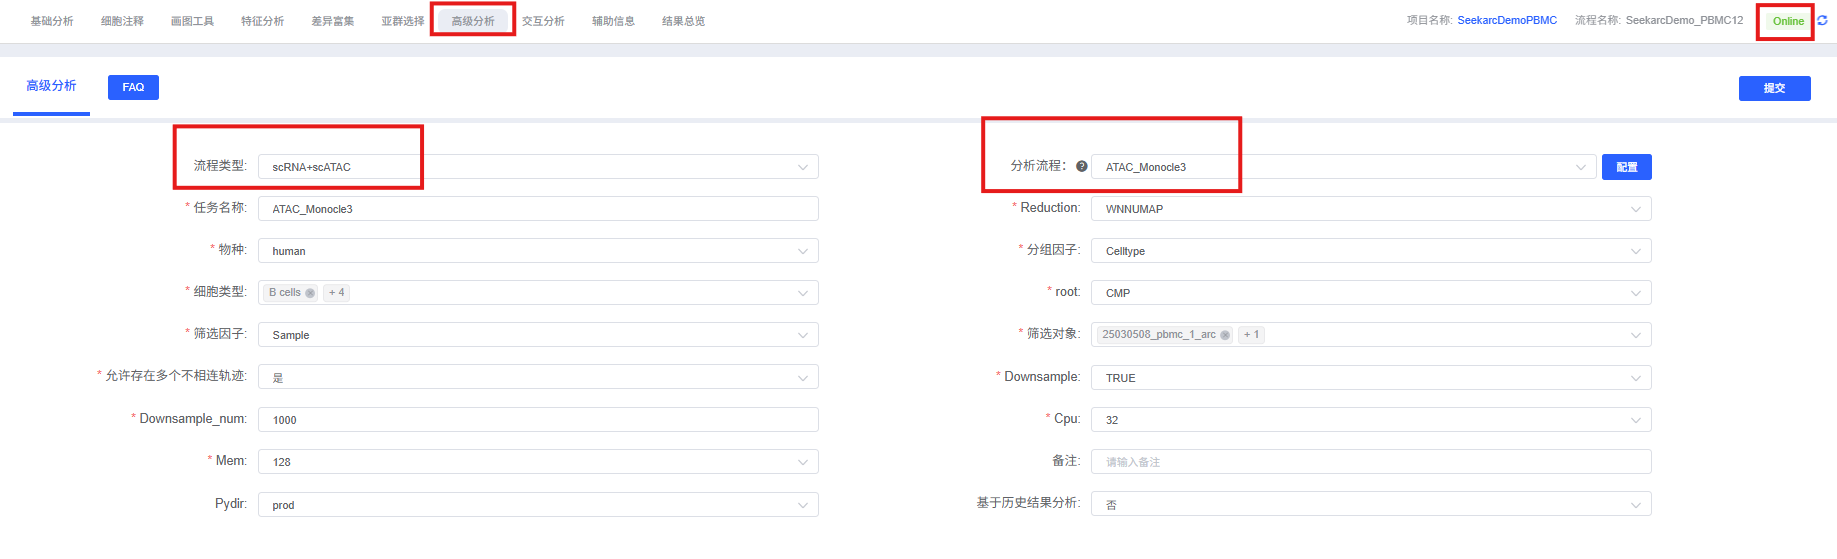
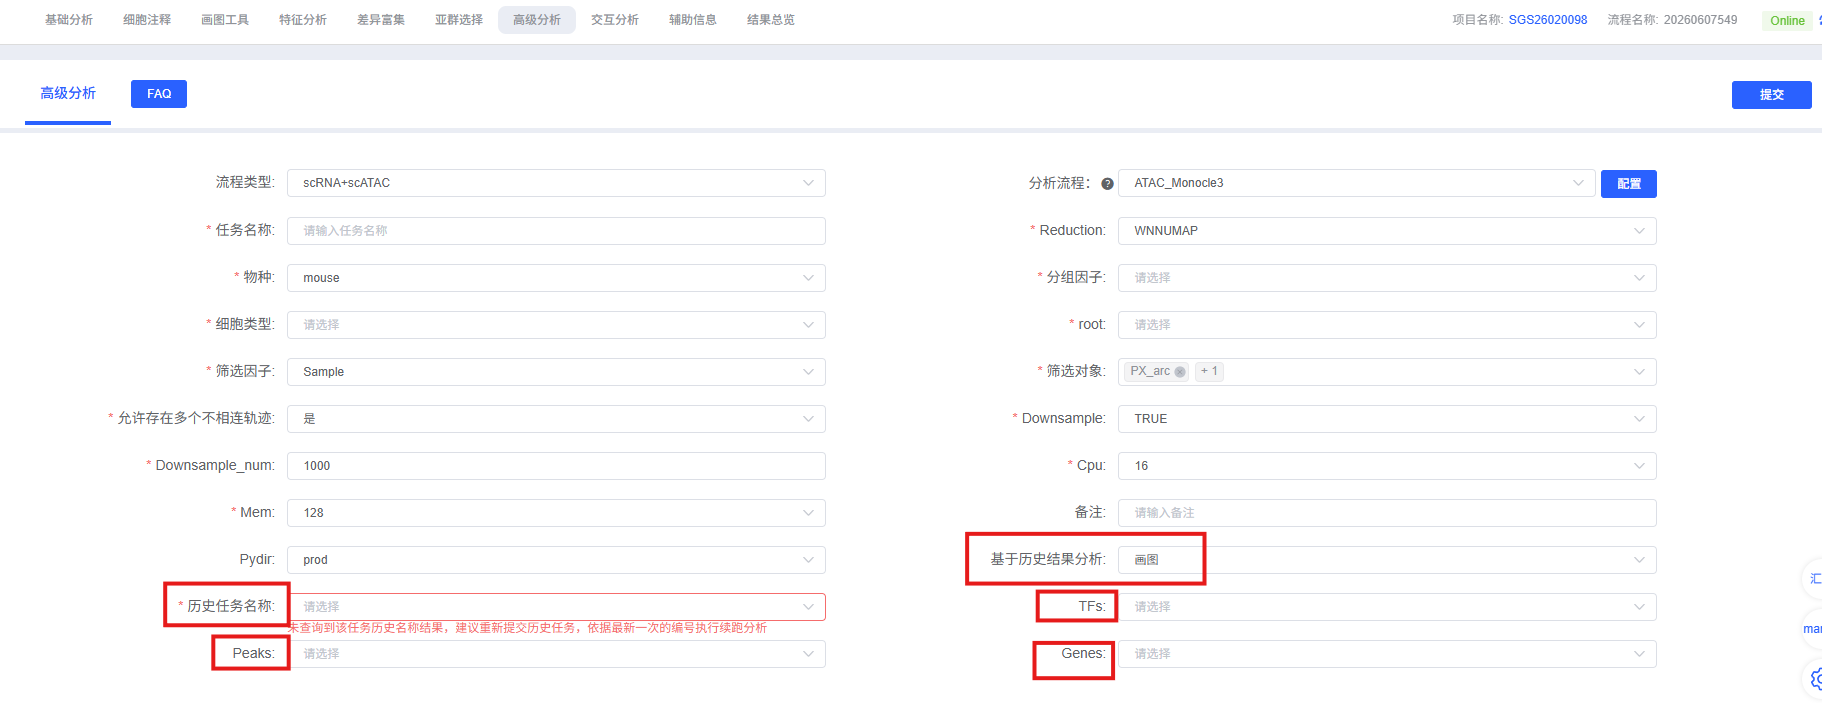
On the cloud platform, the ATAC_Monocle3 analysis workflow is designed to be intuitive and user-friendly. You don't need to write code; you can complete the analysis simply through the parameter configuration interface.
Pre-Analysis Preparation
TIP
The success of ATAC_Monocle3 analysis largely depends on the quality of input data and root cell selection. Before starting the analysis, please ensure:
- Data preprocessing is complete: Your single-cell ATAC data has undergone standard quality control, dimensionality reduction (PCA, UMAP), clustering, and cell type annotation.
- Appropriate cell subpopulation selected: Pseudotime analysis should be performed on cell subpopulations with potential differentiation or transition relationships. It is meaningless to analyze biologically unrelated cells together.
- Clear biological starting point: This is the most critical step in ATAC_Monocle3 analysis. You must clearly identify which cell population represents the starting state of the process you are studying (such as stem cells, progenitor cells, etc.) based on known biological knowledge.
Parameter Details
The table below lists the main parameters of the ATAC_Monocle3 analysis module on the cloud platform and their descriptions.
| Interface Parameter | Description |
|---|---|
| Task Name | The name of this analysis task, must start with an English letter, can contain English letters, numbers, underscores, and Chinese characters. |
| Root Type | Select the label corresponding to the cell type or cluster to analyze, such as the cell annotation group celltype. This parameter is used in conjunction with "Root Node" and "Cell Types". |
| Root Node | Core parameter. Select progenitor cells or pre-developmental cell types in the cell development process, such as CMP cells. |
| Cell Types | Multiple selection, select all cell types to include in pseudotime analysis. |
| Dimensionality Reduction Method | Select the dimensionality reduction embedding method for trajectory inference, options include "UMAP", "ATACUMAP", "WNNUMAP" (case-insensitive). |
| Species | Select the species corresponding to the data, used for motif analysis and gene functional enrichment analysis. Currently the platform supports Human and Mouse. |
| Downsample | Logical value, select whether to downsample cells (randomly extract a subset of cells) before analysis. Suitable for ultra-large-scale datasets, can significantly improve computational speed. |
| Downsample_num | Integer, if Downsample is enabled, this parameter specifies the maximum number of cells to retain for each cell type. |
| Partition Mode | Logical value, determines whether to allow learning disconnected trajectories in different partitions. Default is allowed, suitable for complex datasets with multiple independent developmental processes. |
Important Notes
TIP
- Root cell selection: The cell type specified by the
rootparameter must exist in thecelltypeslist, otherwise trajectory ordering will fail. Selecting the wrong root cell will reverse the entire pseudotime direction. - Dimensionality reduction method matching: The name of the
Dimensionality Reduction Methodparameter (such as "WNNUMAP") must exactly match the key name inobj@reductionsof the Seurat object (this tool supports case-insensitive matching). - Partition mode: When cells have multiple disconnected developmental branches,
Partition Mode = TRUEwill automatically divide the data into independent partitions for separate learning. If forced toPartition Mode = FALSE, Monocle3 will try to connect all cells into a single graph, potentially leading to unreasonable cross-lineage connections.
Operation Workflow
- Enter analysis module: Navigate to the "Advanced Analysis" module on the cloud platform, select "ATAC_Monocle3".
- Create new task: Name your analysis task and select the sample or project to analyze.
- Configure parameters: According to the above guidelines, select the cell types to analyze and be sure to accurately specify the starting point of the trajectory.
- Submit task: After confirming parameters are correct, click the "Submit" button and wait for analysis to complete.
- View results: After analysis is complete, view the generated analysis report and result files in the task list.
Result Interpretation
1. Trajectory Visualization
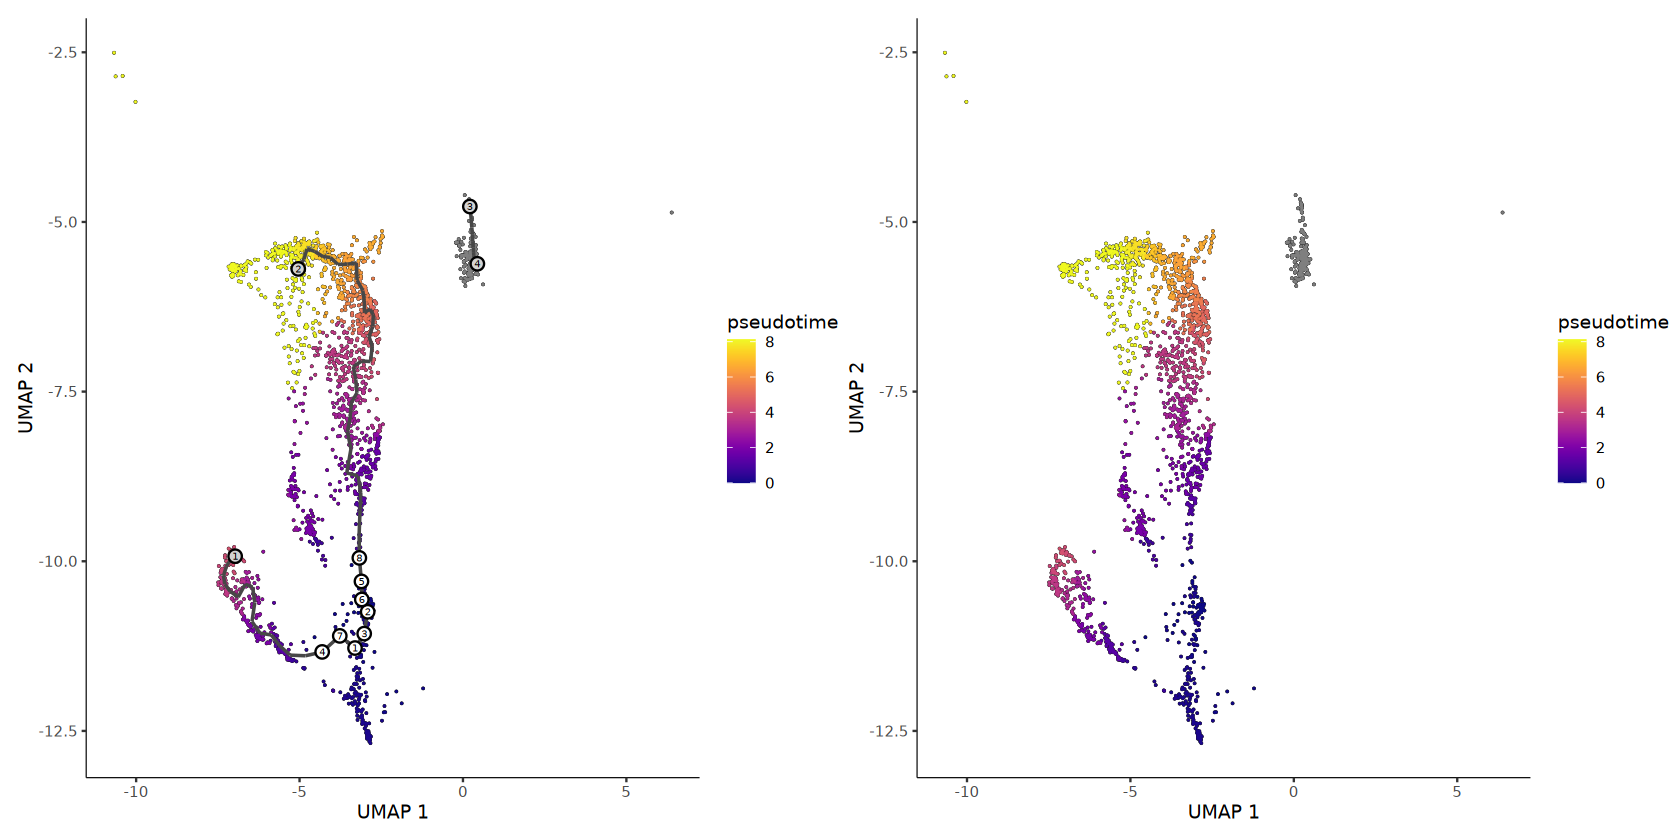
ATAC_Monocle3 generates two types of trajectory visualization plots to help verify the rationality of trajectory inference:
1.1 Pseudotime Plot
Plot Interpretation
- Left panel: Displays pseudotime gradient + trajectory skeleton, colored lines represent learned cell state transition paths
- Right panel: Displays only pseudotime gradient, colors from purple (starting point) to yellow (endpoint) represent developmental progress
Analysis Points
- Check if the trajectory direction is consistent with the expected developmental sequence
- Observe if trajectory branch points correspond to known fate determination nodes
- Verify if root cells are located at the beginning of the trajectory
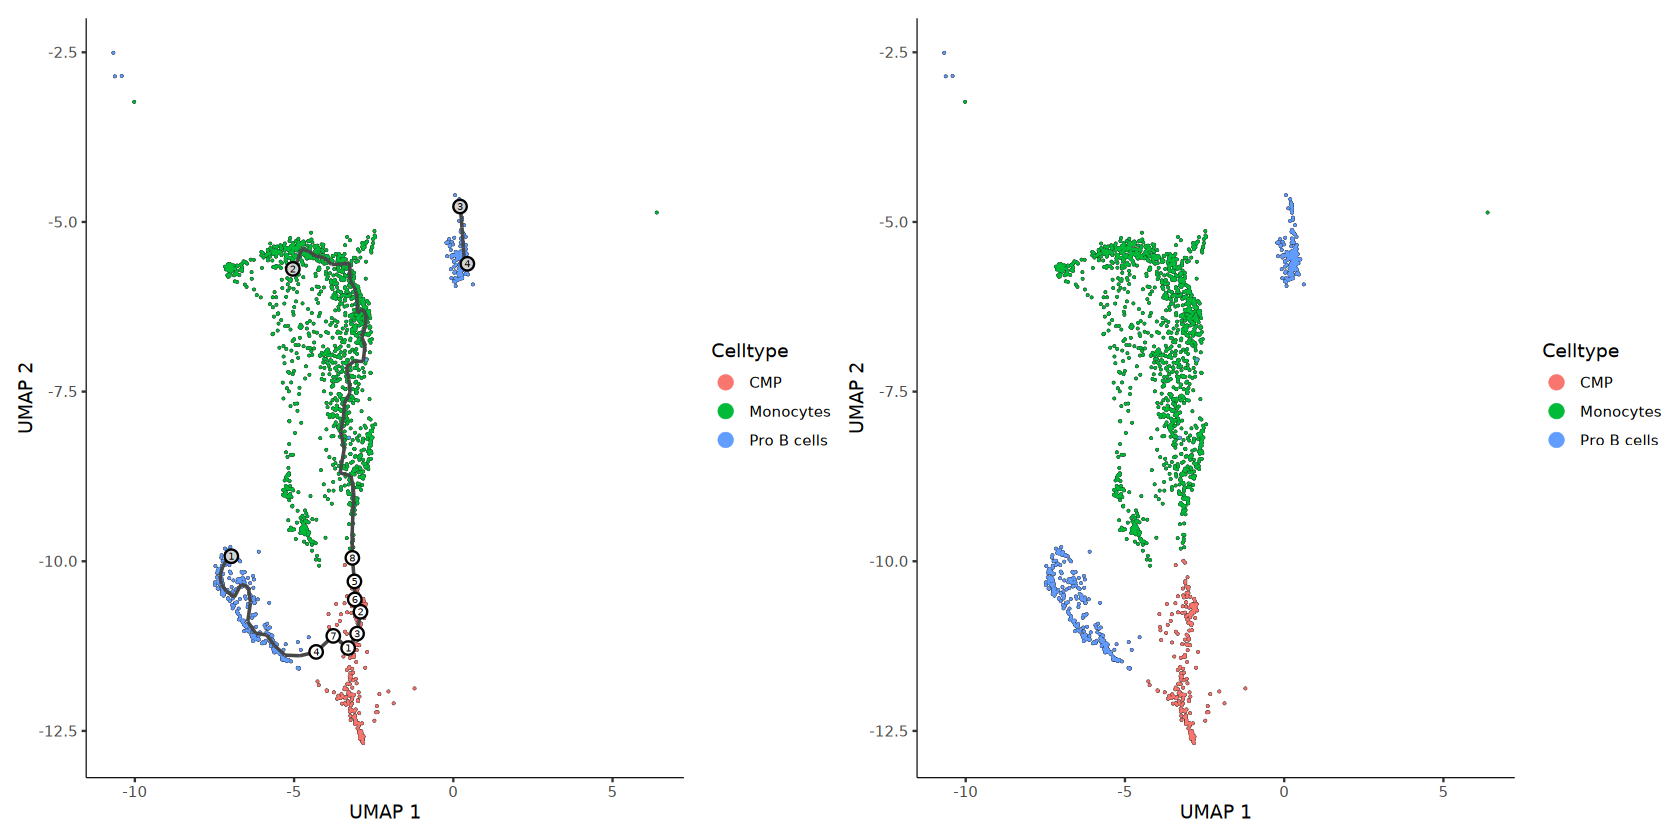
1.2 Cell Type Plot
Plot Interpretation
- Left panel: Displays cell type distribution + trajectory skeleton
- Right panel: Displays only cell type distribution
Analysis Points
- Compare pseudotime plot and cell type plot to verify if the distribution of different cell types on the trajectory conforms to developmental logic
- Check if intermediate state cells are located in the transition regions of the trajectory
2. Differential Peak Analysis
2.1 Top Changing Peak Scatter Plot
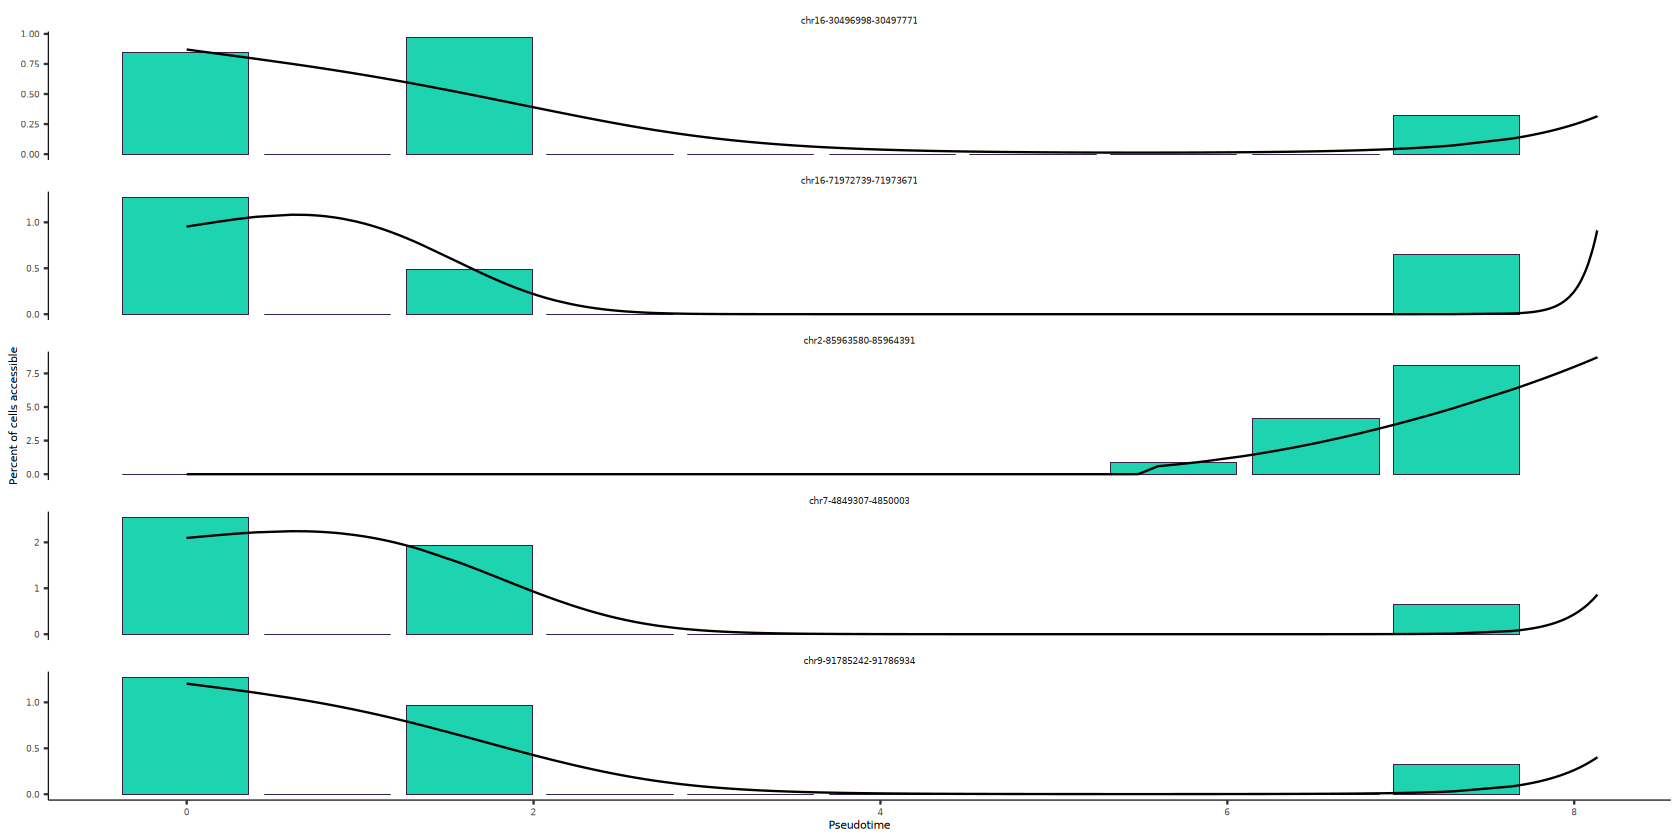
Plot Interpretation
This plot displays the 5 most significantly increasing accessibility sites along pseudotime, used to observe the dynamic pattern of "progressive chromatin opening":
- X-axis (pseudotime): Represents the relative progress of cells from start to end along the trajectory
- Y-axis (accessibility): Represents the accessibility intensity of the corresponding peak
- Trend judgment: If the overall curve rises with pseudotime, it indicates that this site is progressively activated during development
Analysis Points
- Sites with steeper rises and higher endpoint levels often suggest stronger stage-specific opening signals
- The genomic regions corresponding to these peaks may contain key cis-regulatory elements (such as development-specific enhancers)
3. Multi-omics Dynamic Heatmaps
ATAC_Monocle3 generates three types of heatmaps, displaying the dynamic changes of RNA, Motif, and Peak along pseudotime respectively:
3.1 RNA Expression Heatmap
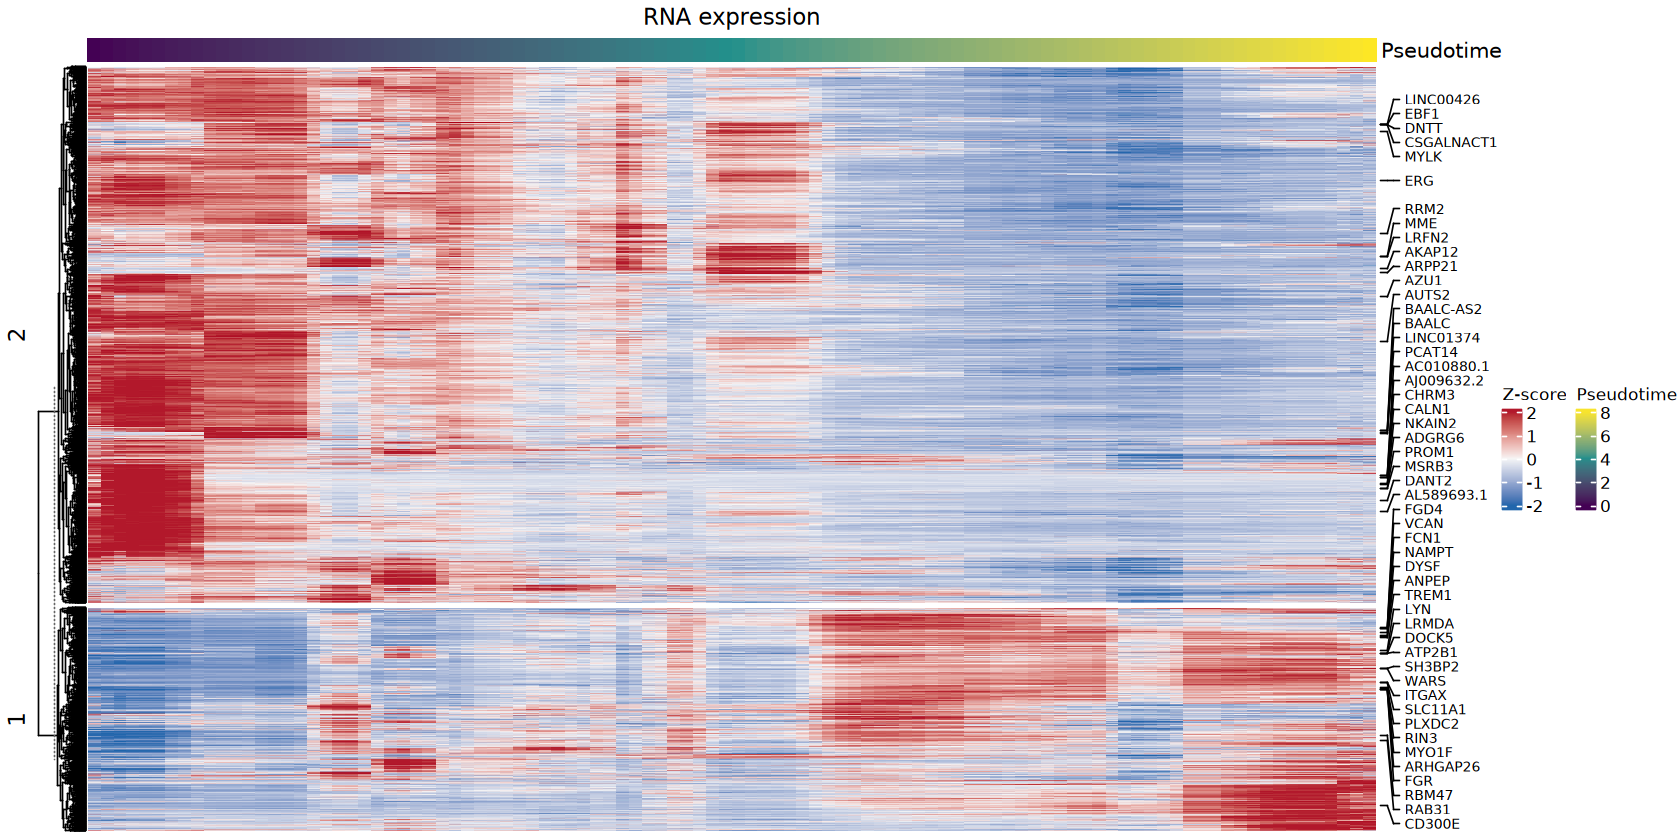
Plot Interpretation
- Color mapping: Red indicates high expression, blue indicates low expression, white indicates medium level
- Top annotation bar: Displays the gradient process of pseudotime from start (purple) to end (yellow)
- Row clustering: The heatmap automatically divides genes into two clusters—the upper cluster typically rises with pseudotime (late activation), the lower cluster decreases with pseudotime (early activation then exit)
- Right labels: Labels the top 50 gene names with the largest magnitude of change
3.2 Motif Activity Heatmap
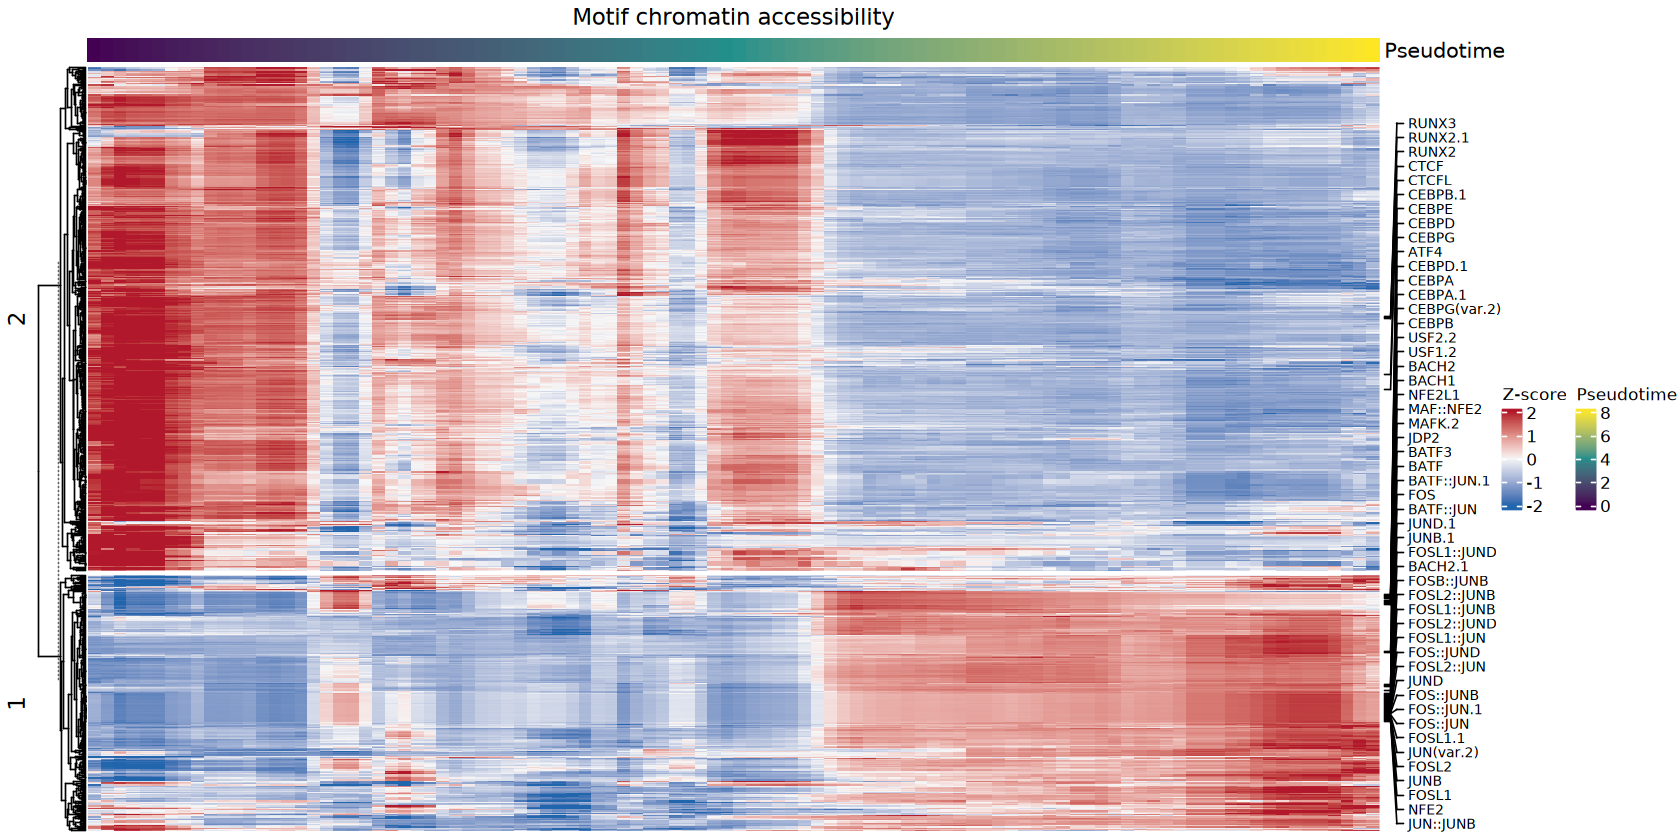
Plot Interpretation
- Displays dynamic changes in transcription factor binding activity along pseudotime
- Motif IDs are mapped to readable transcription factor names (such as STAT1, GATA1, etc.)
- Right labels show the top 50 motifs with the largest magnitude of change
Analysis Points
- Comparing RNA heatmap and Motif heatmap can determine if changes in transcription factor expression are consistent with changes in their binding activity
- If expression and activity changes are inconsistent, it may suggest regulation occurs at the post-transcriptional level
3.3 Peak Accessibility Heatmap
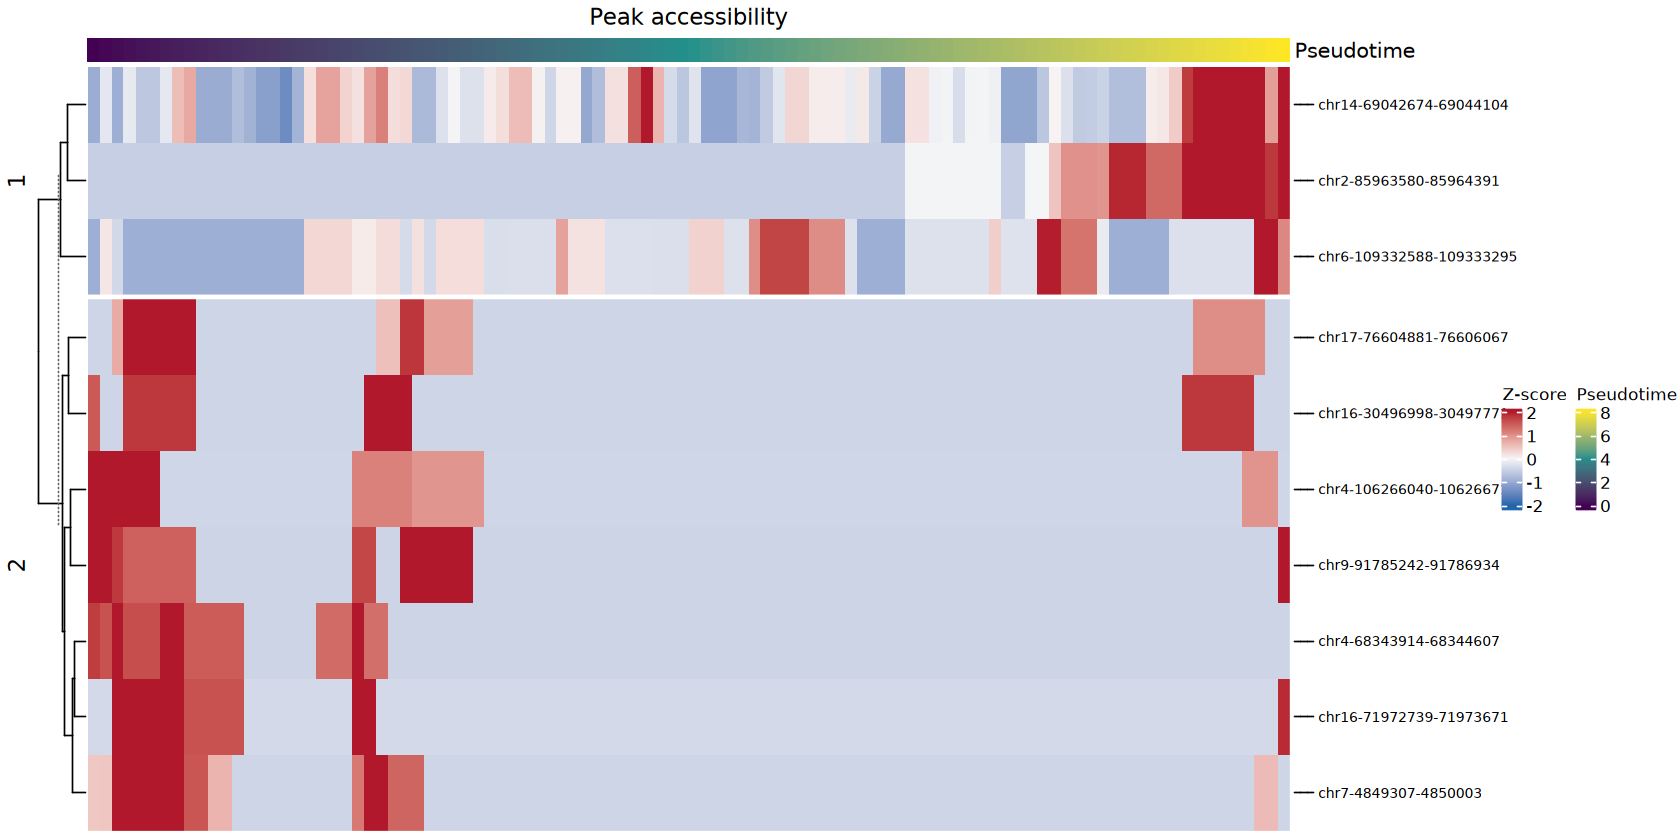
Plot Interpretation
- Displays dynamic changes in chromatin accessibility status along pseudotime
- Right labels show the top 50 peaks with the largest magnitude of change
4. Top 10 Feature Scatter Plots
To observe the dynamic change patterns of individual features in more detail, ATAC_Monocle3 extracts the top 10 most significantly changing features from each category and plots scatter plots along pseudotime.
4.1 Top 10 RNA Features
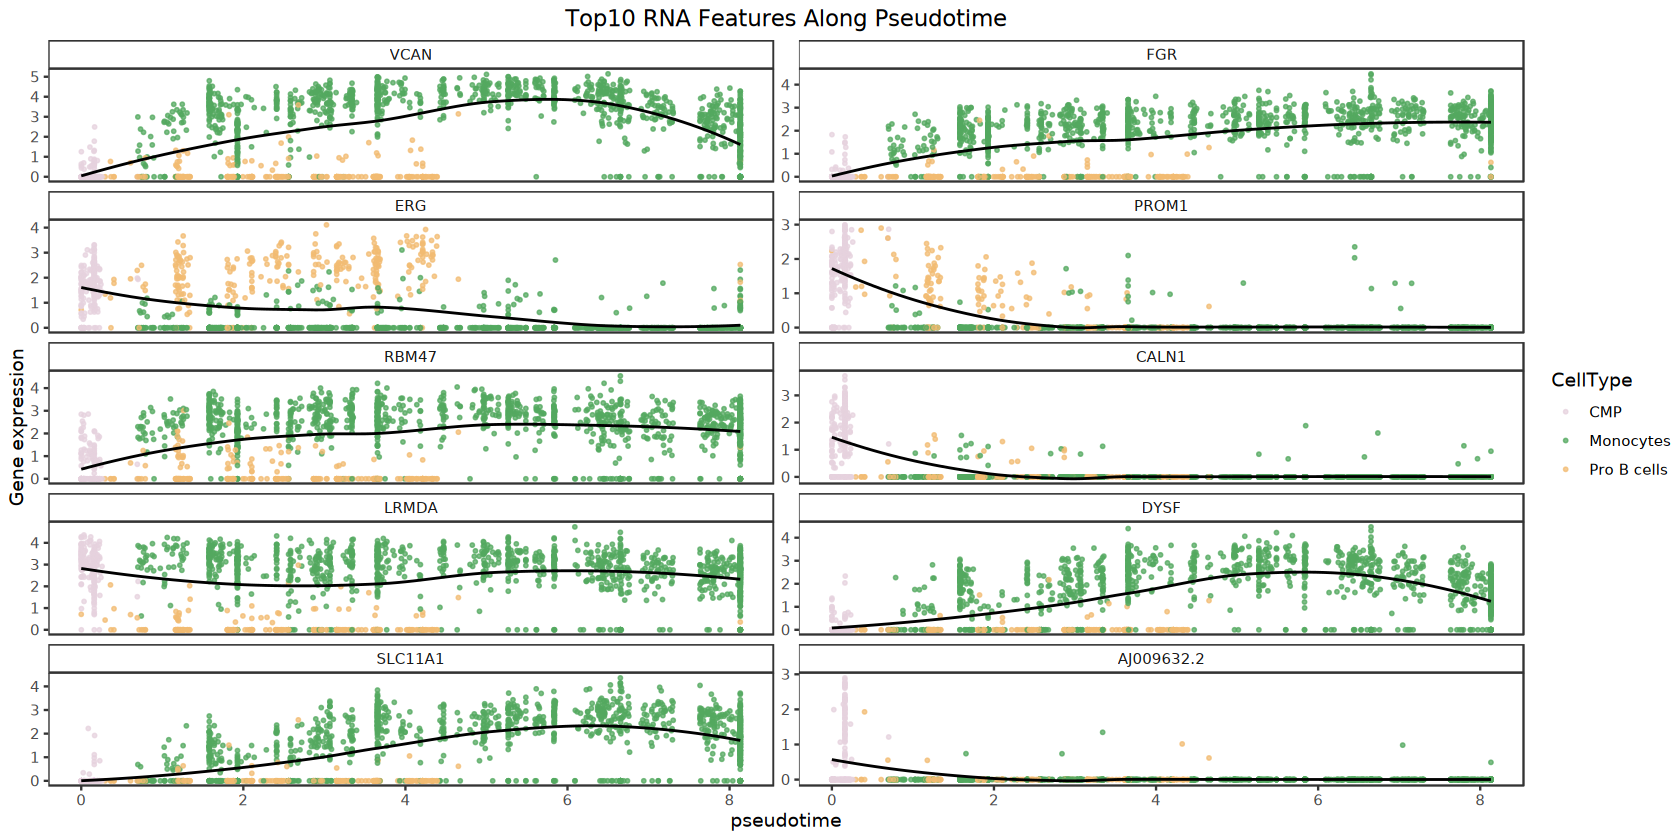
Plot Interpretation
- Each panel corresponds to one gene
- Scatter colors: Colored by cell type
- Black smoothing curve: LOESS-fitted trend line showing overall direction of change
Analysis Points
- By observing the shape and steepness of the curve, you can determine whether the gene is early-activated, late-activated, or transiently expressed
4.2 Top 10 Motif Features
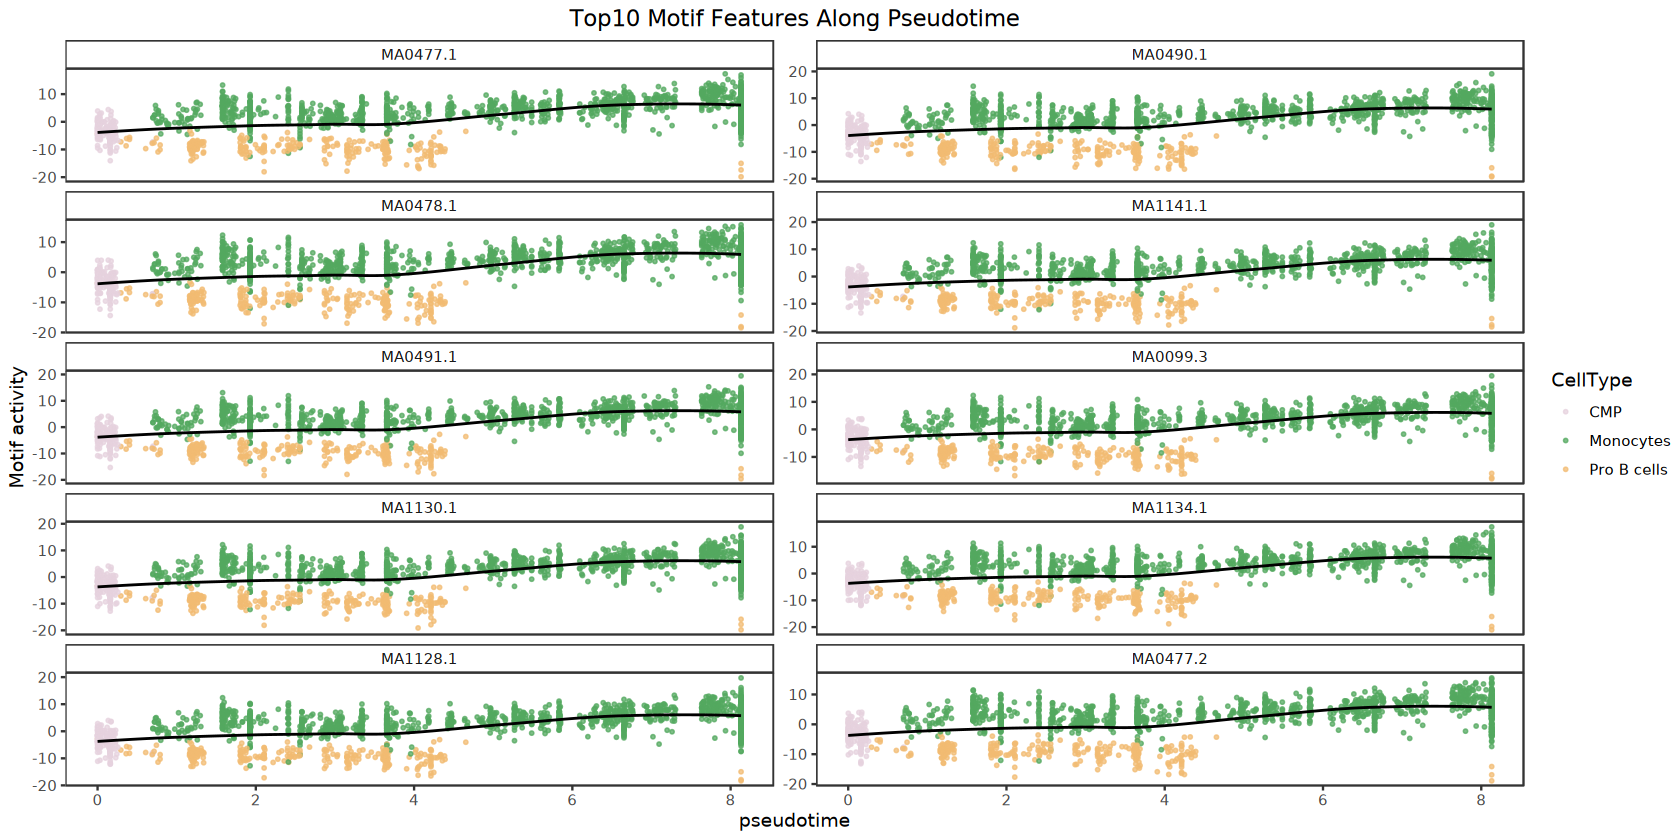
Plot Interpretation
- Each panel corresponds to a transcription factor's motif
- Displays dynamic changes in transcription factor binding activity
4.3 Top 10 Peak Features
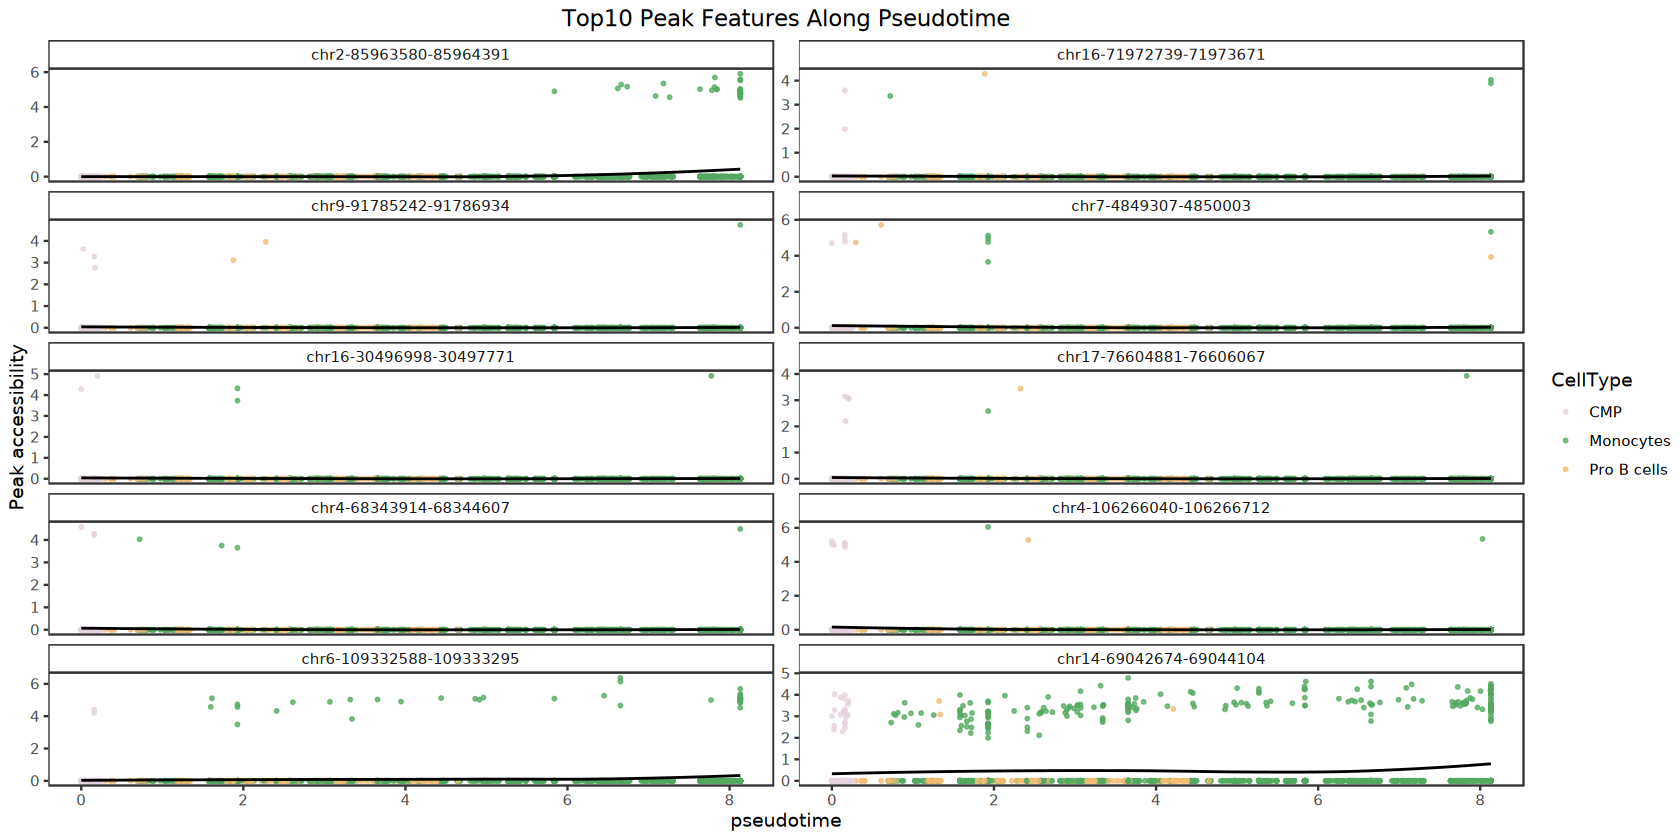
Plot Interpretation
- Each panel corresponds to a chromatin accessibility region
- Displays dynamic changes in peak accessibility
5. Transcription Factor-Specific Analysis
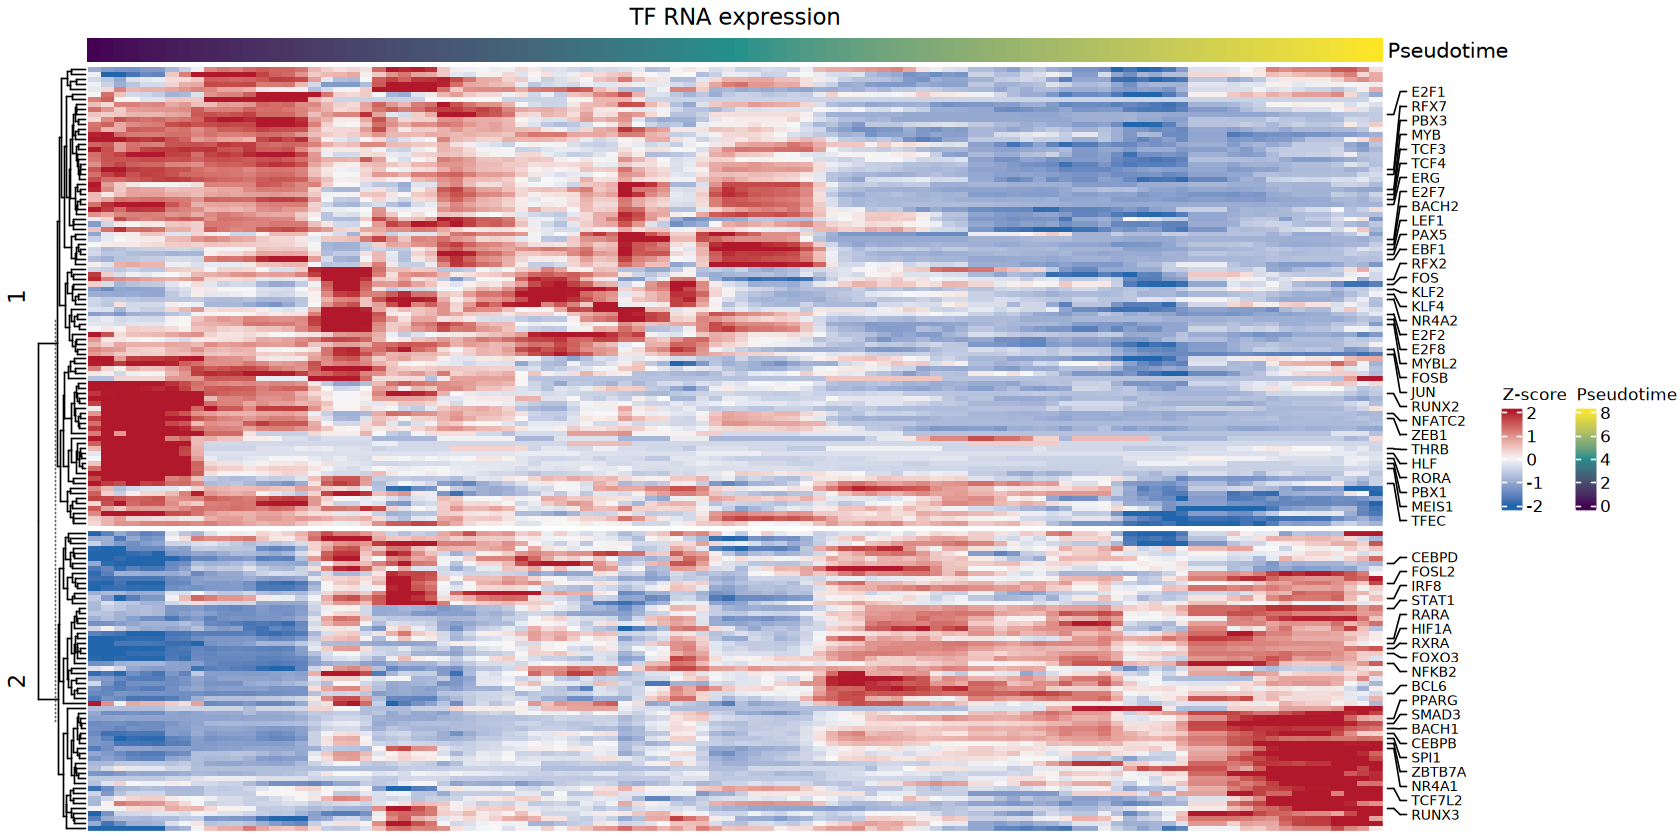
Plot Interpretation
- Focuses on the special category of transcription factors
- Only genes meeting both conditions simultaneously will appear in this heatmap: (1) significantly differentially expressed along pseudotime at the RNA level; (2) gene name exists in known transcription factor databases
Biological Significance
- If a TF's expression significantly changes along pseudotime, it suggests it may play a stage-specific regulatory role in the differentiation process
- TFs with high early expression may initiate differentiation programs, while TFs with high late expression may maintain terminal states
Important Notes
1. Importance of root cell selection: Root cell selection directly affects the direction and biological interpretation of pseudotime. Please ensure the selected root cell is a biologically reasonable developmental starting point (such as stem cells, progenitor cells).
2. Cell subpopulation selection: Pseudotime analysis should be performed on cell subpopulations with potential differentiation or transition relationships. Analyzing biologically unrelated cells together will lead to meaningless trajectories.
3. Dimensionality reduction method matching: If the dimensionality reduction methods provided by the platform (UMAP, ATACUMAP, WNNUMAP) do not match your data, please generate the corresponding dimensionality reduction results in the preprocessing step first.
4. Use of partition mode: When data contains multiple independent developmental processes, it is recommended to enable partition mode. Forcing all cells to connect into a single graph may lead to unreasonable cross-lineage connections.
5. Caution in result interpretation: Pseudotime analysis provides the relative order of cell state transitions, not absolute time. Biological conclusions need to be validated in combination with other experimental evidence.
Frequently Asked Questions (FAQ)
Q1: Why is the trajectory direction inconsistent with expectations?
A: The most common reason is inappropriate root cell selection. Please check:
- Whether the root cell is truly the developmental starting point
- Whether the root cell is in the "Cell Types" list
- Whether you need to try different dimensionality reduction methods
Q2: What to do if the trajectory has multiple disconnected branches?
A: This is a normal phenomenon, indicating the presence of multiple independent developmental processes in the data. Recommendations:
- Enable partition mode (
Partition Mode = TRUE) - Or independently analyze different developmental processes separately
Q3: Motif heatmap and RNA heatmap results are inconsistent?
A: This suggests transcriptional regulation may occur at the post-transcriptional level. Possible reasons include:
- Transcription factor protein activity is regulated by post-translational modifications
- Transcription factor nuclear localization is regulated
- Transcription factors need to form complexes with other factors to function
Q4: How to choose a dimensionality reduction method?
A:
- UMAP: Suitable for most situations, balances computational speed and trajectory quality
- ATACUMAP: Dimensionality reduction method specifically optimized for ATAC data
- WNNUMAP: Weighted nearest neighbor dimensionality reduction, integrates multi-omics information, suitable for multi-omics data
Q5: What is the difference between q_value and p_value in analysis results?
A:
- p_value: Raw statistical significance, without considering multiple testing correction
- q_value: p-value corrected by Benjamini-Hochberg, controlling false discovery rate (FDR)
- Typically use q_value < 0.05 as the significance threshold
Methods
ATAC_Monocle3 Methods Download
References
[1] Cao J, Spielmann M, Qiu X, et al. The single-cell transcriptional landscape of mammalian organogenesis. Nature, 2019, 566(7745): 496-502.
[2] Pliner HA, Packer JS, McFaline-Figueroa JL, et al. Cicero predicts cis-regulatory DNA interactions from single-cell chromatin accessibility data. Molecular Cell, 2018, 71(5): 858-871.
[3] Schep AN, Wu B, Buenrostro JD, et al. chromVAR: inferring transcription-factor-associated accessibility chromatin using single-cell data. Genome Biology, 2017, 18: 180.