
Single-cell scATAC-seq & scRNA-seq Dual-omics Advanced Analysis: SCENIC+ Regulatory Network Analysis
Introduction
TIP
SCENIC+ (Single-Cell Regulatory Network Inference and Clustering Plus) is a transcriptional regulatory network inference framework that integrates scRNA-seq and scATAC-seq data. Its core advantage lies in utilizing chromatin accessibility information to constrain the inference of TF-target gene relationships, significantly reducing false positive connections compared to the traditional SCENIC method, and constructing complete regulatory networks of "transcription factor → cis-regulatory element → target gene."
In single-cell multi-omics research, inferring TF-target gene relationships based solely on gene co-expression often results in a large number of false positives. SCENIC+ integrates chromatin accessibility information from scATAC-seq, jointly validating TF regulatory relationships from two independent omics levels (RNA expression + ATAC accessibility), greatly improving the reliability of regulatory networks. The platform automatically completes the entire workflow from pycisTopic topic modeling, cisTarget database construction, regulatory network inference to eRegulon quality assessment and visualization.
Core Functions of SCENIC+
Regulatory Network Inference Combining dual evidence from gene co-expression (RNA) and chromatin accessibility (ATAC), infer regulatory relationships between transcription factors and target genes, constructing high-confidence eRegulon (extended Regulon).
eRegulon Quality Assessment and Filtering Through multi-dimensional indicators such as TF expression-AUC correlation and Gene-based and Region-based AUC consistency, automatically filter high-quality regulatory relationships and eliminate false positive connections.
Regulon Specificity Score (RSS) Calculate the specificity enrichment degree of each eRegulon in various cell types, identify cell type-specific regulatory factors, and help analyze the regulatory logic of cell fate determination.
Multi-modal Joint Visualization Perform UMAP/t-SNE dimensionality reduction based on eRegulon AUC matrices, map TF expression, Gene AUC, and Region AUC to the same base map, and provide combined heatmap-dot plot displays to comprehensively present the structure and dynamics of regulatory networks.
This document aims to provide single-cell multi-omics researchers with a detailed SCENIC+ technical guide, covering its basic principles, operation methods on the SeekSoul Online cloud platform, result interpretation, and common issues, helping you quickly master and apply this tool.
SCENIC+ Theoretical Foundation
Core Principles
The core idea of SCENIC+ analysis is: Using chromatin accessibility information from scATAC-seq as independent evidence to constrain the inference of TF-target gene relationships, retaining only regulatory connections supported at both RNA and ATAC omics levels, thereby significantly improving the accuracy and interpretability of regulatory networks.
From SCENIC to SCENIC+
The traditional SCENIC method infers regulatory networks based solely on scRNA-seq data and has the following limitations:
- Gene co-expression may reflect indirect regulation or technical noise
- Lacks independent validation at the epigenetic level
- The inferred regulons have a high false positive rate
SCENIC+ solves these problems by introducing scATAC-seq data:
- Cis-regulatory elements: Identify open regions near TF binding sites from ATAC data
- eRegulon: Associate TF, regulatory elements (Region), and target genes (Gene) as a complete regulatory unit
- Dual validation: Regulatory relationships are retained only when TF target genes show co-expression at the RNA level and their binding regions show accessibility at the ATAC level
Complete Analysis Workflow of SCENIC+
SCENIC+ analysis includes 5 main steps:
- Data Conversion (step0): Convert RNA and ATAC counts matrices from Seurat objects to AnnData (h5ad) format
- pycisTopic Topic Modeling (step1): Perform LDA topic modeling on scATAC data to identify co-accessible region modules
- cisTarget Database Construction (step2): Build motif scoring database based on consensus regions
- Regulatory Network Inference (step3): Integrate RNA + ATAC evidence to infer TF-regulatory element-target gene relationships
- Post-processing and Visualization (step4): eRegulon quality assessment, filtering, RSS calculation, and multi-modal visualization
Key Algorithms and Workflows
For each inferred eRegulon, SCENIC+ performs the following key validations:
- TF expression-AUC correlation: Calculate the Pearson correlation between TF RNA expression level and its eRegulon AUC activity score, filtering out regulatory relationships with significant positive or negative correlations
- Gene-based and Region-based AUC consistency: Require high correlation of AUC scores at both gene expression and chromatin accessibility levels for the same eRegulon, ensuring regulatory relationships are supported at both omics levels
- Target gene count filtering: Remove eRegulons with too few target genes, retaining high-quality regulatory units with sufficient information
Cloud Platform Operation Guide
On the cloud platform, the SCENIC+ analysis workflow is designed to be intuitive and user-friendly. The platform automatically completes all computational steps from pycisTopic topic modeling, cisTarget database construction to regulatory network inference. Users only need to configure basic parameters to view results.
Pre-Analysis Preparation
TIP
SCENIC+ analysis has high requirements for input data. Before starting the analysis, please ensure:
- Data preprocessing is complete: Your single-cell ATAC and RNA data have undergone standard quality control, dimensionality reduction, clustering, and cell type annotation.
- Dual-omics data is complete: Ensure the input Seurat object contains both RNA and ATAC Assays, otherwise multi-omics joint inference cannot be performed.
- Species information is correct: SCENIC+ needs to match the correct motif database (human/mouse), please confirm the species parameter is consistent with the data.
- Sufficient cell count: SCENIC+ has certain requirements for cell count. Too few cells may lead to unstable regulatory network inference.
Parameter Details
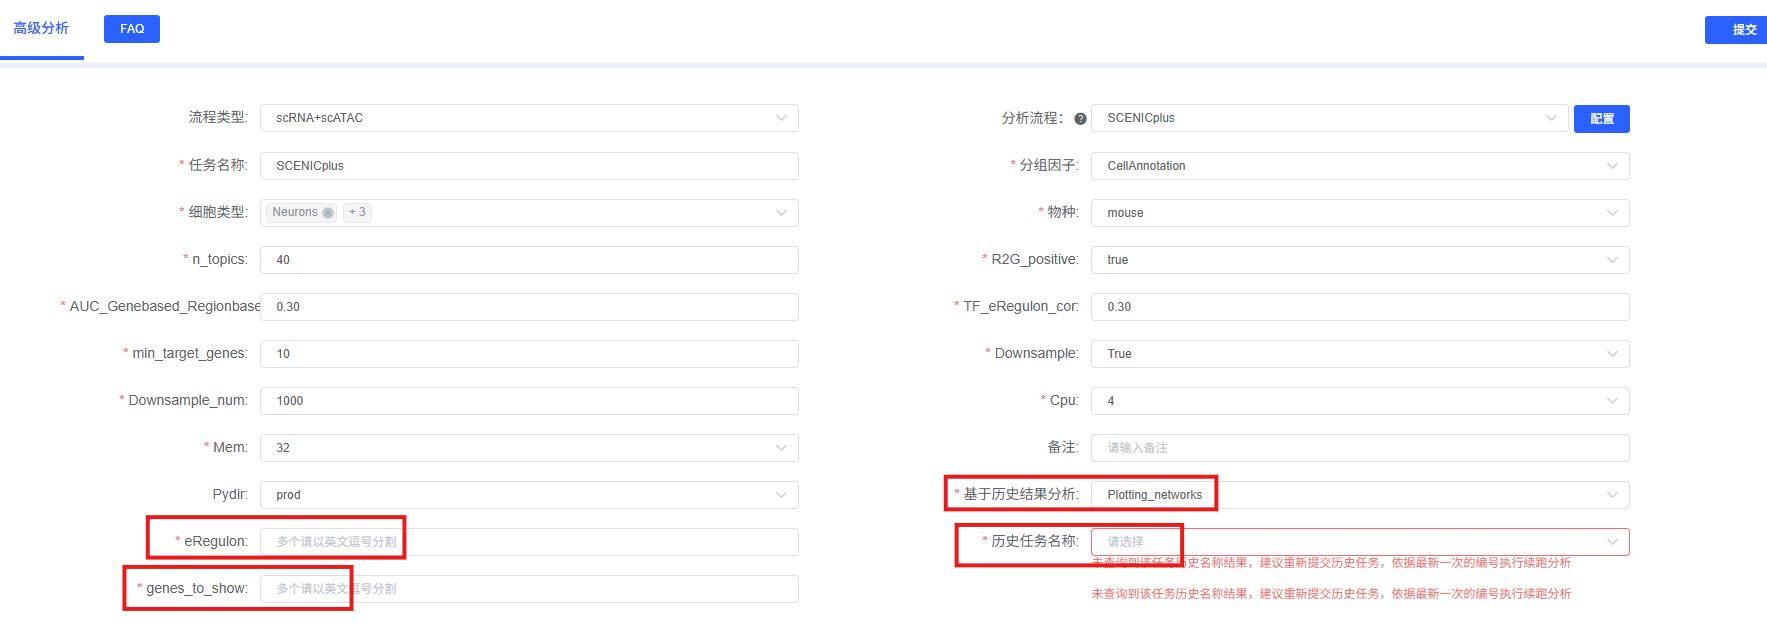
The table below lists the main parameters of the SCENIC+ analysis module on the cloud platform and their descriptions.
| Parameter Name | Description |
|---|---|
| Task Name | The name of this analysis task, must start with an English letter, can contain English letters, numbers, underscores, and Chinese characters. |
| Grouping Factor | Cell grouping column name. |
| Cell Types | Cell types to analyze. |
| Filter Factor | Column name of sample information. |
| Filter Object | Sample names to analyze. |
| Species | Species information, used to select the corresponding cisTarget motif database (human or mouse). |
| n_topics | Number of topics for pycisTopic LDA topic modeling, default 40. More topics result in finer co-accessible region modules, but also increase computational load. |
| TF_eRegulon_cor | Absolute value threshold for TF expression and eRegulon AUC correlation, default 0.5. Only eRegulons with correlation above this threshold are retained. |
| AUC_Gene_Region_cor | Minimum threshold for Gene-based and Region-based AUC correlation, default 0.5. Used to filter eRegulons consistent at both omics levels. |
| min_target_genes | Minimum number of target genes for eRegulon, default 10. Filter out low-information regulatory units with too few target genes. |
| Downsample | Whether to downsample cells before analysis to save computational resources, default TRUE. |
| Downsample_num | Downsampling number, maximum number of cells to retain for each cell subgroup, only effective when downsampling is enabled, default 1000. |
Important Notes
TIP
- Data quality requirements: SCENIC+ has high requirements for input data quality. Low-quality ATAC data (such as insufficient TSS enrichment, abnormal fragment length distribution) will directly affect the quality of pycisTopic topic modeling, thereby reducing the accuracy of regulatory network inference.
- Necessity of dual-omics data: The core advantage of SCENIC+ lies in integrating evidence from both RNA and ATAC omics levels. If the input object is missing RNA or ATAC Assay, the analysis cannot proceed or result quality will significantly decrease.
- Computational resource requirements: The complete SCENIC+ workflow (especially step1 pycisTopic and step3 network inference) has high memory and CPU requirements. Downsampling parameters can effectively control resource consumption, but may lose some regulatory information from rare cell subpopulations.
- Species matching: The species parameter directly determines motif database selection. Incorrect species settings will cause motif enrichment analysis to fail or produce unreliable results.
- eRegulon filtering: The platform automatically performs multi-dimensional quality filtering. Overly strict thresholds may retain too few eRegulons; overly lenient thresholds may introduce false positives. It is recommended to use default thresholds first, then adjust based on results.
- RSS interpretation: Regulon Specificity Score (RSS) reflects the relative specificity of eRegulon in each cell type, not absolute activity. High RSS values indicate that the eRegulon has the strongest activity in a specific cell type, but does not mean it has no activity in other cell types.
Operation Workflow
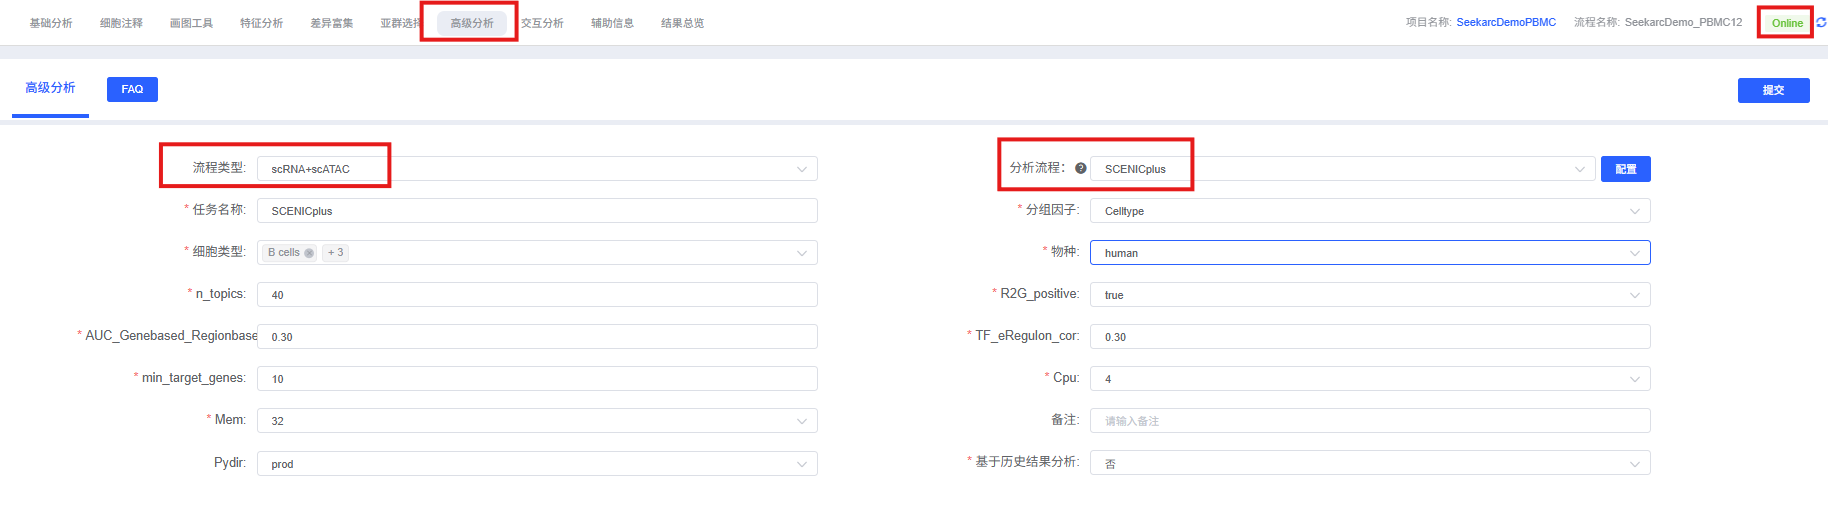
- Enter analysis module: Navigate to the "Advanced Analysis" module on the cloud platform, select "SCENIC+".
- Create new task: Name your analysis task and select the sample or project to analyze.
- Configure parameters: According to the above guidelines, select cell types, species, filtering thresholds, and other parameters.
- Submit task: After confirming parameters are correct, click the "Submit" button and wait for analysis to complete. The complete SCENIC+ workflow usually takes a long time, please be patient.
- View results: After analysis is complete, view the generated analysis report and result files in the task list, including eRegulon quality assessment plots, RSS heatmaps, dimensionality reduction visualizations, etc.
Result Interpretation
SCENIC+ analysis reports contain rich charts and data files. Below is a detailed interpretation of core results.
TF Expression-eRegulon AUC Correlation Scatter Plot
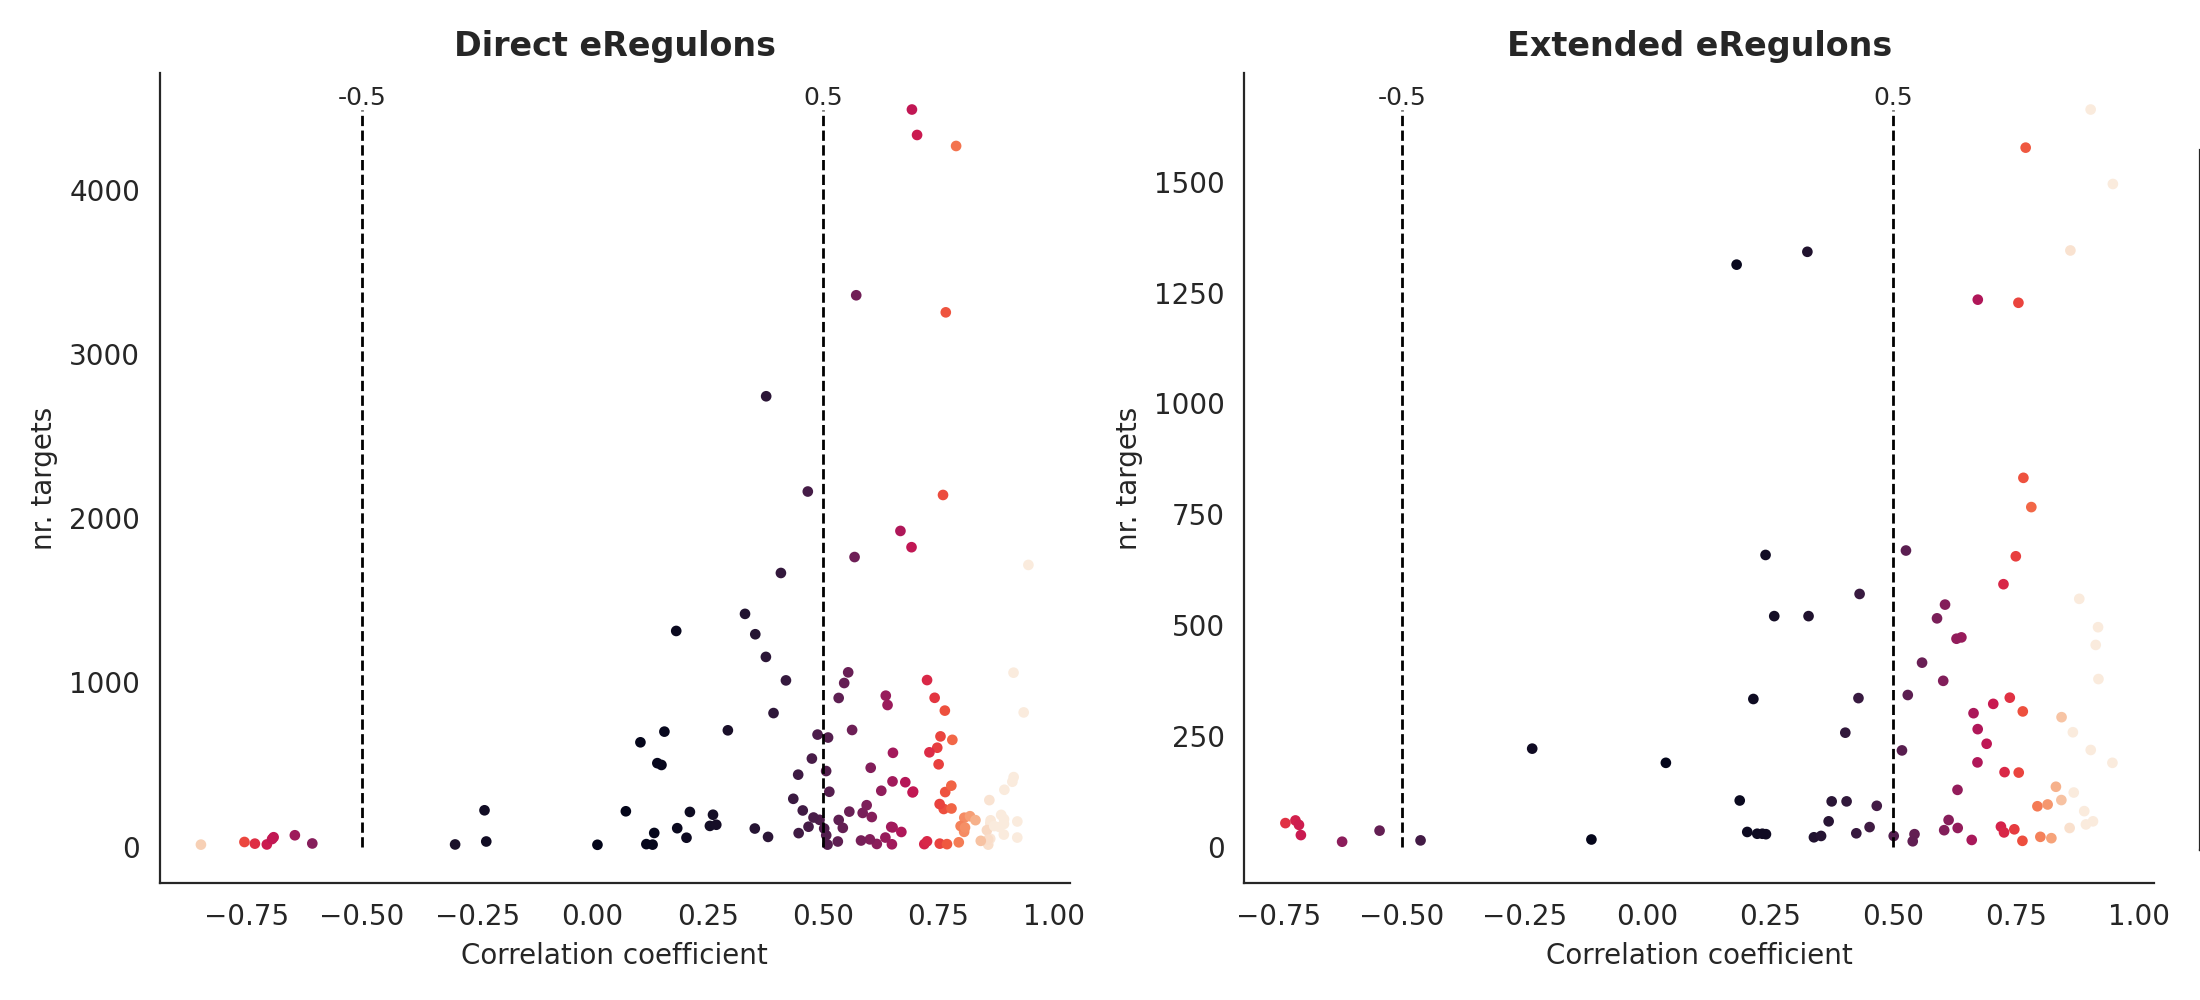
This plot displays the correlation distribution between TF RNA expression level and eRegulon AUC activity score, used to evaluate the reliability of regulatory relationships. Results for both direct and extended eRegulons are shown separately.
Plot Interpretation
- X-axis: TF expression level (pseudobulk mean or normalized value)
- Y-axis: eRegulon AUC activity score
- Color: Identifies eRegulons passing/not passing the correlation threshold (default |cor| > 0.5)
- Scatter distribution: Each point represents an eRegulon. High-correlation points are distributed in the upper-left and lower-right corners (positive/negative correlation), while low-correlation points cluster in the middle
Analysis Points
- Correlation threshold: Only eRegulons with TF expression-AUC correlation absolute value exceeding the threshold are retained, ensuring regulatory relationships have expression-level support.
- Positive vs negative correlation: Positive correlation indicates enhanced target gene activity when TF expression increases (activator regulation), while negative correlation may suggest repressor regulation.
eRegulon Similarity Dual-Panel Heatmap
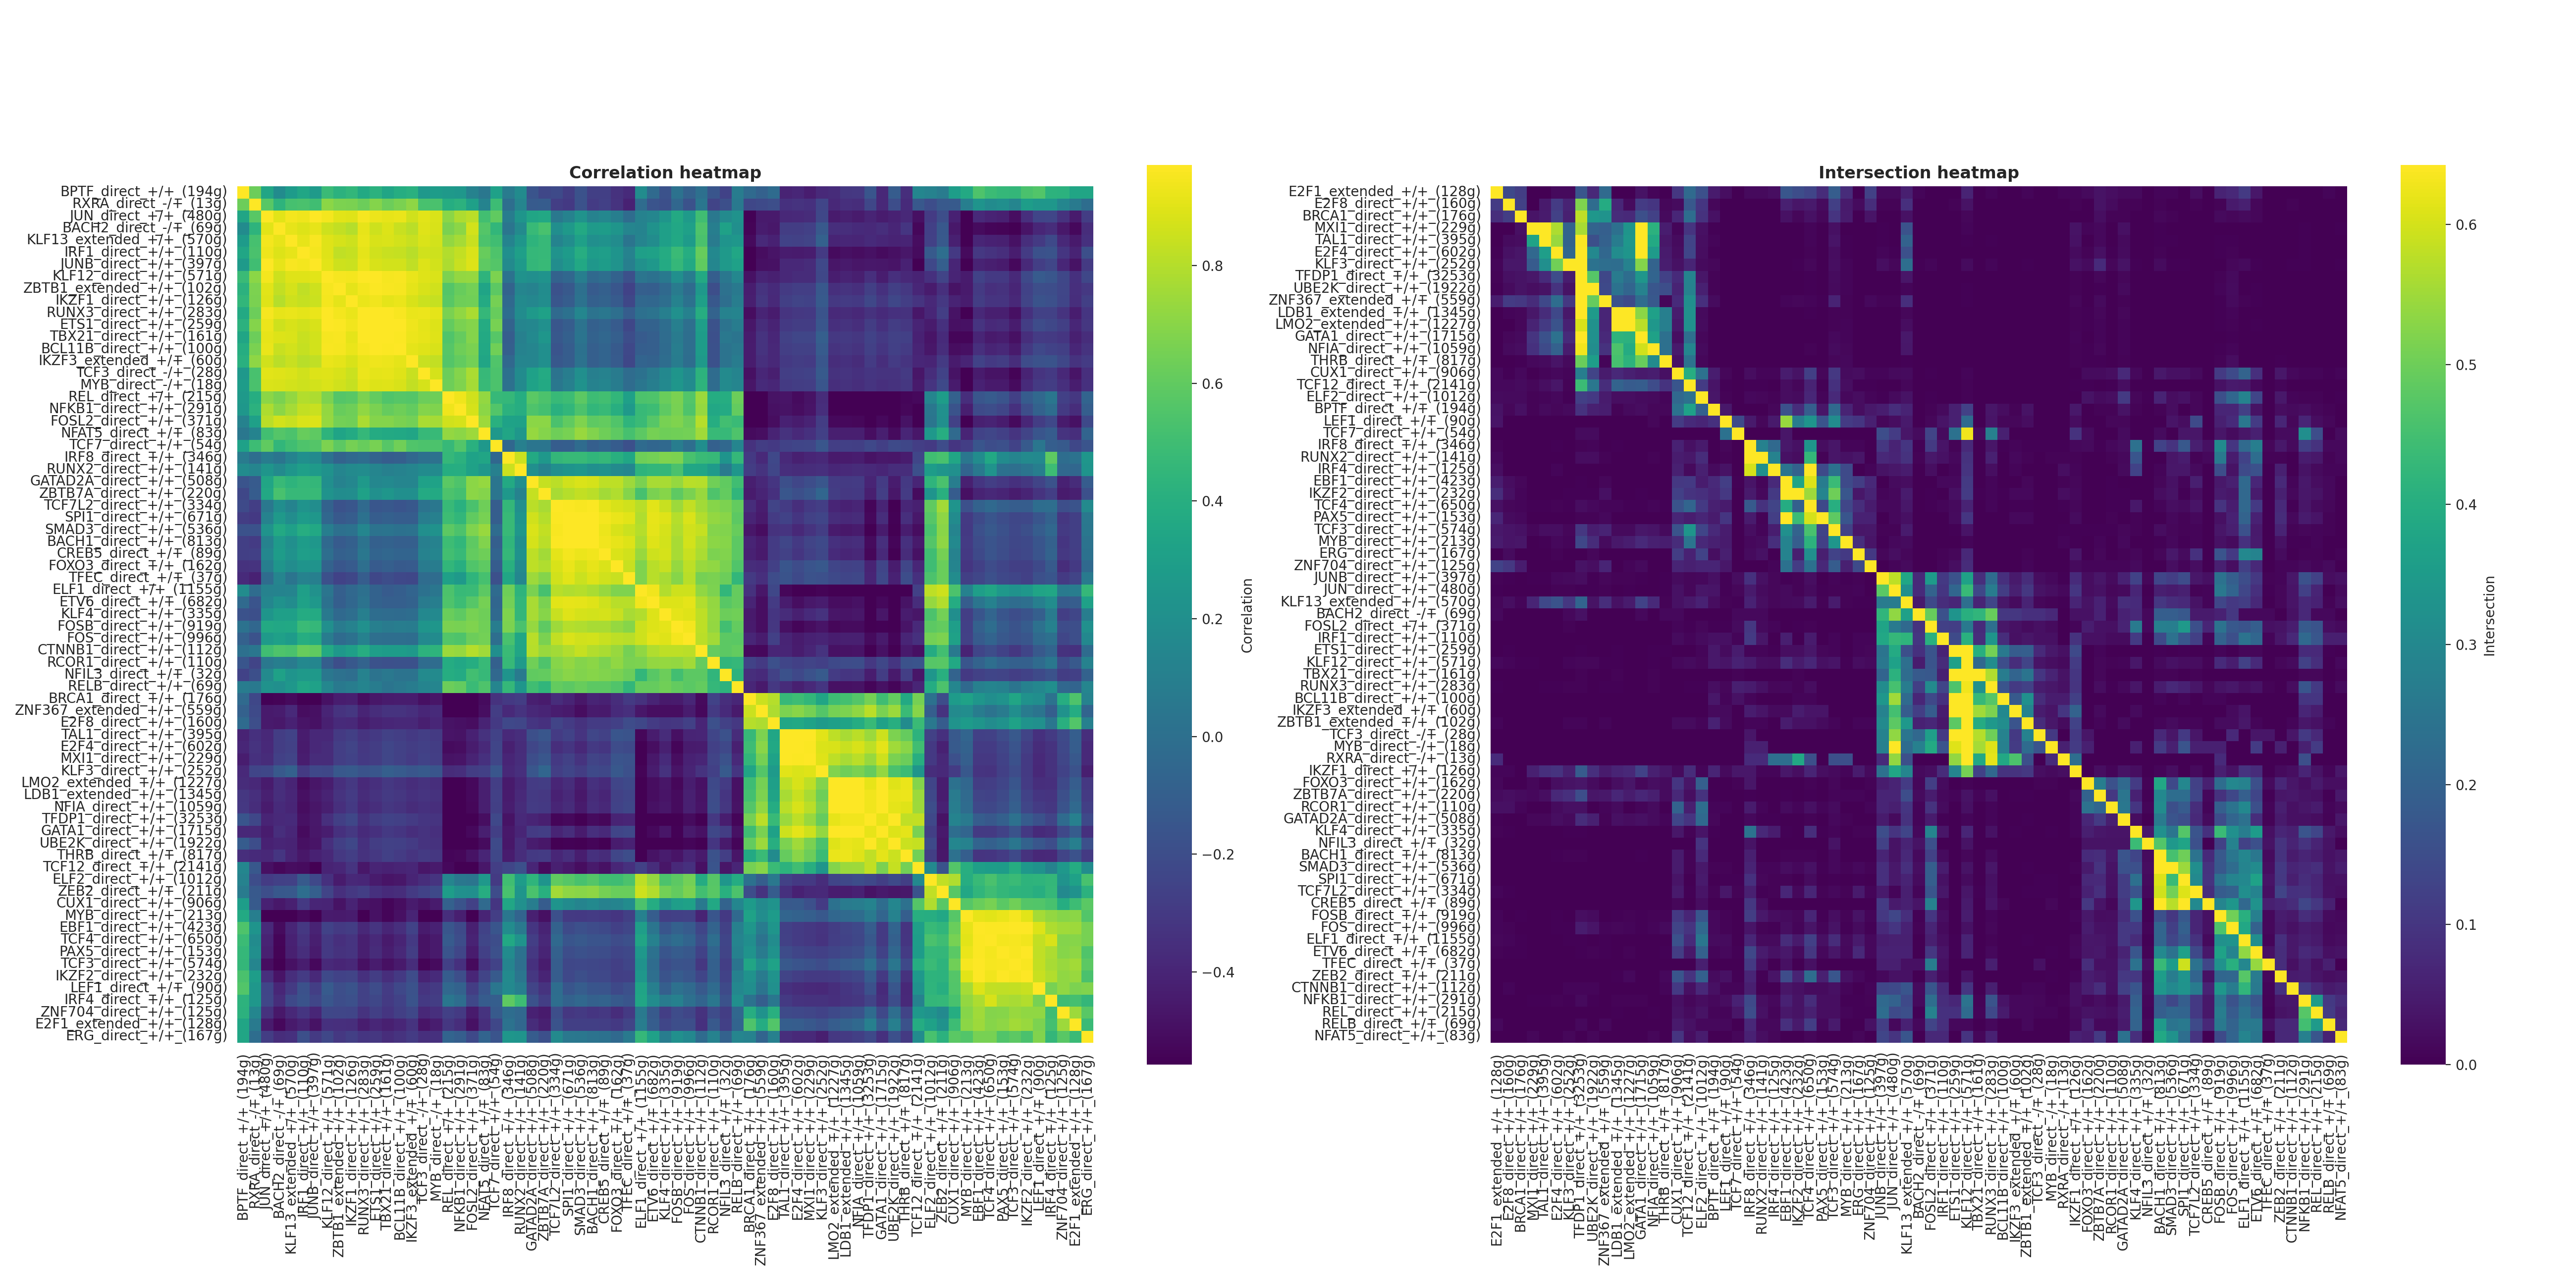
This dual-panel heatmap evaluates functional similarity between eRegulons from two dimensions: continuous values (AUC correlation) and sets (target gene intersection).
Plot Interpretation
- Left AUC correlation heatmap: Calculates Pearson correlation based on AUC activity patterns of each eRegulon across cells, reflecting functional similarity. Highly correlated eRegulons may regulate the same pathway or be at the same regulatory level.
- Right Jaccard intersection heatmap: Calculates Jaccard coefficient based on target gene sets of each eRegulon, reflecting the degree of regulatory target overlap. High-intersection eRegulons may have functional redundancy or serve as backups for each other.
- Clustering order: Both heatmaps share the same hierarchical clustering order, with functionally similar eRegulons displayed adjacently.
Analysis Points
- Joint interpretation: If two eRegulons are highly similar in both heatmaps, they may represent different aspects of the same regulatory axis.
- Indirect regulation identification: If similar only in the AUC heatmap but with no target gene overlap, it may suggest indirect regulatory relationships.
Regulon Specificity Score (RSS)
RSS measures the specificity enrichment degree of each eRegulon in different cell types and is a key indicator for identifying cell type-specific regulatory factors.
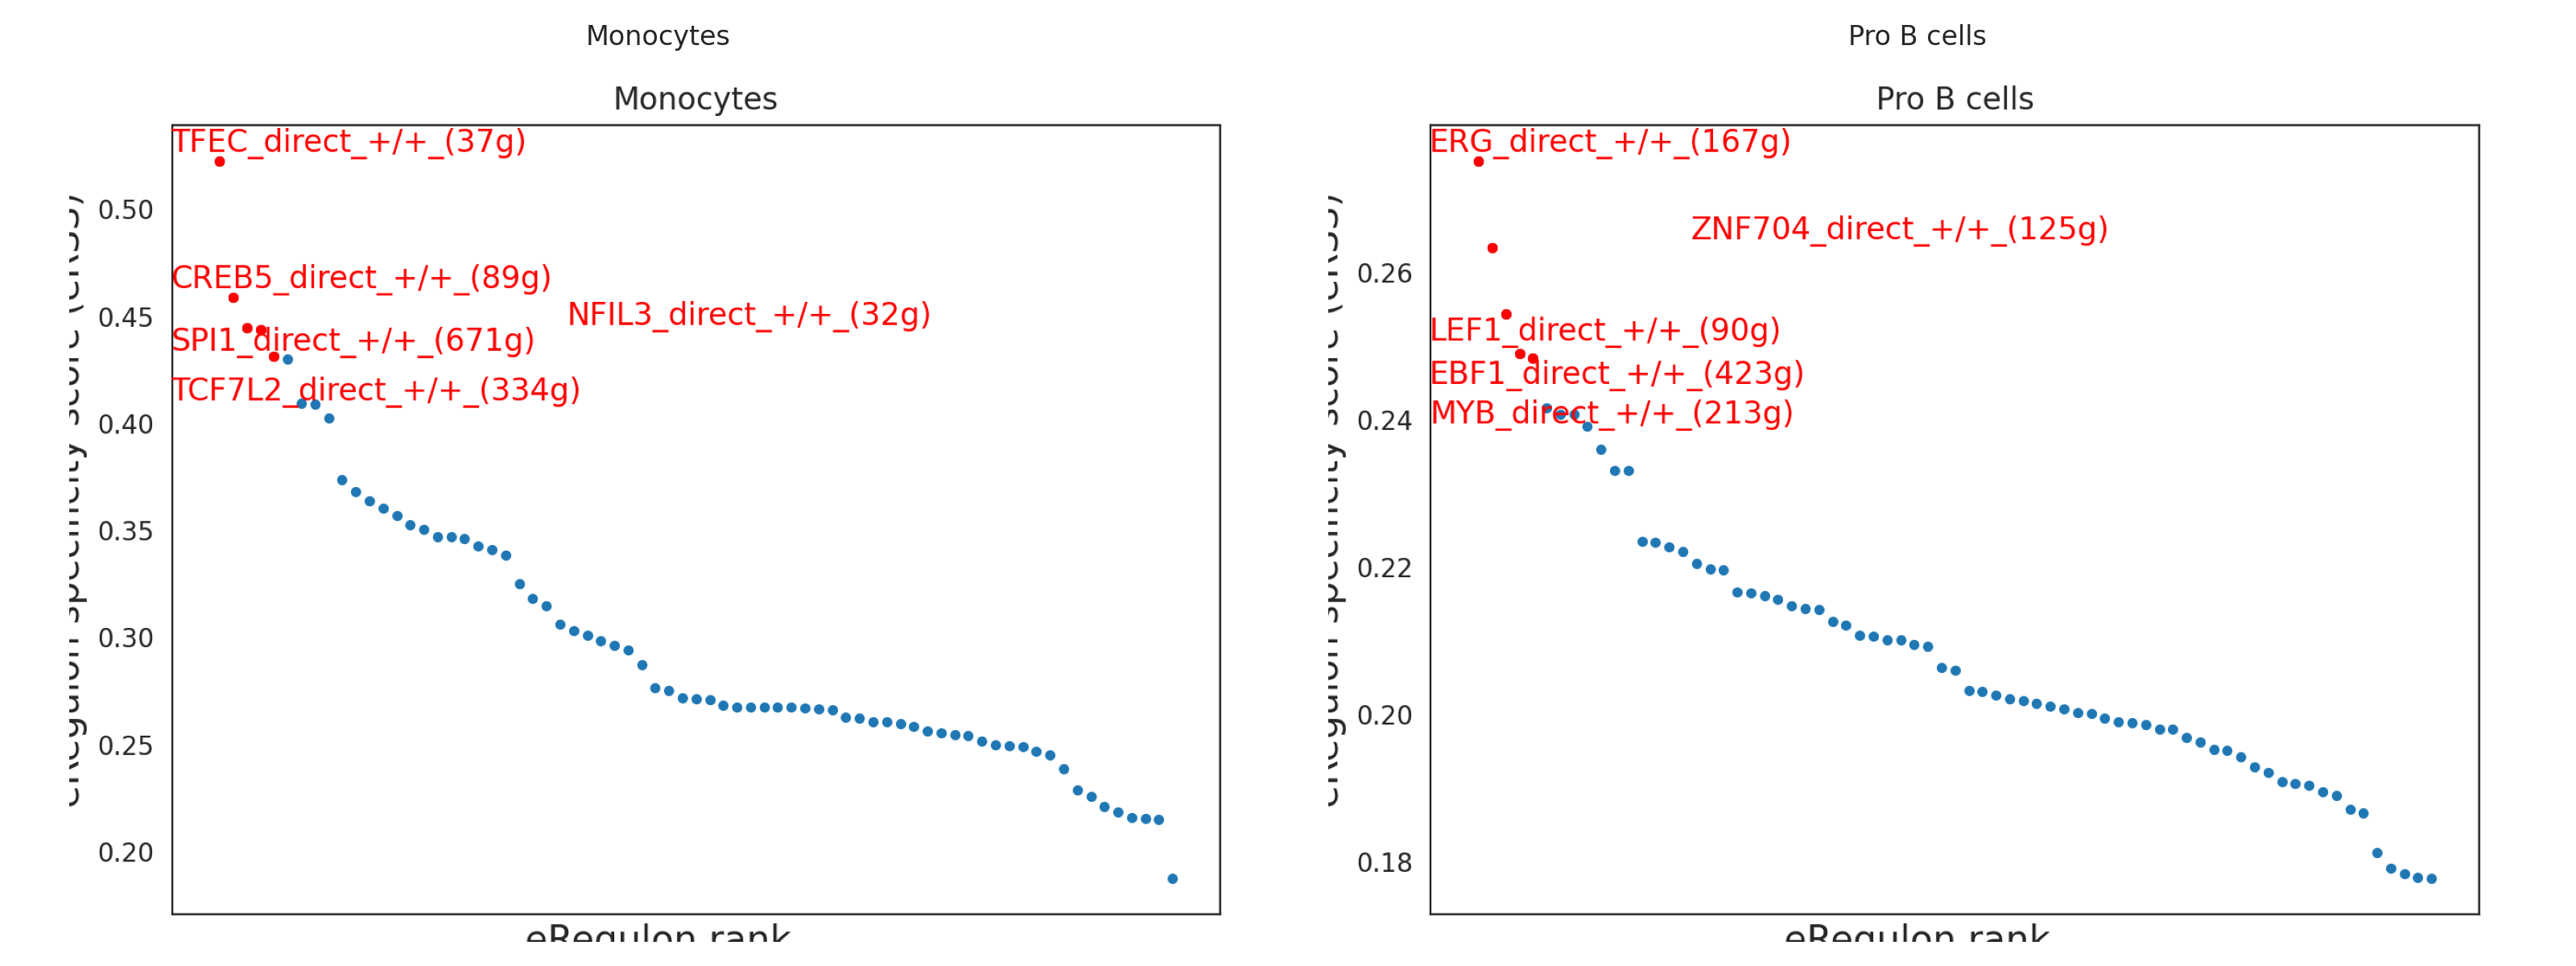
Plot Interpretation
- Heatmap color: Represents RSS scores, with deeper colors indicating stronger specificity of the eRegulon in the corresponding cell type.
- Rows (eRegulon): Clustered and ordered by the cell type with the highest specificity, facilitating identification of cell type-specific regulatory modules.
- Columns (cell types): Display the specificity distribution of each eRegulon across cell types.
Analysis Points
- Cell type-specific regulatory factors: eRegulons with RSS significantly higher in one cell type than others may be core regulatory factors driving that cell type's characteristics.
- Cross-cell type shared regulation: eRegulons with high RSS in multiple cell types may participate in fundamental regulatory processes.
eRegulon AUC Joint Dimensionality Reduction Plot
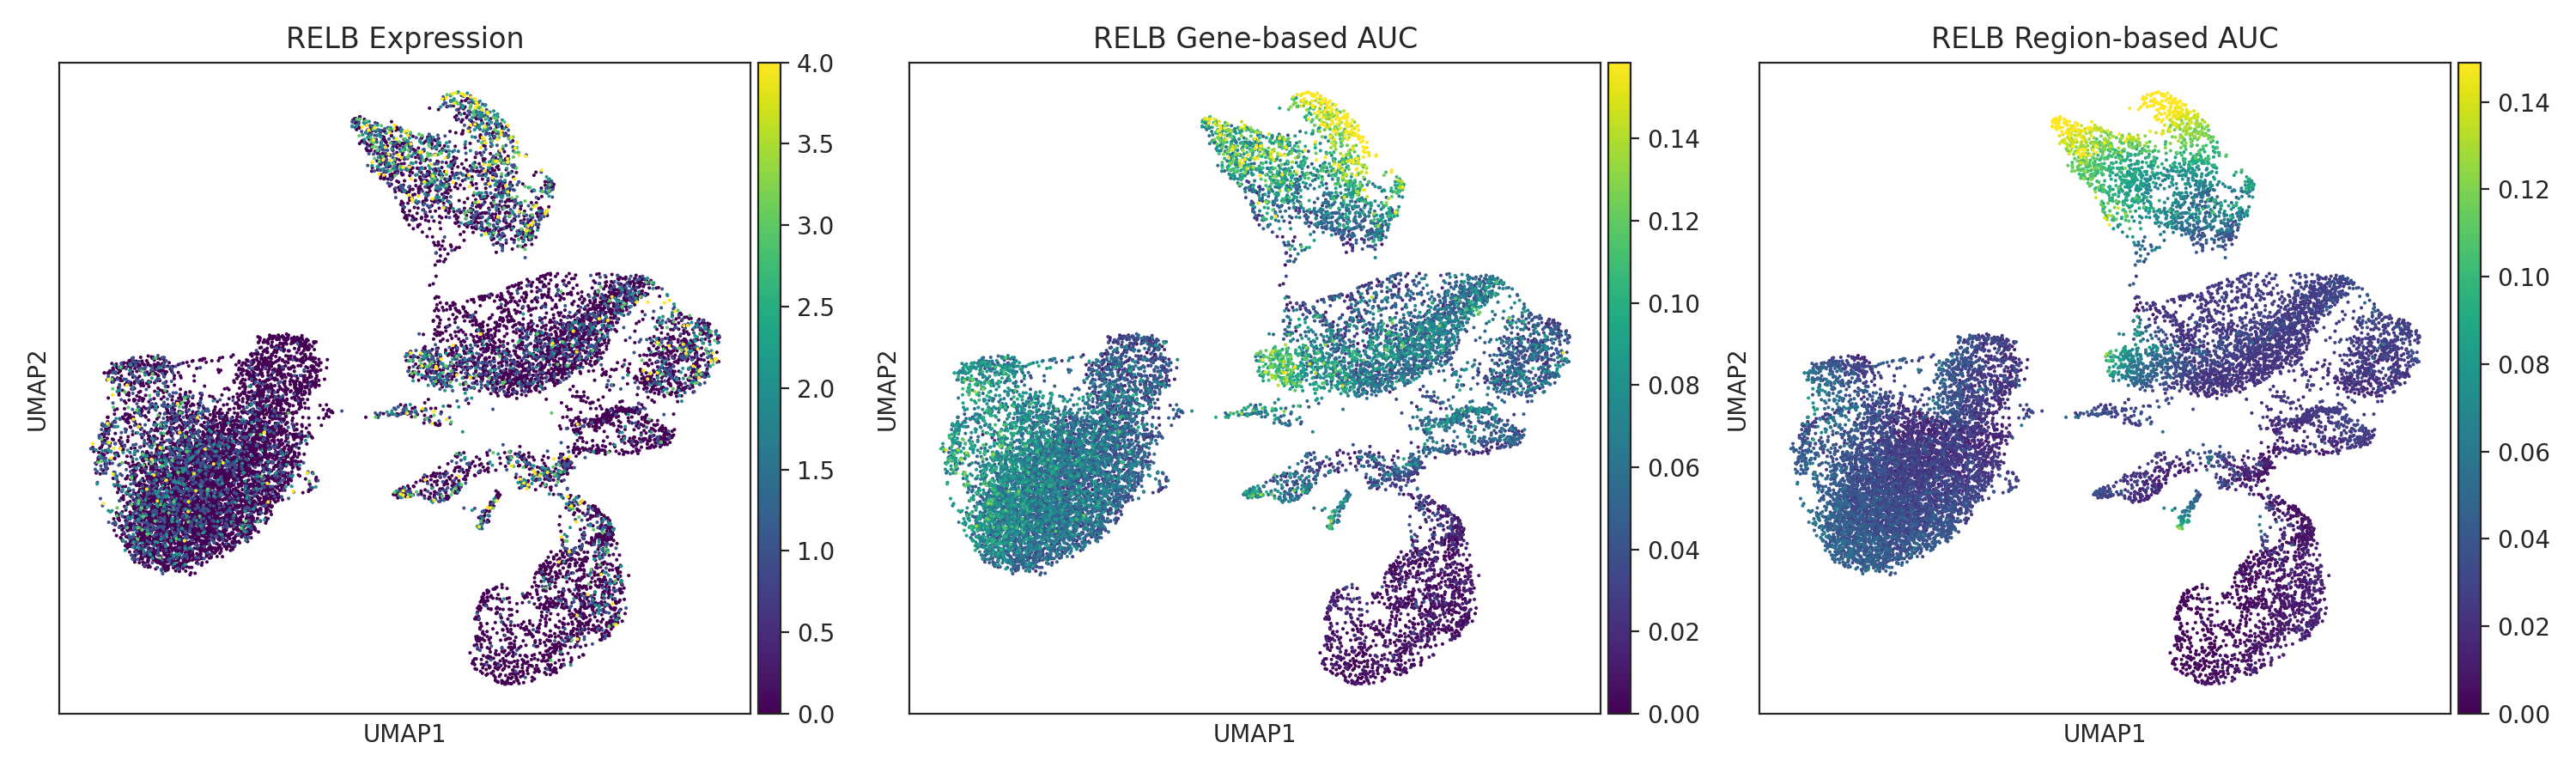
Based on eRegulon AUC matrices, perform UMAP/t-SNE dimensionality reduction, mapping information from TF expression, Gene AUC, and Region AUC three modalities to the same base map to comprehensively display regulatory heterogeneity.
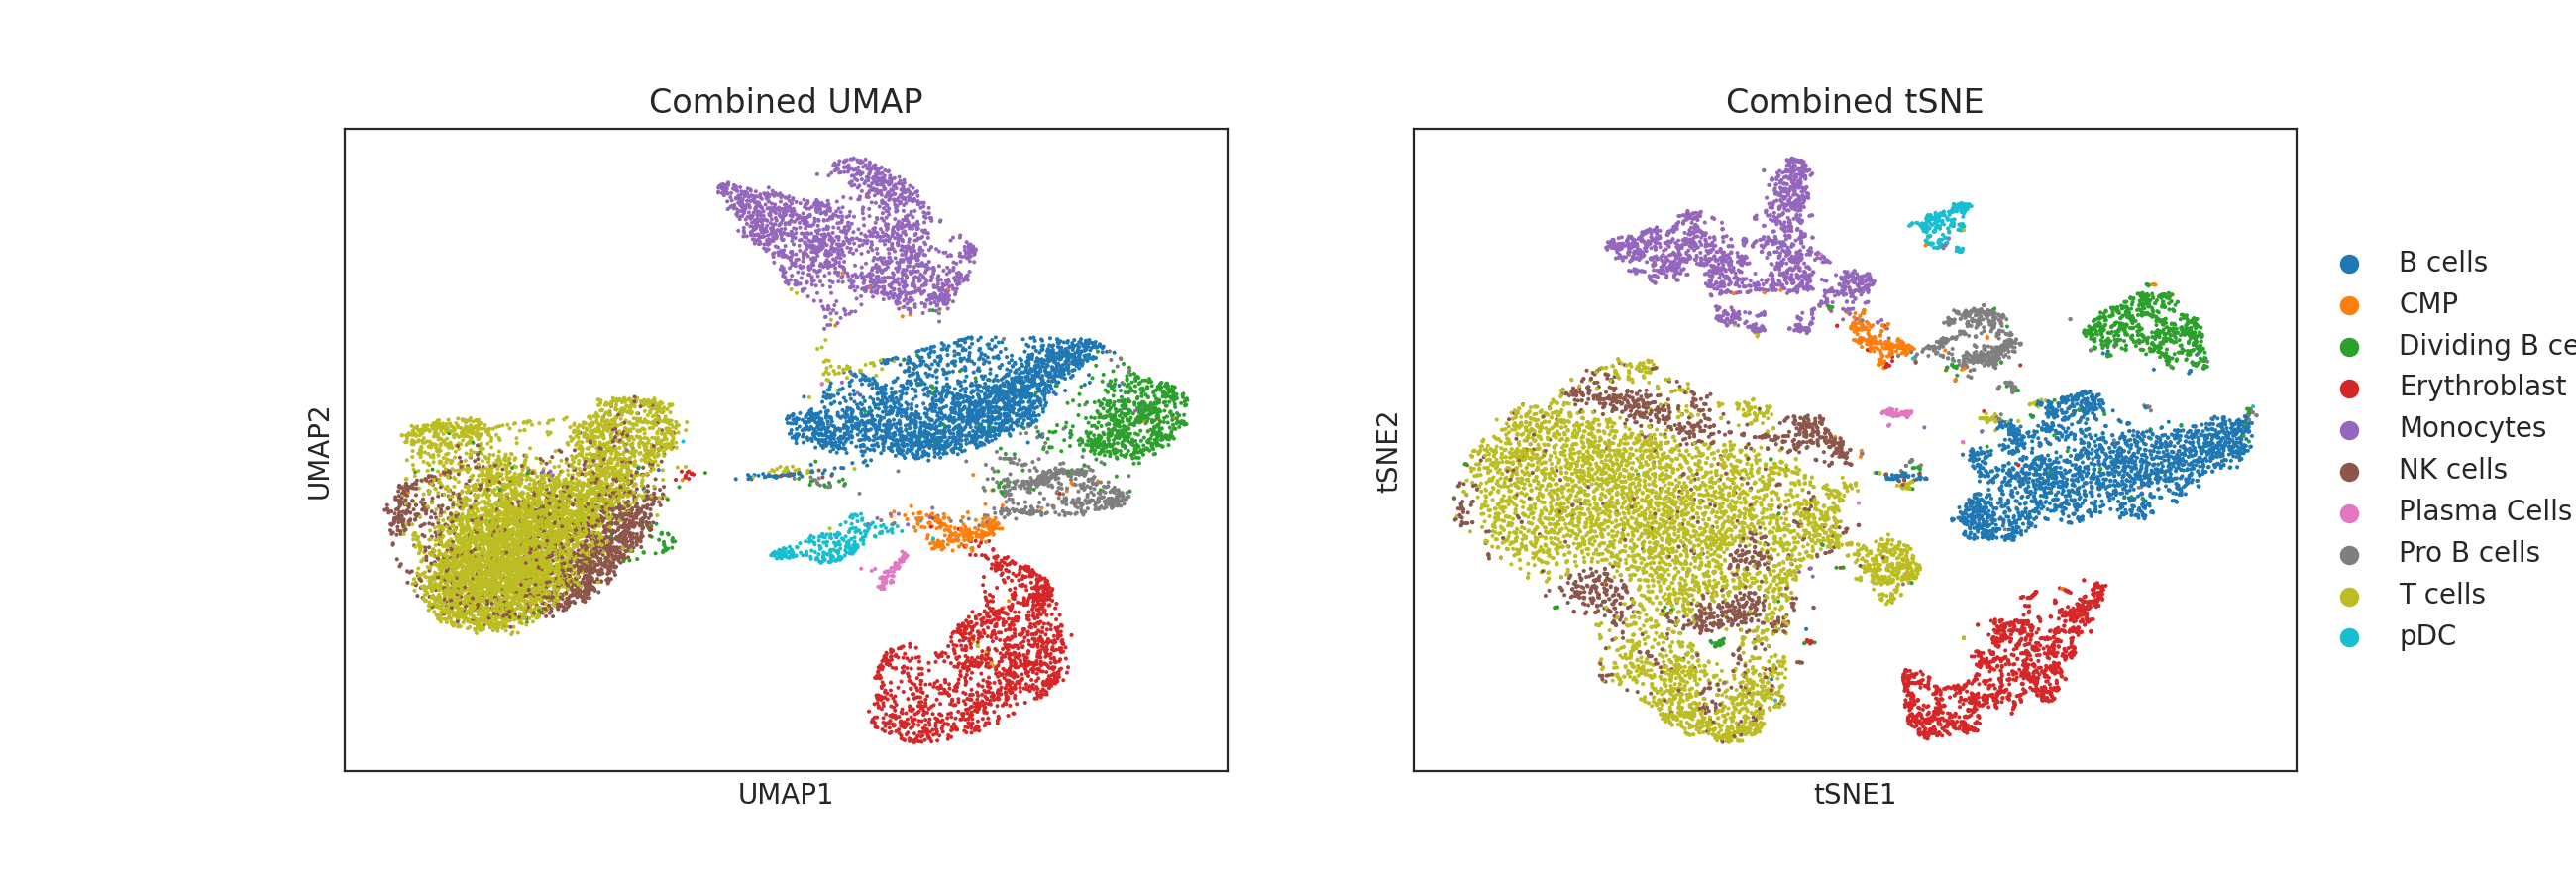
Plot Interpretation
- Base map: UMAP dimensionality reduction based on Combined (Gene-based + Region-based) AUC matrix
- Color mapping: Each subplot displays the distribution of one feature (TF expression, Gene AUC, or Region AUC) on cells
- Modality comparison: By comparing distribution patterns of the same TF across three modalities, you can determine whether regulation mainly occurs at the transcriptional or epigenetic level
Analysis Points
- Modality consistency: If a TF shows highly consistent distribution patterns across three modalities, it indicates regulatory relationships are supported at both transcriptional and epigenetic levels.
- Regulatory heterogeneity: Adjacent cell populations in the dimensionality reduction plot have similar regulatory activity patterns and may belong to the same developmental lineage or functional module.
eRegulon UMAP Single-Cell Mapping
Map the AUC activity score of each eRegulon to UMAP space, displayed by cell type facets, intuitively presenting the spatial distribution of regulatory activity.
Plot Interpretation
- Each panel: Displays the activity distribution of one eRegulon on UMAP, colored by cell type
- Color gradient: From blue (low activity) to red (high activity), indicating the activity level of the eRegulon in different cells
- Cell type specificity: By observing activity distribution differences across cell types, RSS results can be intuitively validated
Heatmap-Dotplot Combined Display (heatmap_dotplot)
SCENIC+ built-in heatmap-dotplot combined display uses color to represent Gene-based AUC and dot size to represent Region-based AUC, simultaneously displaying regulatory activity from two modalities in one plot.
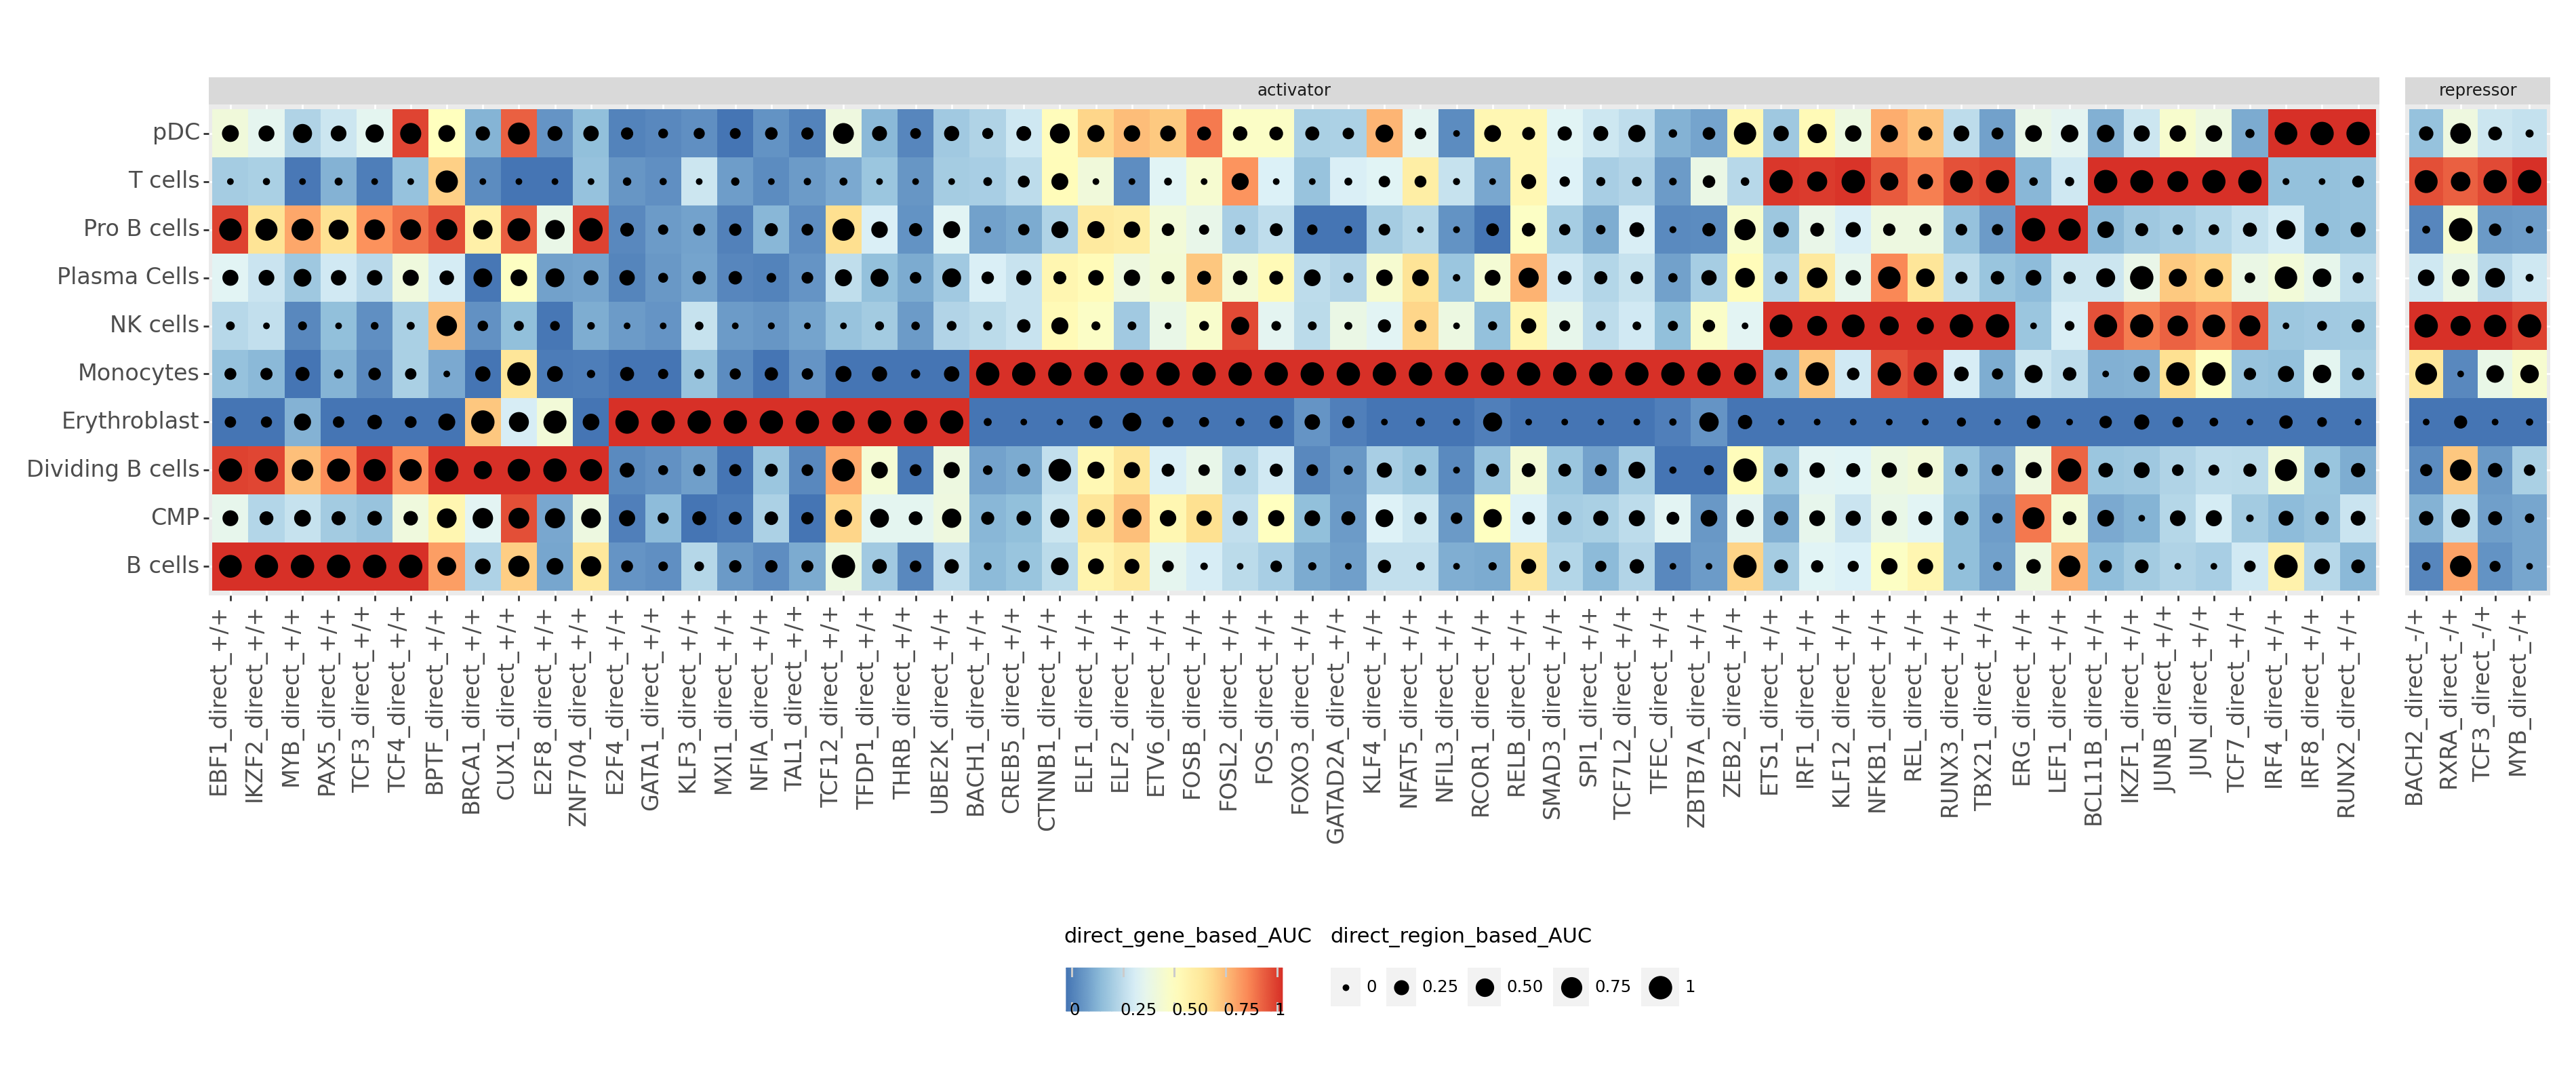
Plot Interpretation
- Color channel (Gene-based AUC): Reflects regulatory activity at the target gene expression level
- Dot size channel (Region-based AUC): Reflects regulatory activity at the chromatin accessibility level
- Rows (eRegulon): Ordered by regulatory activity
- Columns (cell types): Display cell type-specific patterns for each eRegulon
Analysis Points
- Dual-modal validation: eRegulon-cell type pairs with both color and dot size significant represent high-confidence regulatory relationships supported at both RNA and ATAC levels.
- Cell type-specific identification: eRegulons with both color and dot size significant in one column but not in others are cell type-specific regulatory factors.
RSS-Expression Combined Dotplot
Custom RSS-expression combined dotplot integrates RSS scoring with TF expression Z-score to construct a comprehensive regulatory feature atlas.
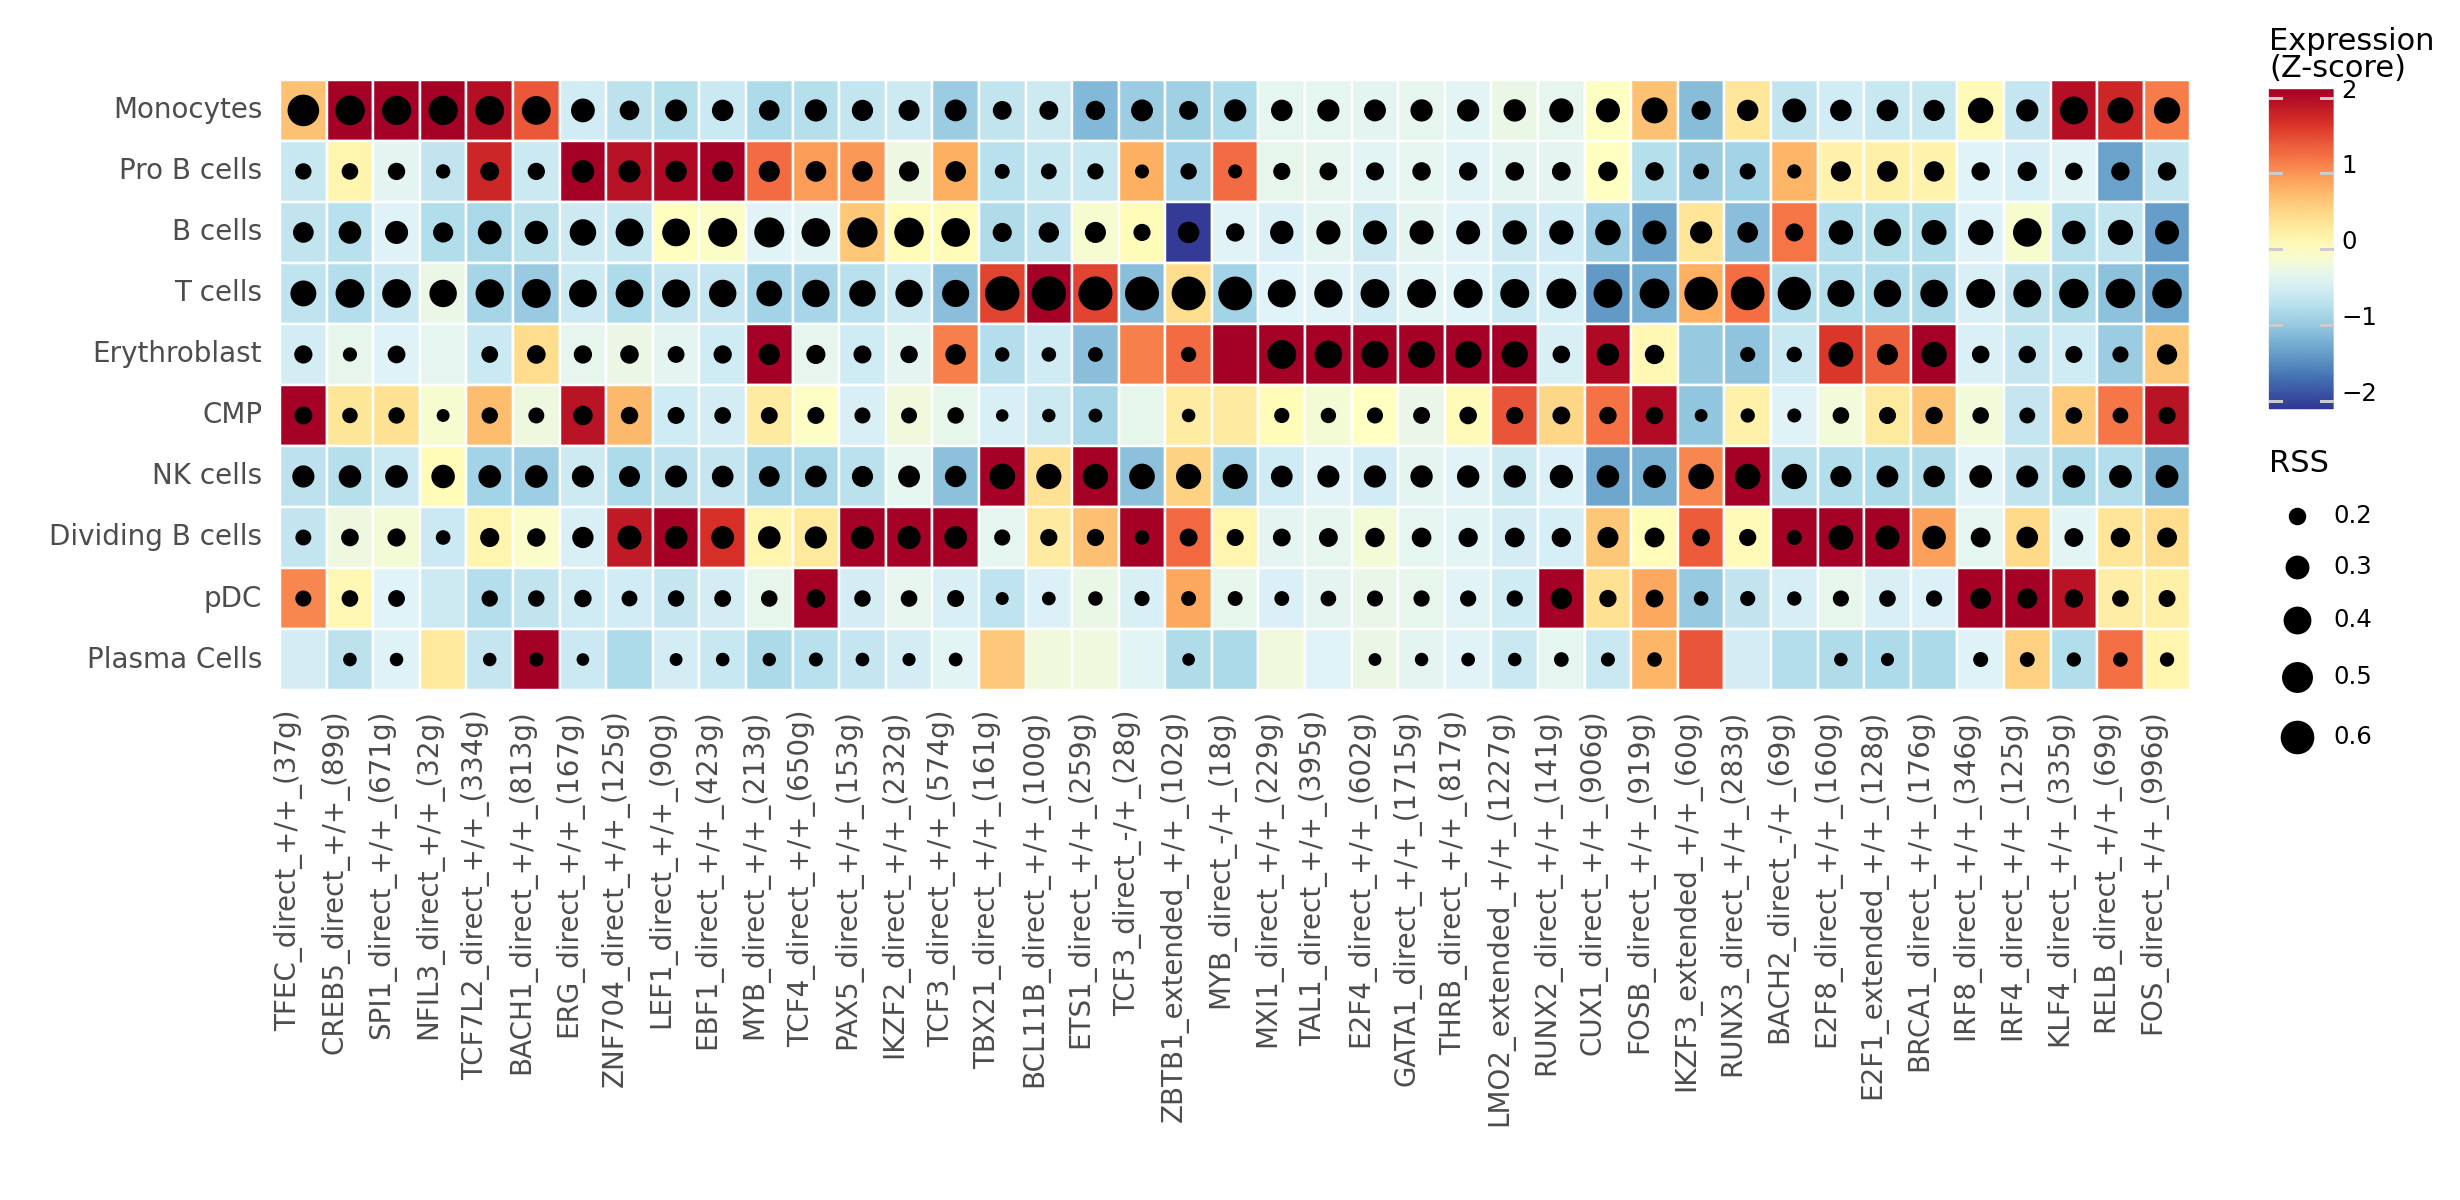
Plot Interpretation
- RSS scoring: Reflects eRegulon specificity in each cell type
- TF expression Z-score: Reflects the TF's own expression level
- Joint interpretation: TFs with high RSS + high expression are core driving factors for that cell type; TFs with high RSS + low expression may be potential regulatory factors (low expression but high specificity)
Result File List
| File Name | Content Description |
|---|---|
scplusmdata.h5mu | Final MuData object output by SCENIC+ pipeline (contains AUC matrices for direct/extended eRegulons). |
ctx_results.hdf5 | cisTarget motif enrichment analysis results. |
dem_results.hdf5 | Differential accessibility analysis results. |
cistromes_direct.h5ad | Cistrome (TF-peak associations) for Direct eRegulons. |
cistromes_extended.h5ad | Cistrome for Extended eRegulons. |
AUCell_direct.h5mu | AUCell activity matrix for Direct eRegulons. |
AUCell_extended.h5mu | AUCell activity matrix for Extended eRegulons. |
direct_e_regulon_metadata_raw.csv | Raw metadata table for Direct eRegulons. |
extended_e_regulon_metadata_raw.csv | Raw metadata table for Extended eRegulons. |
TF_eRegulon_cor_Direct_vs_Extended.pdf | TF expression-AUC correlation scatter plot (Direct vs Extended). |
correlation_and_intersection_heatmaps.pdf | eRegulon similarity dual-panel heatmap (AUC correlation + Jaccard intersection). |
RSS_matrix_transposed.csv | RSS scoring matrix (eRegulon × cell types). |
eRegulon_combined_AUC_reduction.pdf | Combined AUC joint dimensionality reduction plot (UMAP). |
TF_AUC_Combined_UMAP/ | Directory of UMAP single-cell mappings for each eRegulon (faceted by cell type). |
Regulon_Specificity_Score/direct_eRegulon_heatmap_dotplot.pdf | Direct eRegulon heatmap-dotplot combined display. |
Regulon_Specificity_Score/direct_eRegulon_RSS_expression_dotplot.pdf | Direct eRegulon RSS-expression combined dotplot. |
Important Notes
1. Importance of data quality: SCENIC+ has high requirements for input data quality. Low-quality ATAC data will directly affect the quality of pycisTopic topic modeling, thereby reducing the accuracy of regulatory network inference. It is recommended to perform thorough quality control before analysis, including TSS enrichment, nucleosome signal, and fragment length distribution metrics.
2. Necessity of dual-omics data: The core advantage of SCENIC+ lies in integrating evidence from both RNA and ATAC omics levels. The input object must contain both RNA and ATAC Assays, otherwise analysis cannot proceed.
3. Computational resource requirements: The complete SCENIC+ workflow (pycisTopic + cisTarget + network inference) has high memory and CPU requirements. For large-scale datasets (> 50K cells), it is recommended to enable downsampling to control computational resource consumption.
4. Species matching: The species parameter determines cisTarget motif database selection. Incorrect species settings will cause motif enrichment analysis to fail. Please confirm the species parameter is consistent with experimental samples.
5. eRegulon filtering thresholds: The three thresholds TF_eRegulon_cor, AUC_Gene_Region_cor, and min_target_genes jointly determine the final number of retained eRegulons. It is recommended to use default thresholds first, then adjust based on result quality.
6. Caution in RSS interpretation: RSS reflects relative specificity rather than absolute activity. High RSS values indicate that the eRegulon has the strongest activity in a specific cell type, but does not mean it has no activity in other cell types. Comprehensive judgment should be made in combination with TF expression levels and other regulatory evidence.
7. Result interpretation requires biological knowledge integration: SCENIC+ infers statistical regulatory relationships, which need to be validated with known biological knowledge and literature. Inferred regulatory relationships may be direct or indirect, and may also have cell state-dependent regulatory patterns.
Frequently Asked Questions (FAQ)
Q1: What is the difference between SCENIC+ and traditional SCENIC?
A: The main difference lies in the data integration level:
- Traditional SCENIC: Based solely on scRNA-seq data, infers TF-target gene relationships through gene co-expression, with high false positive rate
- SCENIC+: Simultaneously uses scRNA-seq and scATAC-seq data, jointly validates regulatory relationships at both RNA expression and chromatin accessibility levels, significantly reducing false positives
- eRegulon concept: SCENIC+ introduces the extended Regulon (eRegulon) concept, associating TF, regulatory elements (Region), and target genes (Gene) as complete regulatory units
Q2: Why are there very few eRegulons in my analysis results?
A: Possible reasons include:
- Too few cells: Leading to insufficient statistical power, it is recommended to increase cell count or lower filtering thresholds
- Filtering thresholds too strict: Try lowering TF_eRegulon_cor or AUC_Gene_Region_cor thresholds
- min_target_genes set too high: Lowering this threshold can retain more eRegulons with fewer target genes
- Poor ATAC data quality: Low-quality ATAC data causes pycisTopic topic modeling to fail, it is recommended to check quality control metrics such as TSS enrichment
Q3: How to choose appropriate n_topics parameters?
A: n_topics controls the number of topics in pycisTopic topic modeling:
- Default value 40: Suitable for most datasets
- Smaller values (20-30): Suitable for data with fewer cell types and simple regulatory structure
- Larger values (60-100): Suitable for data with rich cell types and complex regulatory structure
- Too many topics will increase computational load and may introduce noise; too few may miss important regulatory modules
Q4: What does a negative RSS score mean?
A: RSS scores can be negative, indicating that the eRegulon's activity in that cell type is below background level. Only positive RSS values have biological significance (indicating specific enrichment), while negative values are usually ignored.
Q5: Which downstream analyses can SCENIC+ results be integrated with?
A: SCENIC+ results can be integrated with various analyses:
- Peak2Gene analysis: Cross-validate regulatory networks inferred by SCENIC+ with peak-gene associations from Peak2Gene analysis
- Motif analysis: Match TFs in eRegulons with motif enrichment analysis results to validate TF binding site activity
- Pseudotime analysis: Map eRegulon AUC activity to Monocle3 trajectories to reveal temporal dynamics of regulatory networks
- Differential analysis: Integrate cell type-specific eRegulons with differential expression/differential accessibility analysis results to identify core regulatory factors
Q6: What is the difference between direct and extended eRegulons?
A:
- Direct eRegulons: Contain only target genes directly regulated by TF (TF binding sites located near target genes)
- Extended eRegulons: Contain both directly and indirectly regulated target genes (TF binding sites may be located in more distant regions)
- Recommended use: It is usually recommended to use direct eRegulons for main analysis, as they have lower false positive rates; extended eRegulons can be used for supplementary exploration of indirect regulatory relationships
methods
References
[1] FANTL V, BRUSSELMANS J, LU W, et al. SCENIC+: single-cell multiomic inference of enhancers and gene regulatory networks[J]. Nature methods, 2023, 20(8): 1154-1164.
[2] AENTS I, BRUSSELMANS J, HU Y, et al. pyCisTopic: cis-regulatory topic modeling on single-cell ATAC-seq data[J]. Nature methods, 2022, 19(12): 1625-1634.
[3] MARIN I, FERRY M, KUMAR M S, et al. SCENIC: single-cell regulatory network inference and clustering[J]. Nature methods, 2018, 15(11): 1011-1014.