
Single-cell scATAC-seq & scRNA-seq Dual-omics Advanced Analysis: TF–Peak–Gene Trios Analysis
Introduction
TIP
TF–Peak–Gene Trios analysis is the core functional unit in single-cell multi-omics regulatory network research. Its goal is: in specific cell states, systematically identify "which TFs" regulate "which Genes" by binding to "which regulatory Peaks", thereby reconstructing biologically interpretable TF → Peak → Gene regulatory logical chains.
TF–Peak–Gene Trios integrates molecular evidence from three levels into a complete regulatory unit:
- TF (Regulatory Initiator): Transcription factors initiate specific regulation by recognizing and binding to characteristic Motif motifs on target DNA.
- Peak (Regulatory Mediator): Represents open chromatin regions, often enriched in cis-regulatory elements such as enhancers and promoters; its accessibility is the physical prerequisite for TF function.
- Gene (Functional Output): Gene expression changes are the ultimate manifestation of upstream regulatory events at the transcriptional level.
This document aims to provide single-cell multi-omics researchers with a detailed TF–Peak–Gene Trios technical guide, covering its basic principles, operation methods on the SeekSoul Online cloud platform, result interpretation, and common issues, helping you quickly master and apply this tool.
TF–Peak–Gene Trios Theoretical Foundation
Core Principles
The core idea of TF–Peak–Gene Trios analysis is: Integrating multi-dimensional evidence from four levels: Peak2Gene co-variation links, Motif–Peak physical binding evidence, TF expression levels, and TF chromatin activity (chromVAR), constructing high-confidence TF → Peak → Gene regulatory logical chains through strict multi-dimensional threshold filtering.
Compared to methods based only on co-expression or only on Peak2Gene correlation, the advantage of Trios analysis lies in introducing multiple independent validations:
- Physical binding evidence (Motif–Peak spatial overlap): Through genomic spatial alignment, confirm whether the TF's binding Motif physically falls within the target Peak.
- Expression co-variation (TF–Gene correlation): Confirm whether the TF's mRNA expression and target gene expression have significant correlation across cells.
- Activity–expression consistency (TF activity–expression correlation): Confirm whether the TF's chromatin binding activity (inferred by chromVAR) is consistent with its mRNA expression level, excluding non-functional binding.
- Activity-driven target genes (TF activity–target gene correlation): Confirm whether the TF's chromatin binding activity truly drives the transcriptional changes of target genes.
Key Algorithms and Workflows
Trios analysis includes the following key steps:
- Initial Trios assembly: Based on Peak2Gene linking results, through genomic spatial overlap alignment (
findOverlaps), associate Motif–Peak binding relationships with Peak–Gene regulatory links to construct initial TF–Peak–Gene Trios - Multi-dimensional statistical tests: Calculate TF–Gene expression correlation, TF activity–expression consistency, TF activity–target gene correlation respectively, and calculate comprehensive regulatory strength score (Linkage Score)
- Linkage Score calculation: For all associated Peaks of the same TF–Gene pair, calculate
, quantifying the total strength of multi-point joint regulation - Multi-dimensional threshold filtering: Through joint filtering of multiple dimensions such as Motif affinity, triple correlation and significance, Linkage Score, retain high-confidence Trios
Cloud Platform Operation Guide
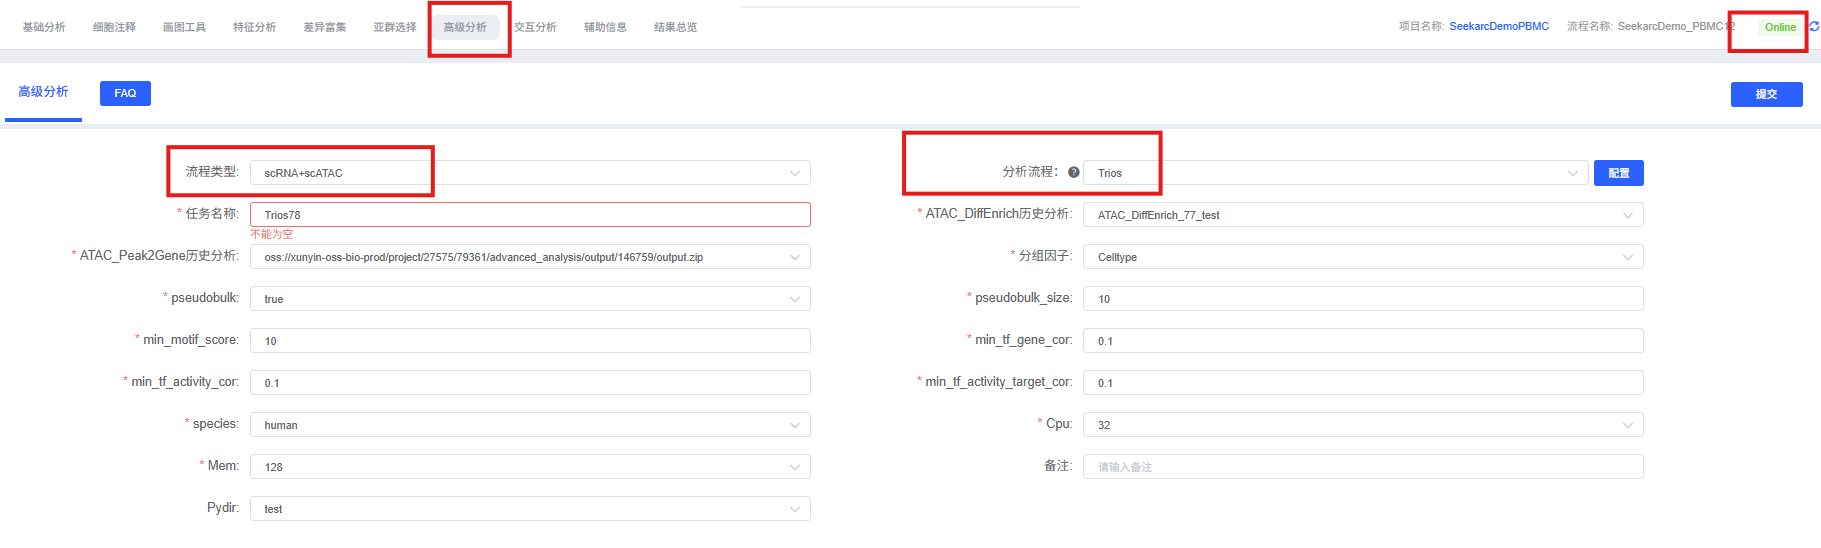
On the cloud platform, the TF–Peak–Gene Trios analysis workflow is designed to be intuitive and user-friendly. This analysis relies on the output from previous Peak2Gene analysis as input.
Pre-Analysis Preparation
TIP
TF–Peak–Gene Trios analysis has specific requirements for input data. Before starting the analysis, please ensure:
- Peak2Gene analysis is complete: This analysis relies on the
Gene2PeakLinks.xlsfile output from the Peak2Gene module as input. - Motif annotation has been added: The input Seurat object must have completed
AddMotifsoperation, containing complete Motif sequence annotation and genomic location information. - chromVAR activity has been calculated: The input object needs to contain the TF activity matrix inferred by chromVAR (used to calculate TF activity–expression consistency).
- Data quality: Ensure ATAC and RNA data have undergone thorough quality control. Low-quality data will lead to inaccurate Trios inference.
Parameter Details
The table below lists the main parameters of the TF–Peak–Gene Trios analysis module on the cloud platform and their descriptions.
| Parameter Name | Description |
|---|---|
| Task Name | The name of this analysis task, must start with an English letter, can contain English letters, numbers, underscores, and Chinese characters. |
| Species | Species information, used for TF naming case conversion and downstream Motif database matching (human or mouse). |
| Grouping Factor | Cell grouping column name, used for heatmap display grouped by cell population. |
| Cell Types | Cell types to analyze. |
| Filter Factor | Column name of sample information. |
| Filter Object | Sample names to analyze. |
| Motif Score Threshold | Minimum Motif Score threshold, used to filter low-affinity TF–Peak binding, default 10.0. Set to 0 to not filter. |
| TF-Gene Correlation Threshold | Minimum absolute value threshold for TF–Gene expression correlation, used to filter TF–target gene pairs with co-variation at expression level, default 0.2. |
| TF Activity-Expression Consistency Threshold | Minimum absolute value threshold for TF activity and expression correlation, used to ensure the TF's chromatin binding activity is consistent with its mRNA expression level, default 0.2. |
| TF Activity-Target Gene Correlation Threshold | Minimum absolute value threshold for TF activity and target gene expression correlation, used to ensure the TF's chromatin binding activity drives the transcriptional changes of target genes, default 0.2. |
| P-value Threshold | Maximum correlation P-value threshold, used for significance filtering of triple correlations, default 0.05. |
| Downsample | Whether to downsample cells before analysis to save computational resources, default TRUE. |
| Downsample_num | Downsampling number, maximum number of cells to retain for each cell subgroup, only effective when downsampling is enabled, default 1000. |
Important Notes
TIP
- Depends on Peak2Gene output: This analysis must use the output of the Peak2Gene module (
Gene2PeakLinks.xlsandoutput.rds) as input and cannot run independently. Please ensure Peak2Gene analysis has been correctly completed. - Motif annotation necessity: The input Seurat object must have completed
AddMotifsoperation. If Motif annotation is missing, TF–Peak physical binding relationships cannot be established, and Trios assembly will fail. - chromVAR activity necessity: The calculation of TF activity–expression consistency and TF activity–target gene correlation depends on the TF activity matrix inferred by chromVAR. If chromVAR results are missing in the input object, these two dimensions will be skipped, and filtering will be based only on remaining dimensions.
- Multi-dimensional filtering threshold balance: Overly strict thresholds may retain too few Trios; overly lenient thresholds may introduce false positives. It is recommended to use default thresholds first, then adjust based on results.
- Linkage Score dynamic threshold: The platform will automatically calculate the Linkage Score distribution of all TF–Gene pairs and select the top 10% (90th percentile) as the filtering threshold, retaining only the core network with the most significant regulatory effects.
- Biological interpretation of negative correlations: "Negative correlation" in TF–Gene or TF activity–target gene cannot be directly equated with "direct physical inhibition". It may be caused by temporal misalignment on the developmental trajectory or TF activating an intermediate repressor (indirect effect). Definitive regulatory direction still requires experimental validation.
- Computational resource requirements: Trios analysis involves multi-dimensional statistical tests and genome-wide Motif spatial alignment, with significant computational load. For large-scale datasets, it is recommended to enable downsampling.
Operation Workflow
- Enter analysis module: Navigate to the "Advanced Analysis" module on the cloud platform, select "TF–Peak–Gene Trios".
- Create new task: Name your analysis task and select the sample or project to analyze.
- Configure parameters: According to the above guidelines, select cell types, species, correlation thresholds, and other parameters.
- Submit task: After confirming parameters are correct, click the "Submit" button and wait for analysis to complete.
- View results: After analysis is complete, view the generated analysis report and result files in the task list, including Trios tables, regulatory scatter plots, co-variation heatmaps, regulatory network diagrams, etc.
Result Interpretation
TF–Peak–Gene Trios analysis reports contain rich charts and data files. Below is a detailed interpretation of core results.
Core TF Screening and Target Gene Regulatory Scatter Plot
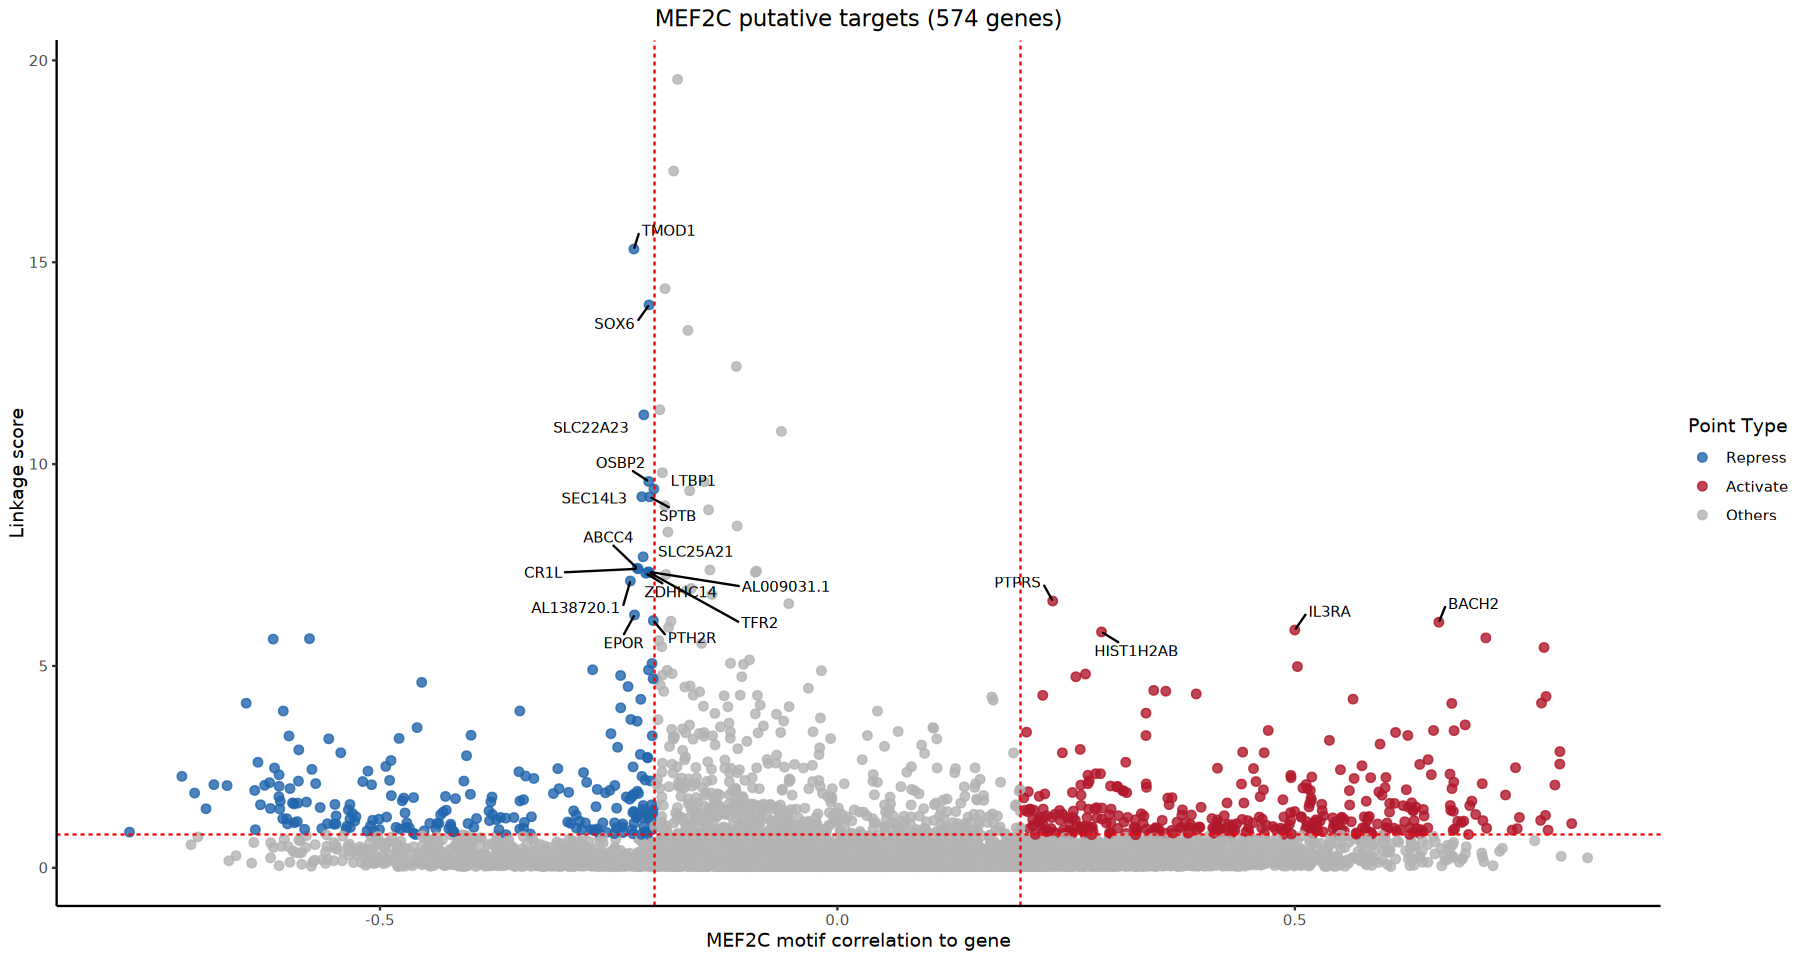
The platform automatically calculates the total regulatory strength (Total Linkage Score) for each TF, selects the top-ranked core TF (Hub TFs), and plots TF–target gene regulatory scatter plots.
Plot Interpretation
- X-axis (TF activity–target gene correlation): Reflects the correlation between TF's chromatin binding activity and target gene expression, indicating the direction and effect of regulation.
- Y-axis (Linkage Score): Reflects comprehensive physical regulatory strength, with higher values indicating more definitive regulatory evidence.
- Highlight markers: Points in the upper right corner (positive correlation + high Linkage Score) and upper left corner (negative correlation + high Linkage Score) are core target genes passing dual threshold filtering, representing inferred activator and repressor regulatory relationships respectively.
Analysis Points
- Core target gene identification: Target genes with both high absolute correlation values and high Linkage Score are the most credible regulatory targets of this TF.
- Regulatory direction inference: Positive correlation suggests activator regulation, negative correlation may indicate repressor regulation, but careful interpretation with biological knowledge is needed.
Trios Regulatory Co-variation Heatmap
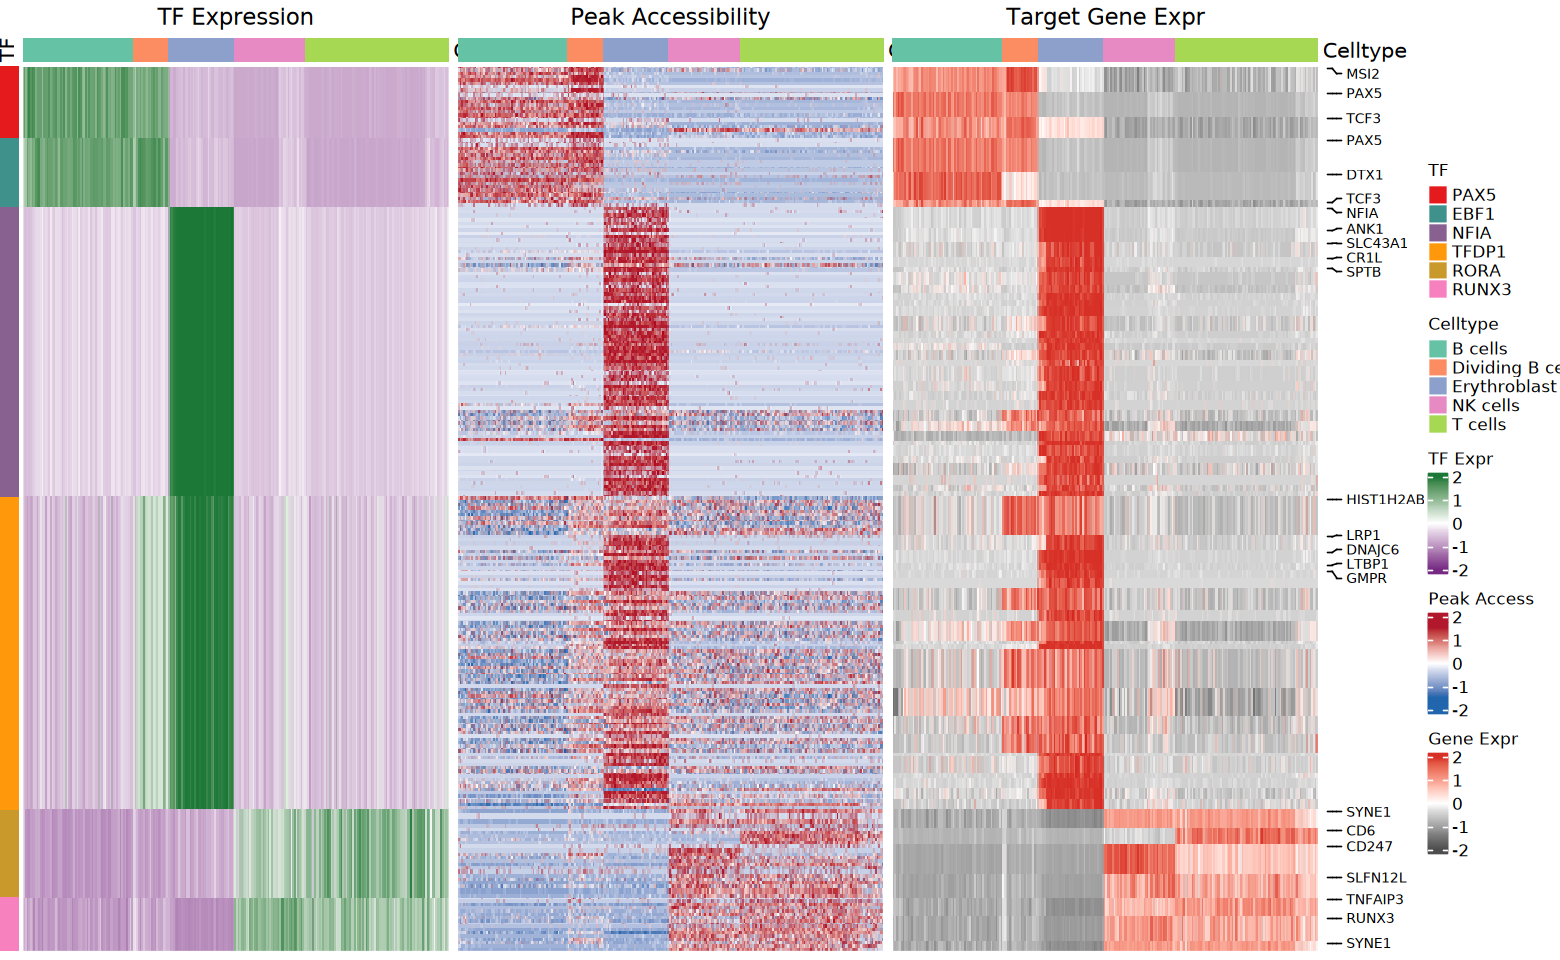
For core TFs, plot the expression co-variation heatmap of all their target genes at the single-cell level, displayed grouped by cell type.
Plot Interpretation
- Rows (genes): All high-confidence target genes of this TF
- Columns (cells): Arranged by cell type groups, with top color bar identifying cell types
- Color gradient: Represents Z-score normalized values of gene expression levels, red indicates high expression, blue indicates low expression
- Clustering: Both rows and columns undergo hierarchical clustering, revealing co-expression modules of target genes and expression differences between cell types
Analysis Points
- Co-expression module identification: Target gene groups showing similar expression patterns in the heatmap may participate in the same biological pathway or be co-regulated.
- Cell type specificity: By observing expression differences between different cell types, cell type-specific regulatory patterns of the TF can be identified.
Core TF Target Gene Subgroup-Specific Expression Heatmap
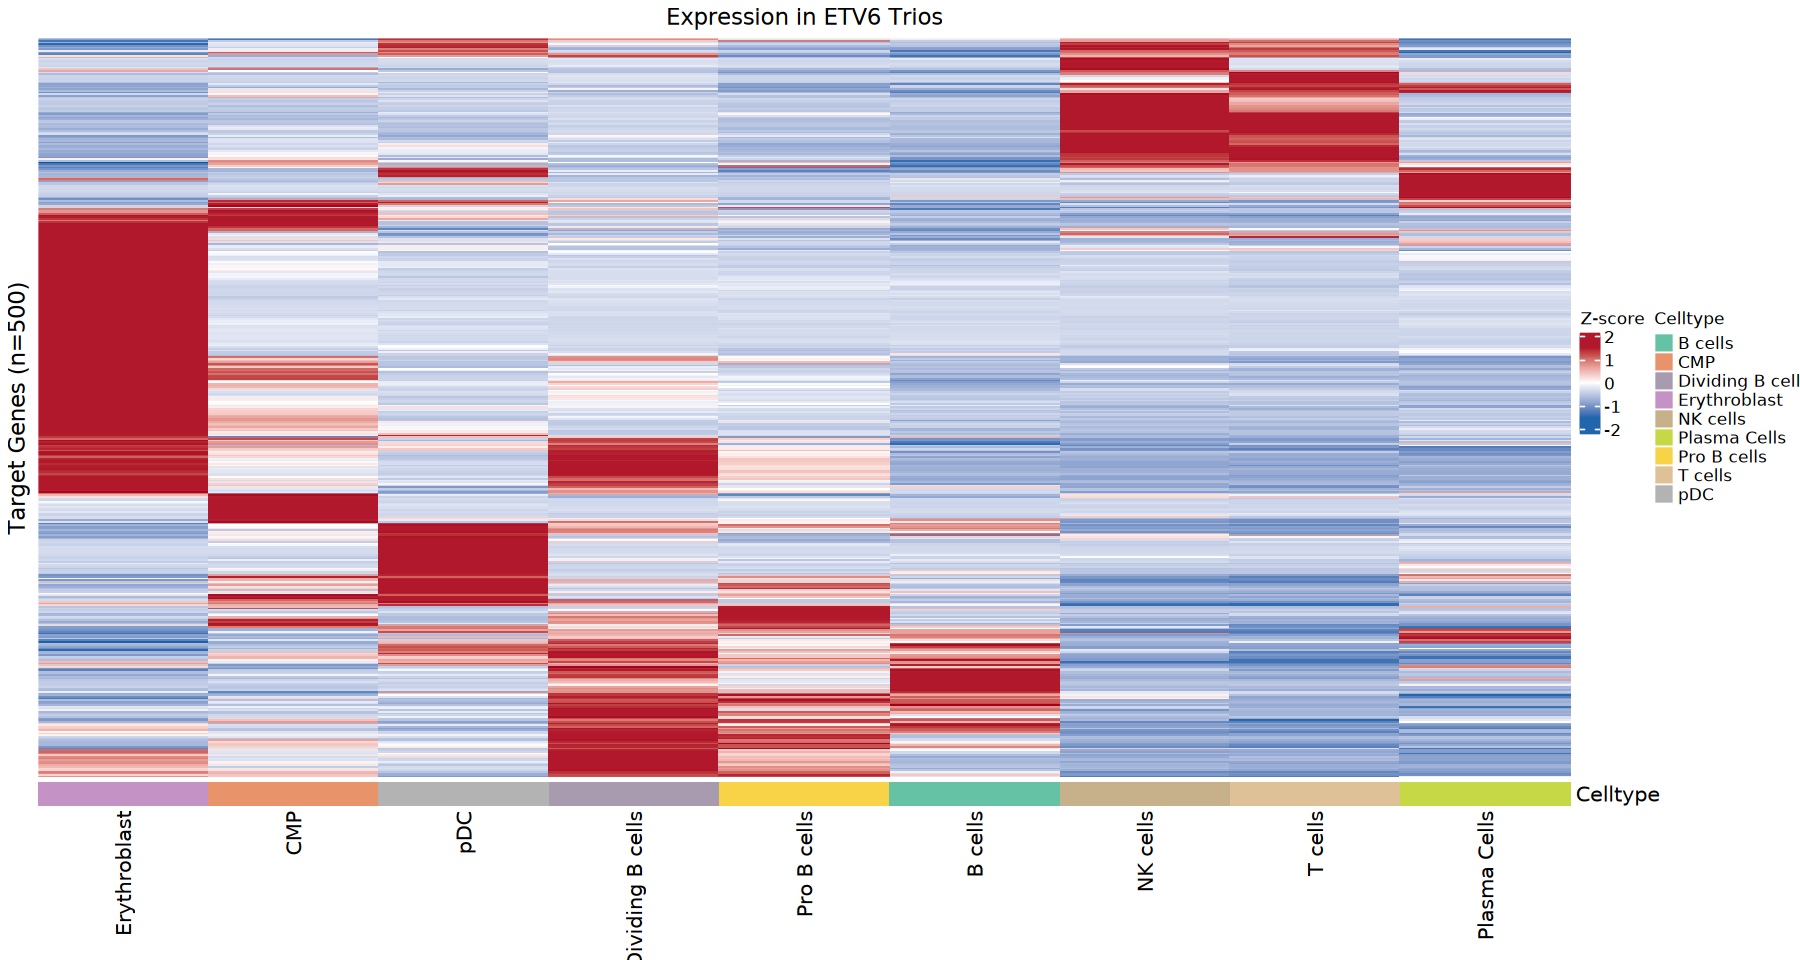
For a single core TF, plot the specific expression heatmap of its target gene group in each cell subgroup, intuitively displaying the cell type distribution of regulatory activity.
Plot Interpretation
- Rows (genes): Target genes of this TF
- Columns (cell types): Each cell subgroup
- Color gradient: Represents average expression levels of target genes in each cell type (Z-score normalized)
- Specificity patterns: Target gene groups with high expression in certain cell types represent the TF's specific regulatory programs in those cell types
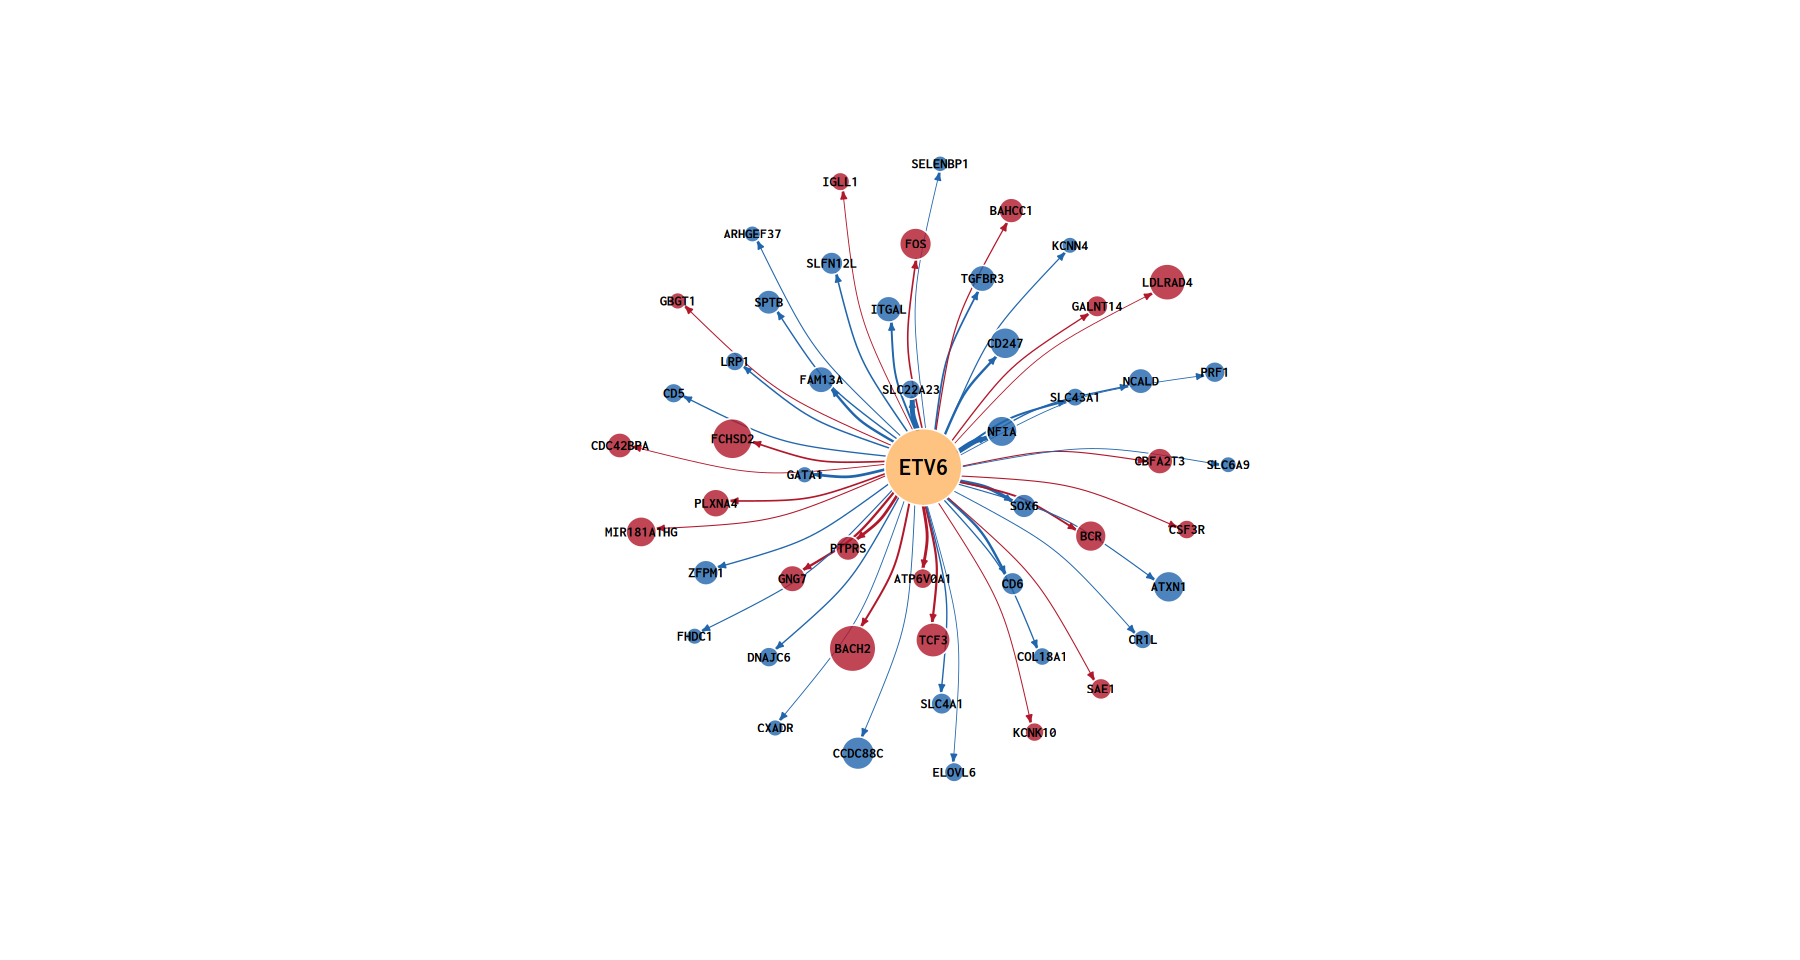
TF–Target Regulatory Network Diagram
Visualize the regulatory relationship between core TF and their high-confidence target genes in network diagram format, displaying the regulatory target topology of the TF.
Plot Interpretation
- Central node (large circle): Core TF
- Peripheral nodes (small circles): Target genes, color indicates regulatory direction (red=activation, blue= repression)
- Lines: TF–target gene regulatory relationships, line thickness proportional to Linkage Score
Analysis Points
- Hub TF identification: TFs with many target genes and high Linkage Score are key hubs in the regulatory network.
- Regulatory direction distribution: By observing the proportion of activator and repressor target genes, the overall regulatory pattern of the TF can be inferred.
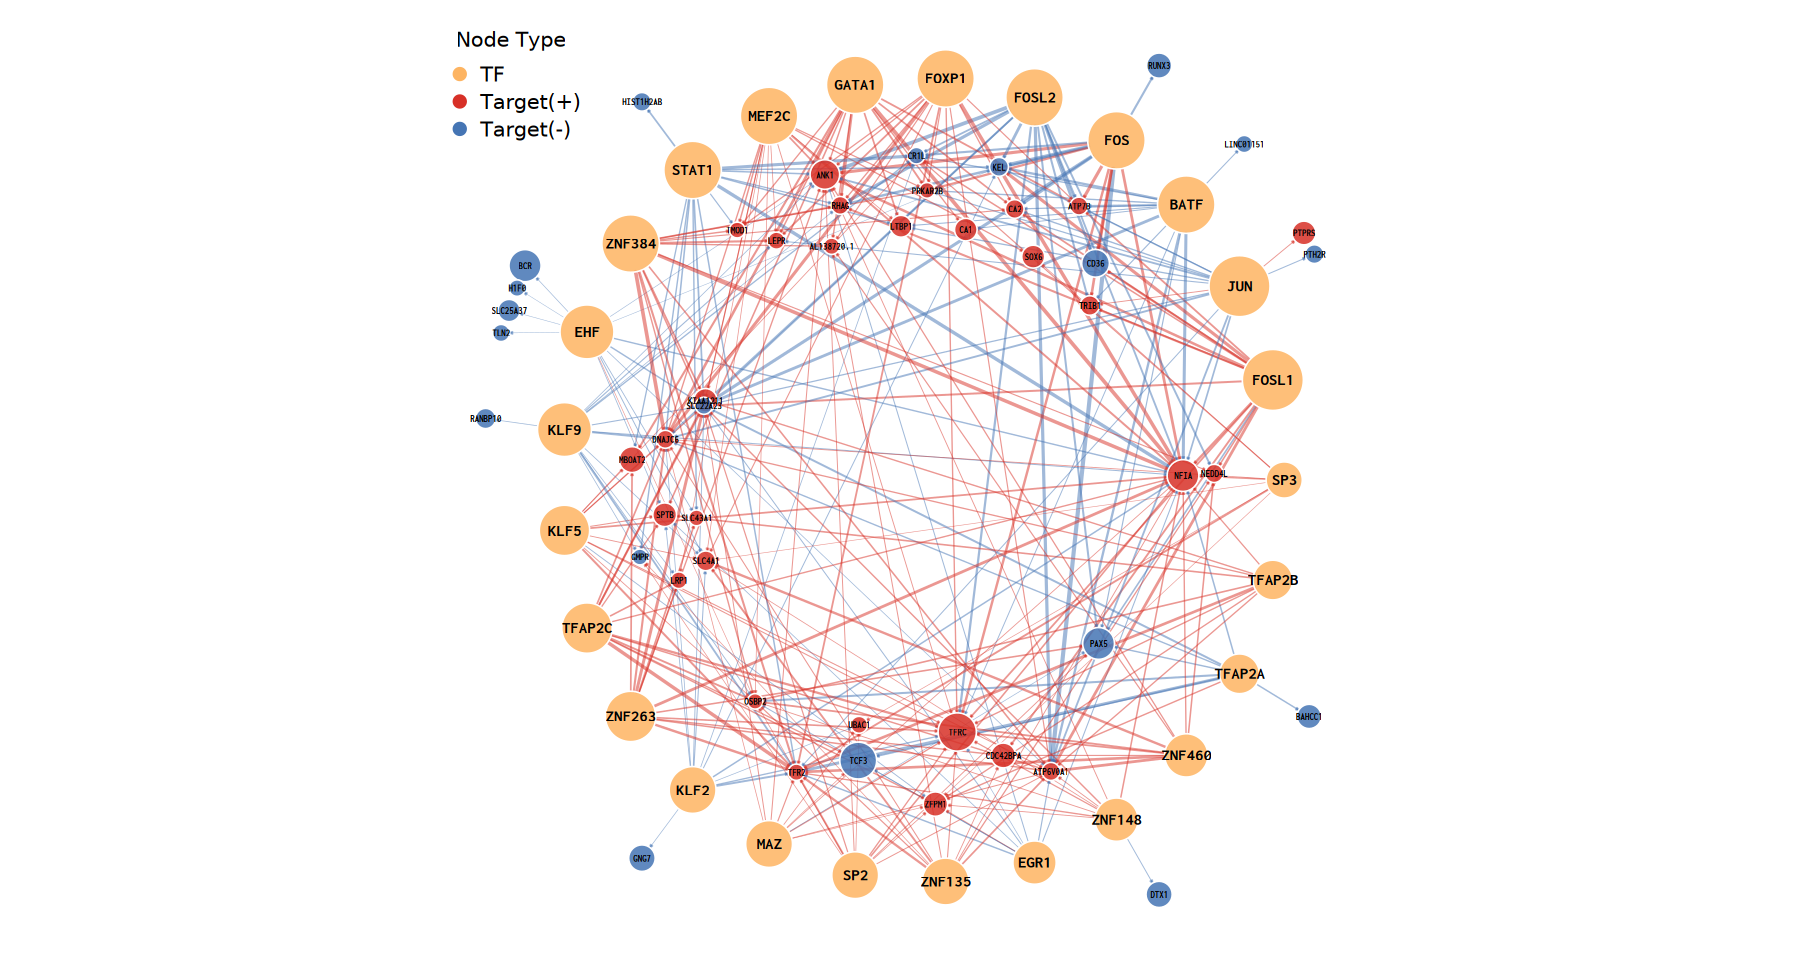
Global Multi-Transcription Factor Coordinated Regulatory Network Diagram
Integrate the regulatory relationships of all core TF and their target genes into a global network diagram, revealing coordinated regulatory relationships among multiple TFs.
Plot Interpretation
- Nodes: Large nodes represent TFs, small nodes represent target genes; different TFs distinguished by different colors
- Lines: TF–target gene regulatory relationships
- Shared target genes: Target genes co-regulated by multiple TFs are located at the network center, possibly at the intersection of multiple regulatory pathways
Analysis Points
- Coordinated regulation identification: Multiple TFs co-regulating the same target gene group may form coordinated regulatory modules.
- Regulatory hubs: Genes located at the network center and co-targeted by multiple TFs may be key cell fate decision genes.
- Functional redundancy: Multiple TFs targeting the same target gene group may suggest functional redundancy or backup regulatory mechanisms.
Result File List
| File Name | Content Description |
|---|---|
TF_Peak_Gene_Trios_all.txt | Complete Trios table, containing all initially assembled TF–Peak–Gene combinations and their multi-dimensional statistical indicators. |
TF_Peak_Gene_Trios_all_filter.txt | High-confidence Trios table, core regulatory relationships after multi-dimensional threshold filtering. |
TF_Targets_Scatters/ | Directory of core TF target gene regulatory scatter plots (one PDF/PNG per TF). |
TF_Targetcds_Heatmaps/ | Directory of core TF target gene co-variation heatmaps (one PDF/PNG per TF). |
TF_Targets_Networks/ | Directory of core TF regulatory network diagrams (one PDF/PNG per TF). |
All_TFs_network.pdf/png | Global multi-transcription factor coordinated regulatory network diagram. |
Important Notes
1. Dependency on upstream analysis: TF–Peak–Gene Trios analysis must depend on the output results of the Peak2Gene module. Please ensure Peak2Gene analysis is completed first, and pass Gene2PeakLinks.xls and output.rds as input.
2. Necessity of Motif annotation and chromVAR activity: The input Seurat object must contain Motif annotation (AddMotifs) and chromVAR TF activity matrix. Missing these two will cause some dimensions to be unable to calculate, affecting filtering effects.
3. Multi-dimensional threshold balance: Multiple thresholds such as Motif Score, triple correlation, and Linkage Score jointly determine the final number of retained Trios. It is recommended to use default thresholds first, then adjust based on result quality. Overly strict thresholds may lose true regulatory relationships, overly lenient thresholds may introduce false positives.
4. Linkage Score dynamic threshold: The platform uses adaptive dynamic thresholds (90th percentile) for Linkage Score filtering, ensuring retained Trios are always the top core network with the most significant regulatory effects.
5. Caution in negative correlation interpretation: "Negative correlation" in TF–Gene or TF activity–target gene cannot be directly equated with "direct physical inhibition". It may be caused by temporal misalignment on the developmental trajectory, TF activating an intermediate repressor (indirect effect), etc. Definitive regulatory direction still requires experimental validation.
6. Cell count requirements: Calculation of TF–Gene correlation and TF activity–target gene correlation requires sufficient cell count to ensure statistical power. Too few cells will lead to unstable correlation estimates.
7. Result interpretation requires biological knowledge integration: Trios analysis infers statistical regulatory relationships, which need to be validated with known biological knowledge and literature. Inferred regulatory relationships may be direct or indirect, and may also have cell state-dependent regulatory patterns.
Frequently Asked Questions (FAQ)
Q1: What is the difference between Trios analysis and Peak2Gene analysis?
A: The two focus on different regulatory levels, but results are complementary:
- Peak2Gene: Only focuses on co-variation relationships between Peak and Gene, answering "which Peaks may regulate which Genes"
- Trios: Further integrates multi-dimensional evidence such as TF–Peak physical binding, TF expression, TF activity on top of Peak2Gene, answering "which TFs regulate which Genes through which Peaks"
- Integration relationship: Trios relies on Peak2Gene output as input, being a downstream extension of Peak2Gene analysis
Q2: Why are there very few high-confidence Trios in my analysis results?
A: Possible reasons include:
- Too few cells: Leading to unstable correlation estimates, it is recommended to increase cell count
- Filtering thresholds too strict: Try lowering correlation thresholds (e.g., 0.2 → 0.1) or lowering Motif Score threshold
- chromVAR activity missing: If chromVAR results are missing in the input object, activity–expression consistency and activity–target gene correlation dimensions will be skipped, affecting filtering effects
- Incomplete Motif annotation: Ensure the input object has completed
AddMotifsoperation
Q3: How is Linkage Score calculated?
A: Linkage Score calculation formula is:
: The square of Peak2Gene correlation (peak_gene_cor), i.e., coefficient of determination, representing the proportion of target gene expression variation that Peak accessibility can explain - Motif Score: TF's sequence binding affinity score on that Peak
: Summation over all associated Peaks of the same TF–Gene pair, quantifying the total strength of multi-point joint regulation
The higher the Linkage Score, the more definitive the comprehensive physical evidence for the TF regulating the target gene.
Q4: Do negative correlation Trios represent repressor regulation?
A: Cannot draw conclusions directly. Negative correlation may be caused by:
- TF truly directly represses target gene transcription
- TF activates an intermediate repressor, indirectly causing target gene downregulation (indirect effect)
- Temporal misalignment on the developmental trajectory, with TF and target gene at different stages of differentiation
- Statistical noise or batch effects
It is recommended to combine known biological knowledge and literature for comprehensive judgment, and perform experimental validation when necessary.
Q5: Which downstream analyses can Trios analysis results be integrated with?
A: Trios results can be integrated with various analyses:
- SCENIC+ analysis: Cross-validate high-confidence regulatory relationships from Trios with eRegulons inferred by SCENIC+
- Motif enrichment analysis: Perform Motif enrichment on the Peak set involved in Trios to validate TF binding site activity
- Differential analysis: Integrate high-confidence Trios with differential expression/differential accessibility analysis results to identify disease or state-specific core regulatory factors
- Functional enrichment analysis: Perform GO/KEGG enrichment on target genes involved in Trios to reveal regulated biological functions
方法
References
[1] GRANJA J M, KLEMM S, MCGEOUGH L J, et al. Single-cell multiomic analysis identifies regulatory programs in mixed-phenotype acute leukemia[J]. Nature biotechnology, 2019, 37(12): 1458-1465.
[2] STUART T, SRIVASTAVA A, MADAD S, et al. Single-cell chromatin state analysis with Signac[J]. Nature methods, 2021, 18(11): 1333-1341.
[3] SCHEP A N, WU B, BUENROSTRO J D, et al. chromVAR: inferring transcription-factor-associated accessibility chromatin using single-cell data[J]. Genome biology, 2017, 18: 180.