SeekSoul Tools v1.0.0
SeekSoulTools is a software developed by SEEKGENE for processing single-cell transcriptome data. It is used for identifying cell barcode, genome alignment and gene quantification to obtain a feature-barcode matrix for downstream analysis, followed by cell clustering and differential analysis. This module not only supports data from SeekOne™ transcriptome kits, but also supports a variety of customized structure designs by describing the barcode.
Download
SeekSoul Tools v1.0.0 Download-SeekSoulTools - md5: d2724dc8213ec8e9d3b3872caa71c585
wget
mkdir seeksoultools.1.0.0
cd seeksoultools.1.0.0
wget -c -O seeksoultools.1.0.0.tar.gz "https://seekgene-public.oss-cn-beijing.aliyuncs.com/software/seeksoultools/seeksoultools.1.0.0.tar.gz"
curl
mkdir seeksoultools.1.0.0
cd seeksoultools.1.0.0
curl -C - -o seeksoultools.1.0.0.tar.gz "https://seekgene-public.oss-cn-beijing.aliyuncs.com/software/seeksoultools/seeksoultools.1.0.0.tar.gz"
Installation Guide
Installation:
# decompress
tar zxf seeksoultools.1.0.0.tar.gz

# install
source ./bin/activate
./bin/conda-unpack

# export path in bashrc
export PATH=`pwd`/bin:$PATH
echo "export PATH=$(pwd)/bin:\$PATH" >> ~/.bashrc
IMPORTANT
Please make sure the conda environment is properly configured before installation to avoid conflicts with other bioinformatics software environments.
TIP
It is recommended to add PATH to ~/.bashrc for convenient command line usage later.
Confirm installation:
seeksoultools --versionTutorials
Data preparation
Download sample datasets
sample datasets - md5: 6601c8f3c4c827d2a30fcb5c6d0dee7c (Species: Homo sapiens.)
wget
wget -c -O demo3k.tar "https://seekgene-public.oss-cn-beijing.aliyuncs.com/software/data/demodata/demo3k.tar"
# decompress
tar xf demo3k.tar
curl
curl -C - -o demo3k.tar "https://seekgene-public.oss-cn-beijing.aliyuncs.com/software/data/demodata/demo3k.tar"
# decompress
tar xf demo3k.tar
Download and build reference genome
Download-human-reference-GRCh38 - md5: 5473213ae62ebf35326a85c8fba6cc42
wget
mkdir -p /demo/refdata/
cd /demo/refdata/
wget -c -O GRCh38.tar.gz "https://seekgene-public.oss-cn-beijing.aliyuncs.com/software/data/reference/GRCh38.tar.gz"
# decompress
tar -zxvf GRCh38.tar.gz
curl
mkdir -p /demo/refdata/
cd /demo/refdata/
curl -C - -o GRCh38.tar.gz "https://seekgene-public.oss-cn-beijing.aliyuncs.com/software/data/reference/GRCh38.tar.gz"
# decompress
tar -zxvf GRCh38.tar.gz
The assembly of the reference genome refers to How to build reference genome?
CAUTION
Please ensure sufficient disk space when downloading and extracting the reference genome to avoid file corruption and subsequent analysis failure.
Run Seeksoultools
Run tests
Example 1: Basic usage
mkdir -p /demo/myproject/
cd /demo/myproject/
seeksoultools rna run \
--fq1 /demo/data/demo3k_R1_001.fastq.gz \
--fq2 /demo/data/demo3k_R2_001.fastq.gz \
--samplename demo3k \
--outdir /demo/myproject/ \
--genomeDir /demo/refdata/GRCh38-3.0.0/star \
--gtf /path/demo/refdata/GRCh38-3.0.0/genes/genes.gtf \
--chemistry MM \
--core 4
Example 2: Specify a different version of STAR for analysis. Make sure that the STAR version is compatible with the –genomeDir.
mkdir /demo/myproject/
cd /demo/myproject/
seeksoultools rna run \
--fq1 /demo/data/demo3k_R1_001.fastq.gz \
--fq2 /demo/data/demo3k_R2_001.fastq.gz \
--samplename demo3k \
--outdir /demo/myproject/ \
--genomeDir /demo/refdata/GRCh38/star \
--gtf /path/demo/refdata/GRCh38/genes/genes.gtf \
--chemistry MM \
--core 4 \
--star_path /path/to/cellranger-5.0.0/lib/bin/STAR
NOTE
The --star_path parameter must strictly match the reference genome index version, otherwise alignment will fail.
Example 3: A sample has multiple sets of fastq files
mkdir /demo/myproject/
cd /demo/myproject/
seeksoultools rna run \
--fq1 /demo/data/demo_S1_L001_R1_001.fastq.gz \
--fq1 /demo/data/demo_S1_L002_R1_001.fastq.gz \
--fq2 /demo/data/demo_S1_L001_R2_001.fastq.gz \
--fq2 /demo/data/demo_S1_L002_R2_001.fastq.gz \
--samplename demo \
--outdir /demo/myproject/ \
--genomeDir /demo/refdata/GRCh38/star \
--gtf /demo/refdata/GRCh38/genes/genes.gtf \
--chemistry MM \
--core 4
Example 4: Customize the structure of R1
seeksoultools rna run \
--fq1 /demo/data/demo3k_R1_001.fastq.gz \
--fq2 /demo/data/demo3k_R2_001.fastq.gz \
--samplename demo \
--outdir /demo/myproject/ \
--genomeDir /demo/refdata/GRCh38/star \
--gtf /demo/refdata/GRCh38/genes/genes.gtf \
--barcode /demo/utils/CLS1.txt \
--barcode /demo/utils/CLS2.txt \
--barcode /demo/utils/CLS3.txt \
--linker /demo/utils/Linker1.txt \
--linker /demo/utils/Linker2.txt \
--structure B9L12B9L13B9U8 \
--core 4- The structure of read1 is represented by
B9L12B9L13B9U8, which means it consists of three sections of cell barcode, each with 9 bases, and a UMI section with 8 bases. The linker section between the cell barcode and UMI consists of two parts, with the first part being 12 bases and the second part being 13 bases - Use
--barcodeto specify the three sections of barcodes sequentially, and use--linkerto specify the two sections of linkers sequentially.
TIP
When using a custom structure, it is recommended to test the structure parameters with a small sample first to ensure correct extraction of barcode/linker/UMI.
Parameter descriptions
| Parameters | Descriptions |
|---|---|
| --fq1 | Paths to R1 fastq files. |
| --fq2 | Paths to R2 fastq files. |
| --samplename | Sample name. A directory will be created named after the sample name in the outdir directory. Only digits, letters, and underscores are supported. |
| --outdir | Output directory. Default: ./ |
| --genomeDir | The path of the reference genome generated by STAR. The version needs to be consistent with the STAR used by seeksoultools. |
| --gtf | Path to the GTF file for the corresponding species. |
| --core | Number of threads used for the analysis. |
| --chemistry | Reagent type, with each type corresponding to a combination of--shift,--pattern, --structure, --barcode, and --sc5p,Available options: DDV1, DDV2, DD5V1, MM, MM-D, DD-Q. DDV1 corresponds to the 3' transcriptome-seq kit V1 reagent for the DD platform. DDV2 corresponds to the 3' transcriptome-seq kit V2 reagent for the DD platform. DD5V1 corresponds to the 5' transcriptome-seq kit V1 reagent for the DD platform. MM corresponds to the 3' transcriptome-seq kit reagent for the MM platform. MM-D corresponds to the large-well transcriptome-seq kit for the MM platform. DD-Q corresponds to the full-length rna sequence transcriptome-seq kit for the DD platform. |
| --skip_misB | If enabled, no base mismatch is allowed for barcode. Default is 1. |
| --skip_misL | If enabled, no base mismatch is allowed for linker. Default is 1. |
| --skip_multi | If enabled, discard reads that can be corrected to multiple white-listed barcodes. Barcodes are corrected to the barcode with the highest frequency by default. |
| --expectNum | Estimated number of captured cells. |
| --forceCell | When number of cells obtained from analysis is abnormal, add this parameter with expected value N. Seeksoultools will select the top N cells based on UMI from high to low. |
| --include-introns | When disabled, only exon reads are used for quantification. When enabled, intron reads are also used for quantification. |
| --star_path | Path to another version of STAR for alignment. The version must be compatible with the--genomeDirversion. The default--star_pathis the STAR in the environment. |
Output descriptions
./
├── demo_report.html                        1
├── demo_summary.csv                        2
├── demo_summary.json
├── step1
│   └──demo_2.fq.gz
├── step2
│   ├── featureCounts
│   │   └── demo_SortedByName.bam
│   └── STAR
│       ├── demo_Log.final.out
│       └── demo_SortedByCoordinate.bam
├── step3
│   ├── filtered_feature_bc_matrix          3
│   └── raw_feature_bc_matrix
└──step4
    ├── FeatureScatter.png
    ├── FindAllMarkers.xls
    ├── mito_quantile.xls
    ├── nCount_quantile.xls
    ├── nFeature_quantile.xls
    ├── resolution.xls
    ├── top10_heatmap.png
    ├── tsne.png
    ├── tsne_umi.png
    ├── tsne_umi.xls
    ├── umap.png
└── VlnPlot.png- Final report in html
- Quality control information in csv
- Filtered feature-barcode matrix
Algorithms Overview
step1: barcode/umi extraction
Seeksoultools is able to extract the barcode and UMI sequences based on different Read1 structures. The pipeline processes the barcodes and filters Read1 and its corresponding Read2, and an updated fastq file is generated at the end of step 1.
Structure design and description
Barcode and umi descriptions: Describing the basic structure of Read1 using letters and numbers, where the letters represent the meaning of the nucleotides and the numbers represent the length of the nucleotides.
B: barcode bases L: linker bases U: umi bases X: other arbitrary bases used as placeholders
Taking the following two Read1 structures as examples: B8L8B8L10B8U8:

B17U12:

Anchor-based misalignment design: In MM design, to increase the base balance of the linker portion during sequencing,1-4 bp shifted bases, called anchors, were added. The anchor determines the starting position of the barcode.

Workflow
Anchor determination:
For data with misaligned Read1 (produced by MM reagents), seeksoultools attempts to find the anchor sequence within the first 7 bases of the Read1 sequence to determine the start position of subsequent barcodes. If the anchor sequence is not found, the corresponding Read1 and R2 are considered invalid reads.
Barcode and linker correction:
After determining the starting position of the barcode, the corresponding sequence is extracted based on the structural design. When the extracted barcode sequence is found in the whitelist, it is considered a valid barcode and the read count with valid barcodes is recorded. When the barcode is not found in the whitelist, it is considered an invalid barcode.
During sequencing process, there is a certain probability that sequencing error occurs. With the presense of a whitelist, seeksoultools are able to do barcode correction. When correction is enabled, if sequences that are one base differ (one humming distance apart) from the invalid barcode appear in the whitelist, we will consider the following circumstances:
- If there is one and only sequence exists in the whitelist, we will correct the invalid barcode to the barcode in the whitelist.
- If multiple sequences exist in the whitelist, we will correct the invalid barcode to the sequence with the highest read support.
The logic of linker correction is the same as that of barcode correction.
Adaptors and polyA sequence trimming
In transcriptome, polyA tail and Adapter sequences introduced during library preparation, may appear at the end of Read2.We remove these contaminating sequences and make sure the trimmed Read2 length is greater than the minimum length for accurate alignment afterward. If the trimmed Read2 length is less than the minimum length, we consider the read to be invalid.
After the processing procedure described above, the data composition is shown in the following figure:
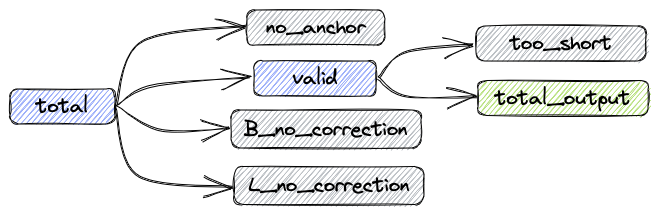
- total: Total reads
- valid: Number of reads without correction and number of successfully corrected reads
- B_corrected: Number of successfully corrected reads
- B_no_correction: Number of reads with incorrect barcodes
- L_no_correction: Number of reads with incorrect linkers
- no_anchor:Number of reads without anchors
- trimmed: Number of reads that have been trimmed
- too_short: Number of reads that are shorter than 60bps after trimming
The relationships between the metrics are as follows:
total = valid + no_anchor + B_no_correction + L_no_correction
Number of reads in the updated FASTQ file: total_output = valid - too_short
step2: Alignment
Sequence Alignment
- Seeksoultools uses an aligner software called STAR to perform splicing-aware alignment of reads to the genome.
- After the alignment procedure has mapped the reads to the genome, seeksoultools uses another software called qualimap along with a gene annotation transcript file GTF to bucket the reads into exonic, intronic, and intergenic regions.
- Using featureCounts, the reads aligned to the genome were annotated to genes, with different rules such as strand specificity and features used for annotation. When using exon for annotation, a read is annotated to the corresponding gene if over 50% of its bases are aligned to the exon. When using transcripts for annotation, a read is annotated to the corresponding gene if over 50% of its bases are aligned to the transcript.
After the processing procedure described above, the metrics is shown below:
- Reads Mapped to Genome: Fraction of reads that aligned to the genome (including both uniquely mapped reads and multi-mapped reads)
- Reads Mapped Confidently to Genome: Fraction of reads that uniquely mapped to the genome
- Reads Mapped to Intergenic Regions:Fraction of reads that mapped to intergenic regions
- Reads Mapped to Intronic Regions:Fraction of reads that mapped to intronic regions
- Reads Mapped to Exonic Regions:Fraction of reads that mapped to exonic regions
step3: Counting
UMI counting
Seeksoultools extracts group of reads that shared the same barcode from output BAM file and counts the number of UMIs annotated to genes and the number of reads corresponding to each UMI.
- Filter out reads whose UMIs consist of repetitive bases. For example, TTTTTTTT.
- Filter out reads that mapped to multiple genomes.
UMI correction
UMIs may also have sequencing errors during sequencing process. By default, seeksoultools uses the adjacencyfrom UMI-tools to correct UMIs.
 Image source: https://umi-tools.readthedocs.io/en/latest/the_methods.html
Cell calling
In a cell population, we assume that the mRNA content of cells does not differ significantly. If the mRNA content of a barcode is very low, we consider that barcode might be 'empty', and the mRNA comes from the background. Seeksoultools uses the following steps to determine whether a barcode has a cell:
- Sort all barcodes in descending order based on their corresponding UMI counts.
- The threshold is calculated by dividing the number of UMIs for the barcode at the 1% position of the estimated cells by 10.
- Barcodes with UMIs greater than the threshold are considered to be cells.
- If the UMI of a barcode is less than the threshold but greater than 300, DropletUtils is used for further analysis. The DropletUtils method first assumes that barcodes with UMI counts below 100 are empty droplets. It then uses the total UMI count for each gene in each droplet as the expected UMI count for that gene in the background RNA expression profile. Next, it performs a statistical test on the UMI counts of each barcode, identifying those with significant differences as cells.
- Those do not meet the above criteria are considered as background.
After the processing procedure described above, the metrics is shown below:
- Estimated Number of Cells: Total number of cells by cell calling
- Fraction Reads in Cells: Fraction of reads after cell calling among all reads used for counting
- Mean Reads per Cell: Average number of reads per cell, Total number of reads/Number of cells after cell calling
- Median Genes per Cell: Median gene count in barcodes after cell calling
- Median UMI Counts per Cell: Median UMI count in barcodes after cell calling
- Total Genes Detected: Number of genes detected in all cells
- Sequencing Saturation: 1 - Total UMI count/Total read count
step4: Downstream analysis
Seeksoultools perform downstream analysis when we have gene expression matrix from step3.
Seurat analysis
Seeksoultools use Seurat to calculate the mitochondrial content, number of genes, and UMIs of each cell. After that, the gene expression matrix is normalized, and a subset of features that exhibit high cell-to-cell variation in the dataset is identified. Linear dimensional reduction using PCA is then performed, and the result is passed to t-SNE and UMAP for visualization. A graph-based clustering procedure is then followed, and cells are partitioned into different clusters. Finally, seeksoultools finds markers that define clusters via differential expression.