
16S Basic Statistics Analysis
Preface
TIP
The 16S_basic_statistics module focuses on the joint analysis of host single-cell transcriptome and single-cell microbiome data. By integrating single-cell microbial detection matrices (phylum, class, order, family, genus, etc.) into a host single-cell (Seurat) object, this module not only supports multi-dimensional basic statistics and visualization and targeted tracking of microbes of interest (bac_list), but also provides deeper microbe-host association analysis—screening significantly enriched candidate core microbes using statistical methods, and combining host transcriptome data to investigate how microbe-positive status influences target-cell microenvironments and functional pathways.
A growing body of research has shown that microbes are important components of disease microenvironments, including tumors. For example, gut microbiota can promote dendritic cell (DC) maturation and activate antigen-specific T cells in distal tumor microenvironments, thereby enhancing antitumor immunity. The SeekSoul Online 16S_basic_statistics module is designed for this purpose: it automates thawing and downloading of microbial detection matrices from Alibaba Cloud OSS, matrix merging, relative abundance calculation, candidate microbe screening, host differential and enrichment analysis, UMAP visualization, and report generation, substantially lowering the bioinformatics barrier for host-microbe association studies.
Theoretical Basis of 16S Basic Statistics
Core Principles
- Status check and matrix download: The module automatically parses OSS paths provided in
sample_list_infoand checks ColdArchive status in the background. If files are frozen, it automatically submits Restore requests, waits for thaw completion, and then downloads in parallel to ensure data integrity for downstream analysis. - Multi-modal data integration: The base single-cell transcriptome file is loaded, and the downloaded single-cell microbial detection matrix is appended as an independent Assay into the Seurat object, producing an integrated RDS with both host expression and microbial abundance.
- Multi-level basic statistics: The module performs hierarchical calculations across Global, CellType, and Sample or Group (if specified) dimensions.
- Abundance and positivity-rate calculation: All detected microbes are ranked by relative abundance. Top 10 microbes are visualized by default, and positivity rate and relative abundance are calculated for each dimension.
- Microbe-host interaction mining: Fisher's exact test and Wilcoxon rank-sum test are used to screen candidate core microbes significantly enriched in target cells or groups. Combined with transcriptomic data, DEGs between positive and negative cells are identified and pathway enrichment is performed to assess microbial effects on host microenvironments.
- Targeted extraction of microbes of interest: If
bac_listis provided, the module extracts target-microbe statistics across all levels and generates summary tables and feature-distribution plots. - Automated report rendering: According to parameter combinations (e.g., with/without group comparison, with/without
bac_list), corresponding submodules are dynamically loaded to generate a deliverable HTML report.
Key Statistical Metrics
- Positive_Cells: Number of host single cells with detected microbe signal (UMI > 0) in the current statistical scope.
- Total_Cells: Total number of host single cells in the current statistical scope.
- Infection_Rate: Microbe positivity rate (%), calculated as
(Positive_Cells / Total_Cells) * 100. - Microbe_UMI: Total UMI count assigned to the microbe.
- Total_Microbe_UMI: Sum of UMI counts of all detected microbes in the current statistical scope.
- Relative_Abundance: Relative abundance (%), calculated as
(Microbe_UMI / Total_Microbe_UMI) * 100. - Fisher exact test evaluation: A 2×2 contingency table is built from "microbe detected (positive) vs not detected (negative)" and "target cell vs non-target cell", returning metrics including
p_val,Odds_Ratio, andTarget_Pos. - Differential expression and functional enrichment: DEG screening uses
logfc.threshold = 0.25by default. GO, KEGG, and Reactome enrichment analyses are then performed, enrichment barplots are generated, and full statistical tables are exported.
SeekSoul Online Cloud Platform Guide
Pre-analysis Preparation
TIP
- Upstream standard QC, dimensionality reduction, clustering, and cell-type annotation (e.g.,
CellAnnotation) are recommended. Metadata column names and values should avoid Chinese characters and special symbols (&, spaces, etc.), otherwise the pipeline may fail. - For group comparison analysis (e.g., Tumor vs Normal), ensure the corresponding group column exists in metadata and comparison labels are correct.
- The target microbe list file (e.g.,
bac_list.txt) should be newline-separated, one microbe per line, with taxonomic prefix (e.g.,g-Rheinheimera,f-Acetobacteraceae).
Parameter Details
The table below summarizes the main parameters of the 16S_basic_statistics cloud module:
| UI Parameter | Description |
|---|---|
| Task Name | Name of the task. Must start with an English letter; Chinese characters/digits/underscores are allowed. Required. |
| Group Factor | Metadata column name for cell annotation (e.g., CellAnnotation). Required. |
| Cell Types | Specific cell types to include (e.g., T cell, NK cell, DC). Required. |
| Sample Info | Sample information to analyze, including 16S level (phylum, class, order, family, genus) and corresponding 16S matrix paths. Required. |
| Group Comparison | Defines comparison combinations. Optional. |
a. Split Factor | Label column used to define comparison groups (e.g., Group). |
b. Treatment Group | Treatment group name. |
c. Control Group | Control group name. |
| bac_list | bac_list.txt, one microbe per line with taxonomic prefix (e.g., g-Rheinheimera, f-Acetobacteraceae). Optional. |
| Remarks | Custom notes. |
Workflow
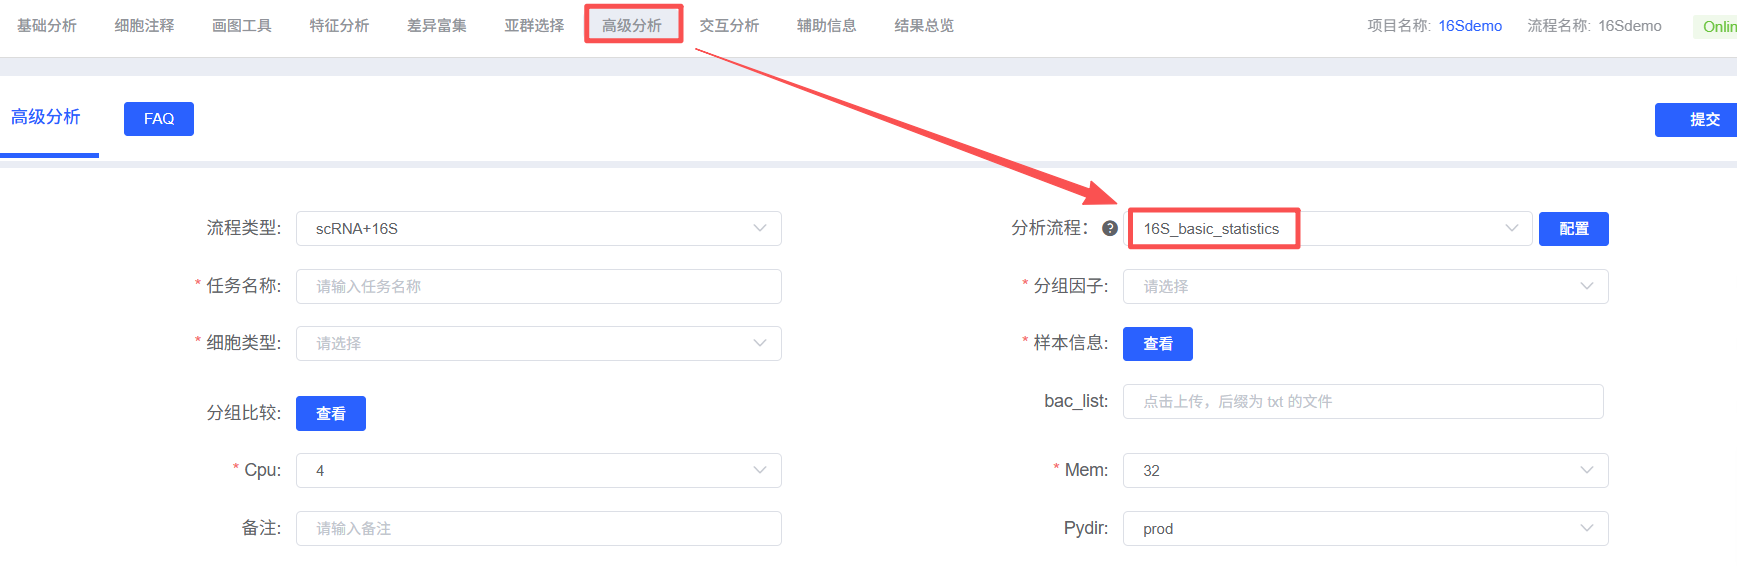
- Enter the module: In "Advanced Analysis", select
16S_basic_statistics. - Create task: Fill in task name.
- Configure input: Select sample information and 16S level; upload
bac_listif needed. - Define objects: Set group factor and cell types; configure group comparison if required.
- Submit and wait: Confirm parameters and submit the task.
- Download and review: Download report and result files from task list.
Results Interpretation
The 16S_basic_statistics report contains rich plots and result tables. Core outputs are interpreted below.
1. 16S Basic Statistics and Distribution Overview (Global Example)
1.1 Global Microbial Distribution (2×2 UMAP)
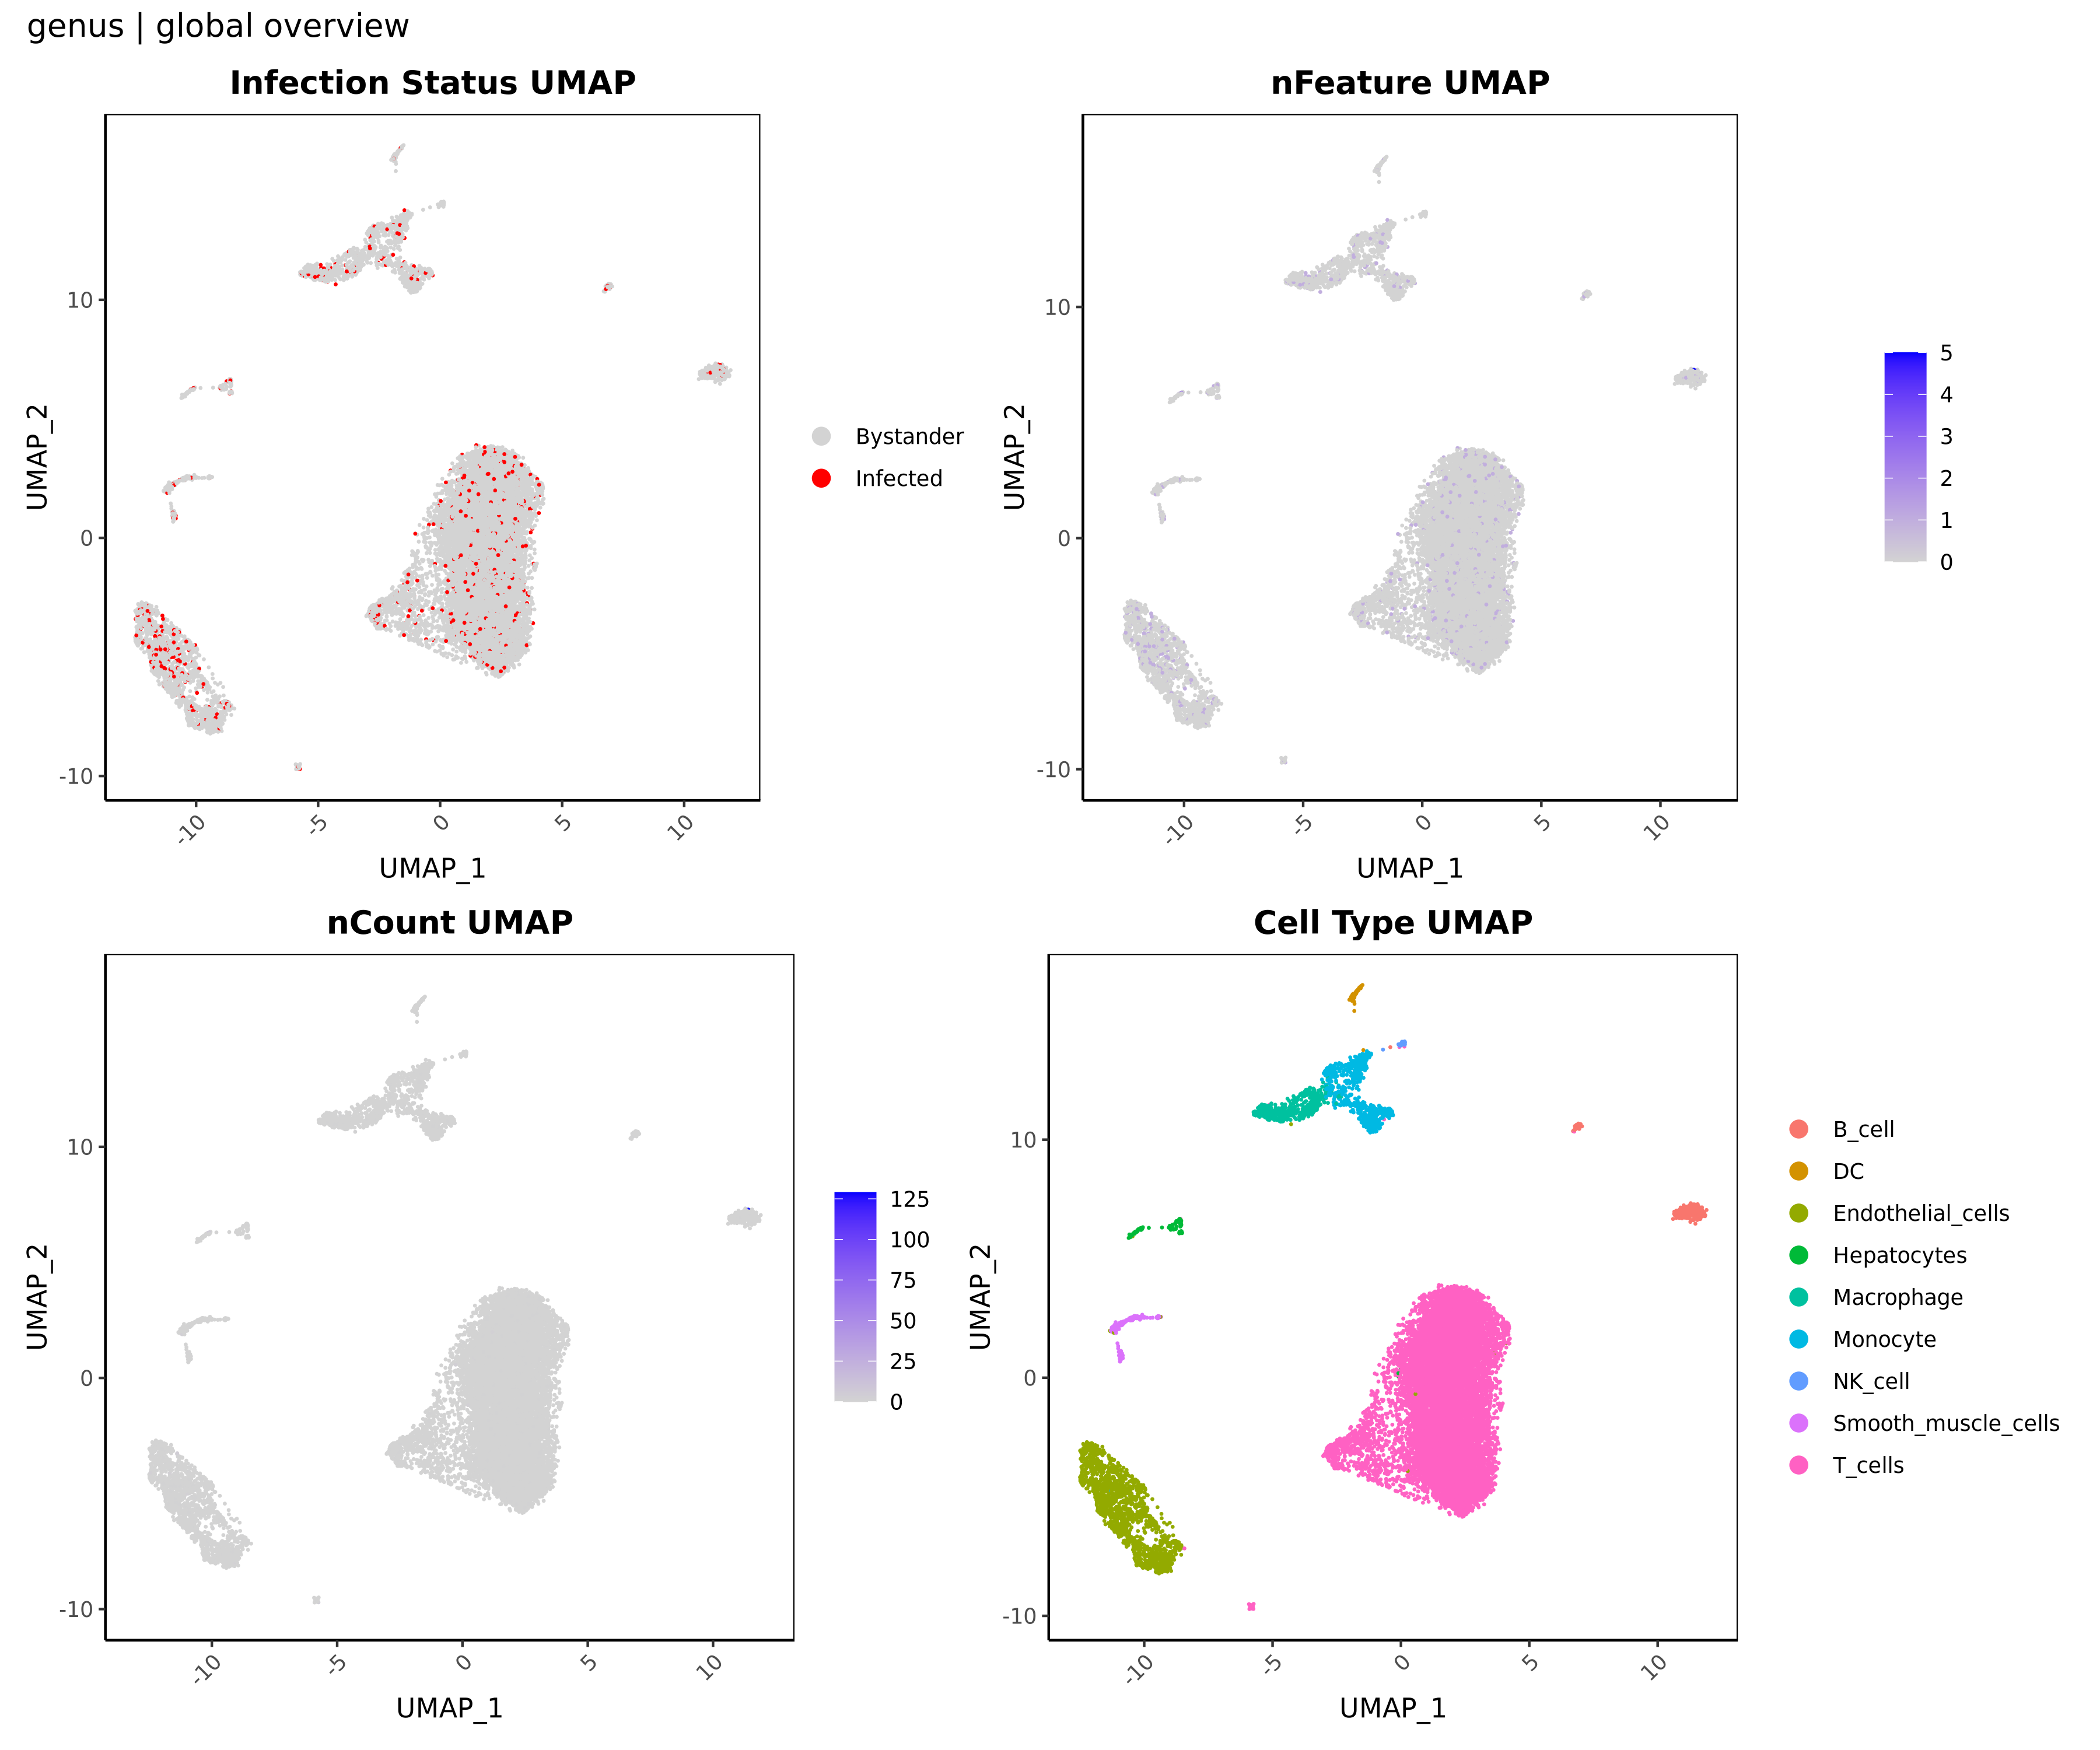
- Chart Interpretation: Each dot represents one single cell. The four panels show microbial positivity status (red = positive, gray = negative), number of detected microbial taxa (
nFeature, bluer = more taxa), total microbial UMI count (nCount, bluer = higher abundance), and the host-cell UMAP background. - Analysis Key Points: By jointly examining all four panels, you can assess whether microbial signals tend to aggregate in specific host-cell populations, providing clues for targeted downstream analysis.
💡 Multi-dimensional Support: At global level, this plot builds an overall understanding. In cell-type, sample, or group views, it automatically focuses on the corresponding subset and reveals context-specific microbial distribution patterns.
1.2 Community Relative Abundance Stacked Plot (Top 10 Microbes)
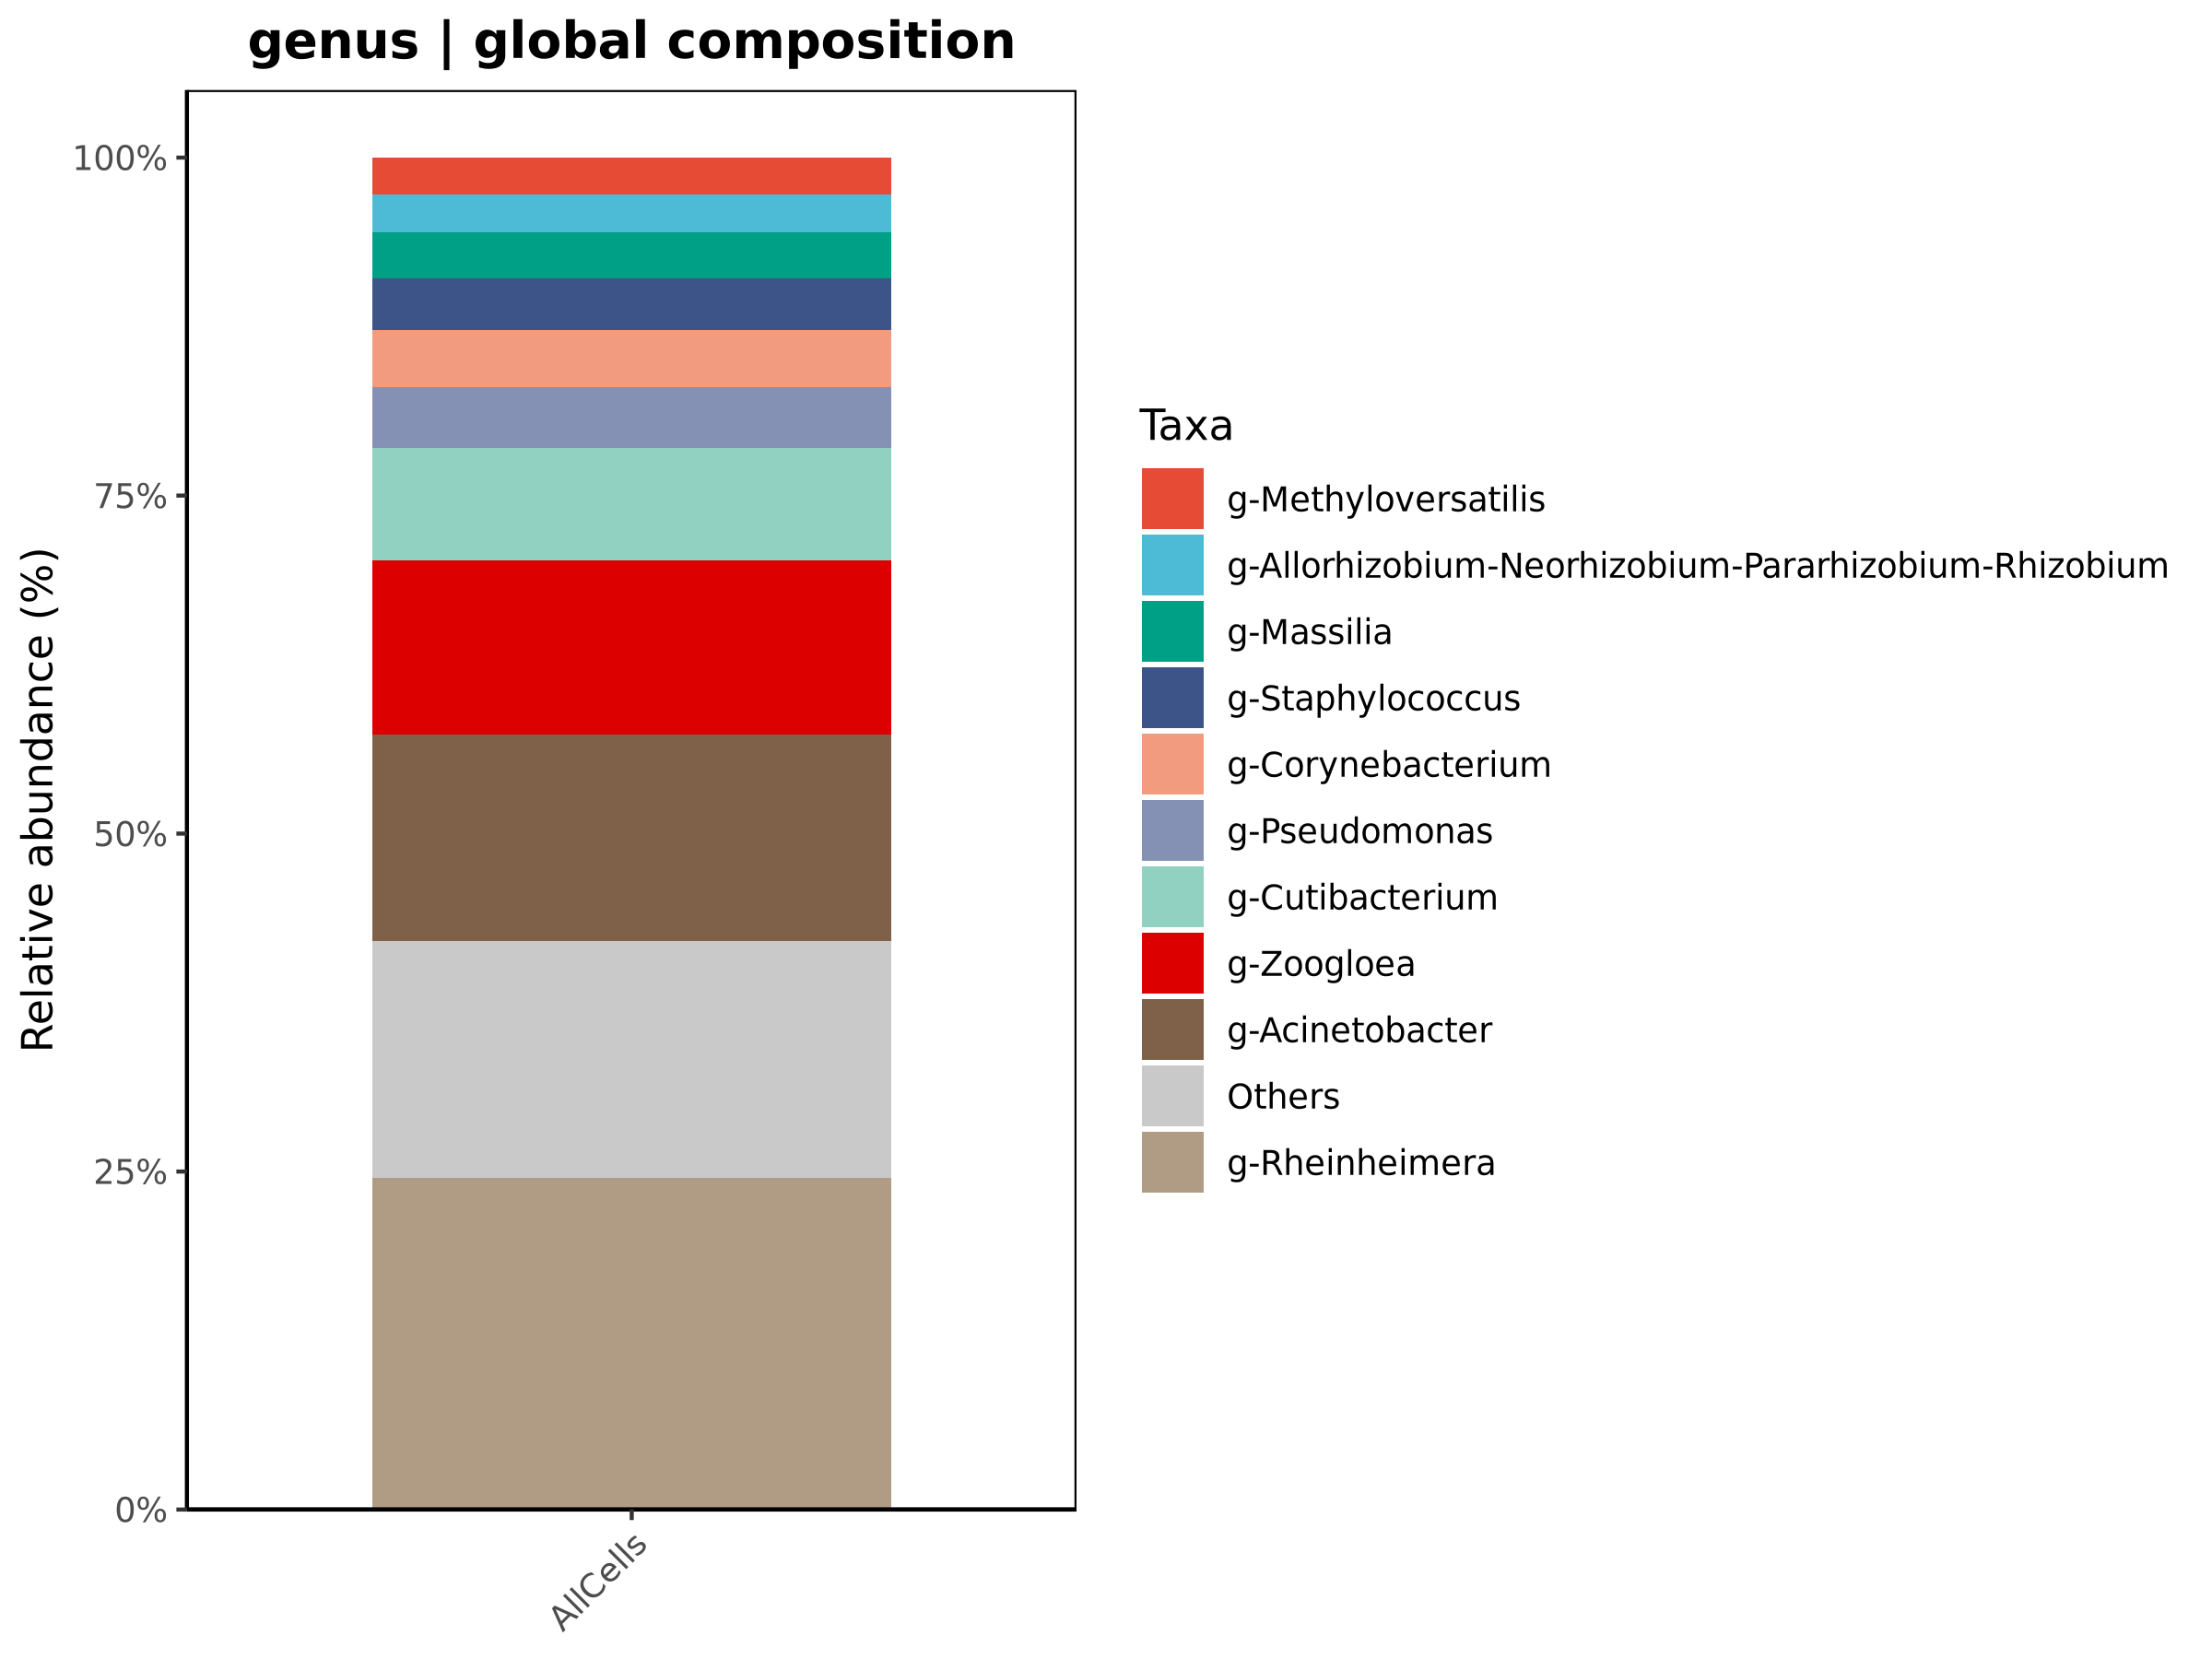
- Chart Interpretation: X-axis shows statistical units (global cells/cell types/samples/groups); Y-axis shows relative abundance (%). Different colors represent different taxa.
- Analysis Key Points: Relative block proportions provide intuitive comparison of microbial community composition across units.
💡 Multi-dimensional Support: You can inspect overall composition globally, focus on specific target cell types (e.g., macrophages), or compare community composition between disease groups.
1.3 Targeted Distribution of Individual Top Taxa (2×2 UMAP)
- Chart Interpretation: Each figure focuses on one dominant taxon and includes four panels: top-left UMI level (redder = higher), top-right positive/negative distribution (red/gray), bottom-left positivity-rate and relative-abundance barplot by cell type, and bottom-right positivity-rate and relative-abundance barplot by sample.
- Analysis Key Points: Focus on the bottom barplots. If one cell type or sample shows clearly higher bars, it suggests possible cell tropism or disease-sample enrichment.
💡 Multi-dimensional Support: Useful for identifying host-cell preference of specific microbes; for example, under cell-type view, you can directly compare detection and abundance changes across disease samples.
2. Microbe-Host Association Analysis
2.1 Core Microbe Screening (Group Mode)
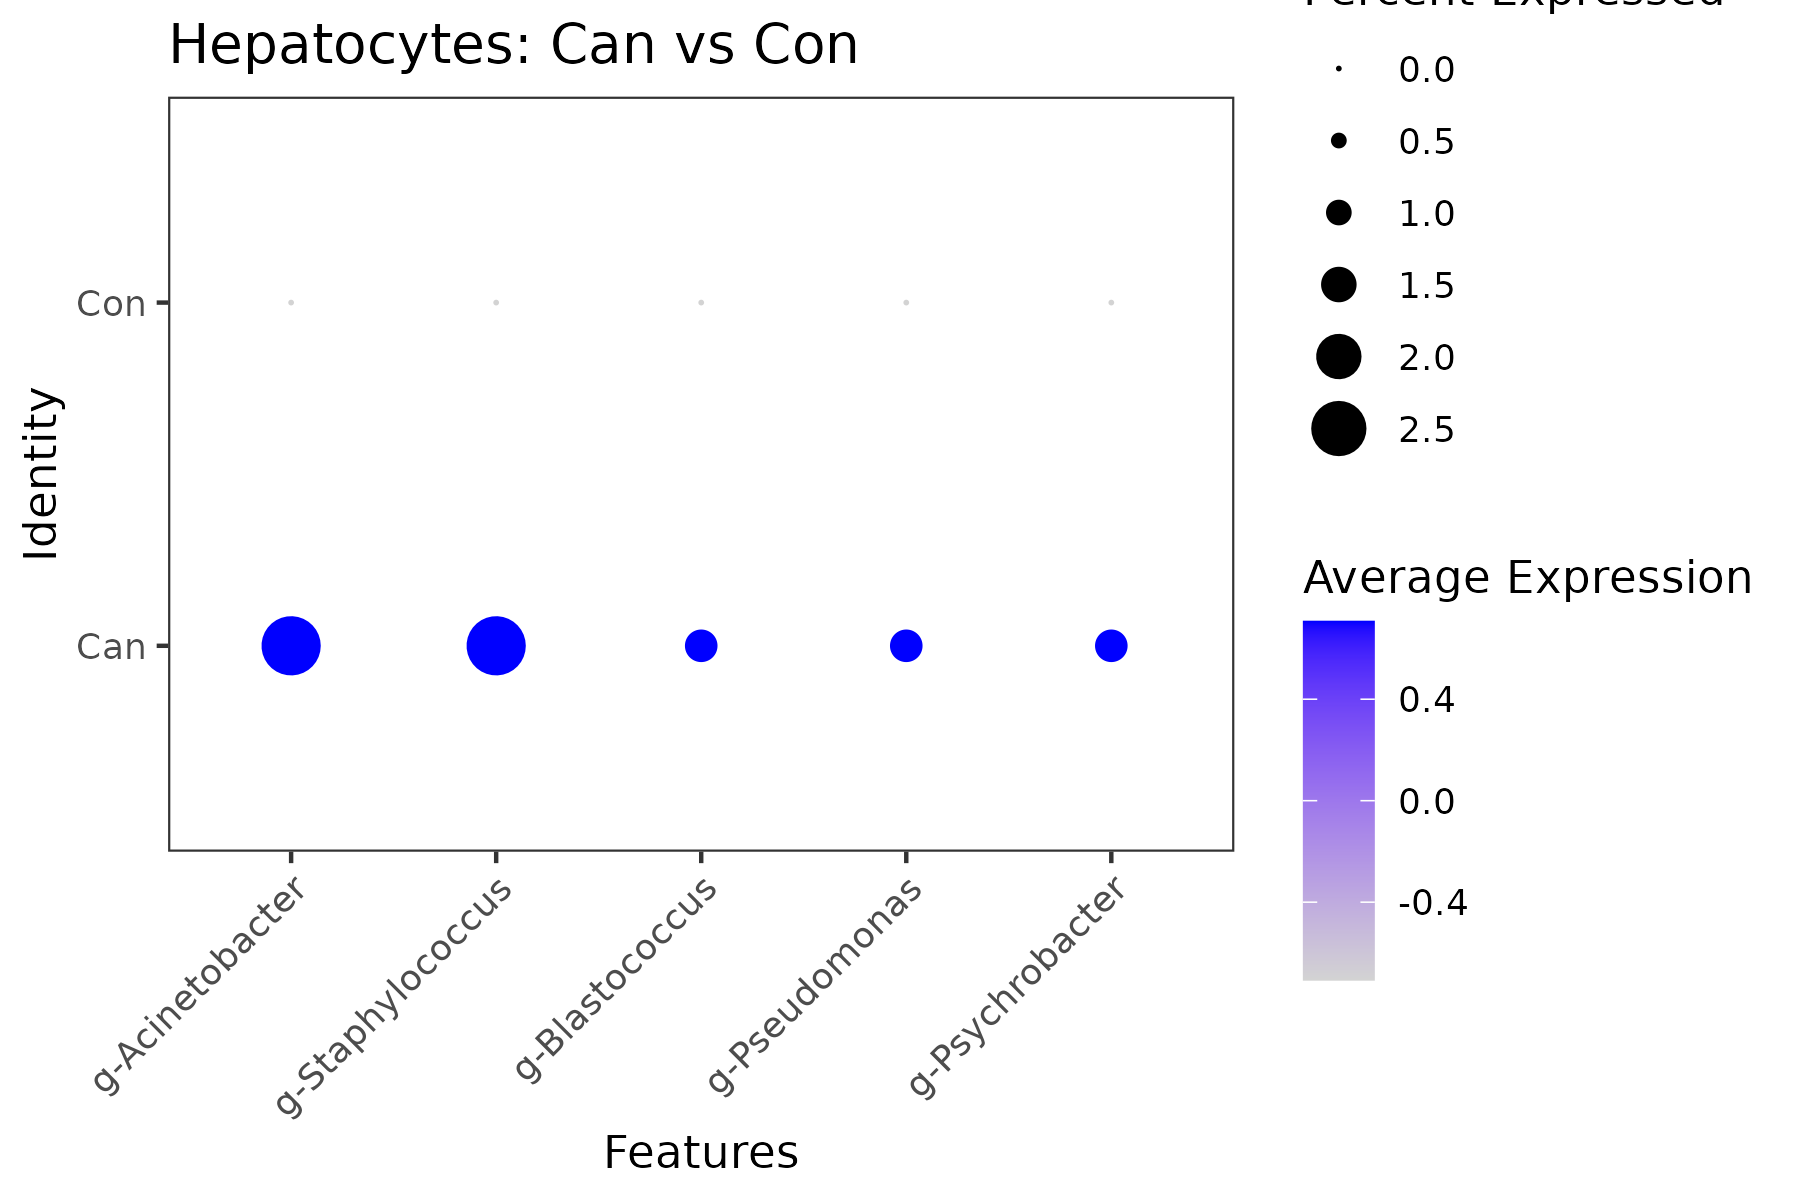
- Chart Interpretation: X-axis lists screened candidate microbes; Y-axis shows compared groups (e.g., Can vs Con). Dot size indicates positivity rate; color intensity indicates mean abundance (bluer = higher).
- Analysis Key Points: Prioritize microbes with both larger dots and deeper color in specific groups, as these may be key microbes driving microenvironmental shifts.
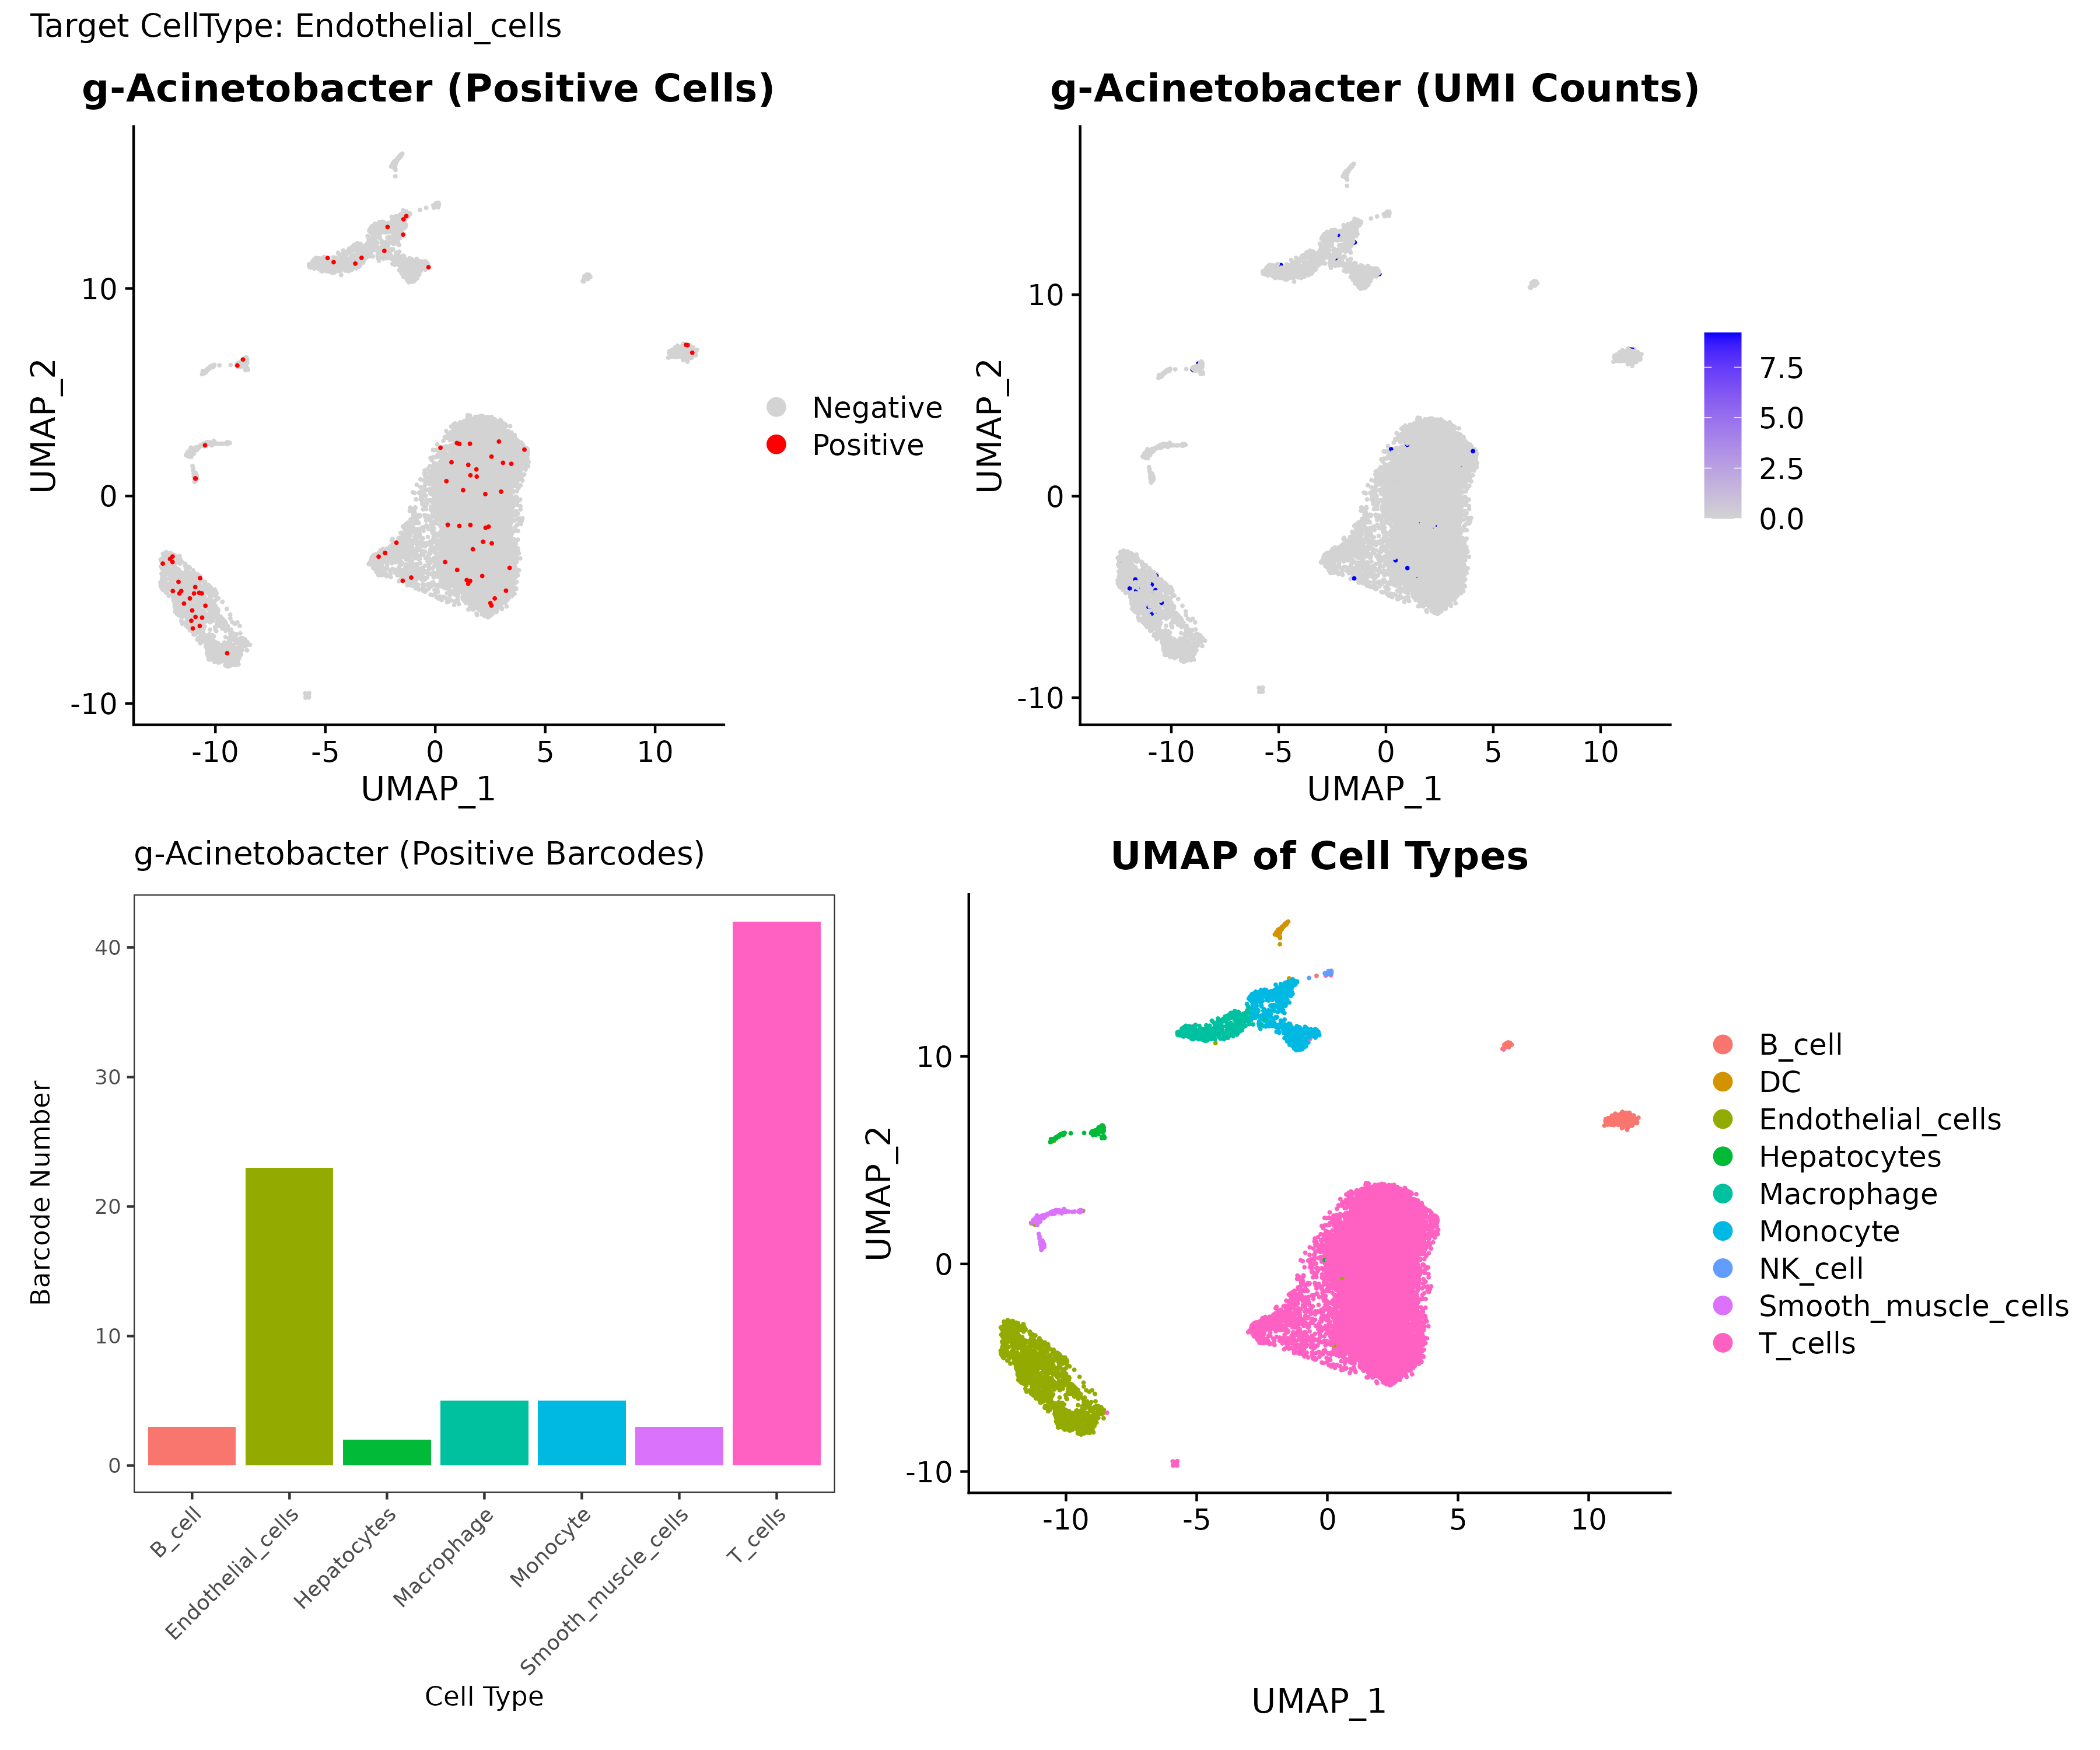
- Chart Interpretation: Validation plot for significant Fisher-screened microbes, including positive/negative distribution, UMI level distribution, positive-cell counts by cell population, and host UMAP background.
- Analysis Key Points: Combined with host UMAP background, these panels provide spatial, abundance, and quantitative evidence for microbial tropism. The validated set is merged with abundance-screened candidates as the core microbe set for downstream analysis.
2.2 Impact of Microbial Infection on Target-Cell Microenvironment
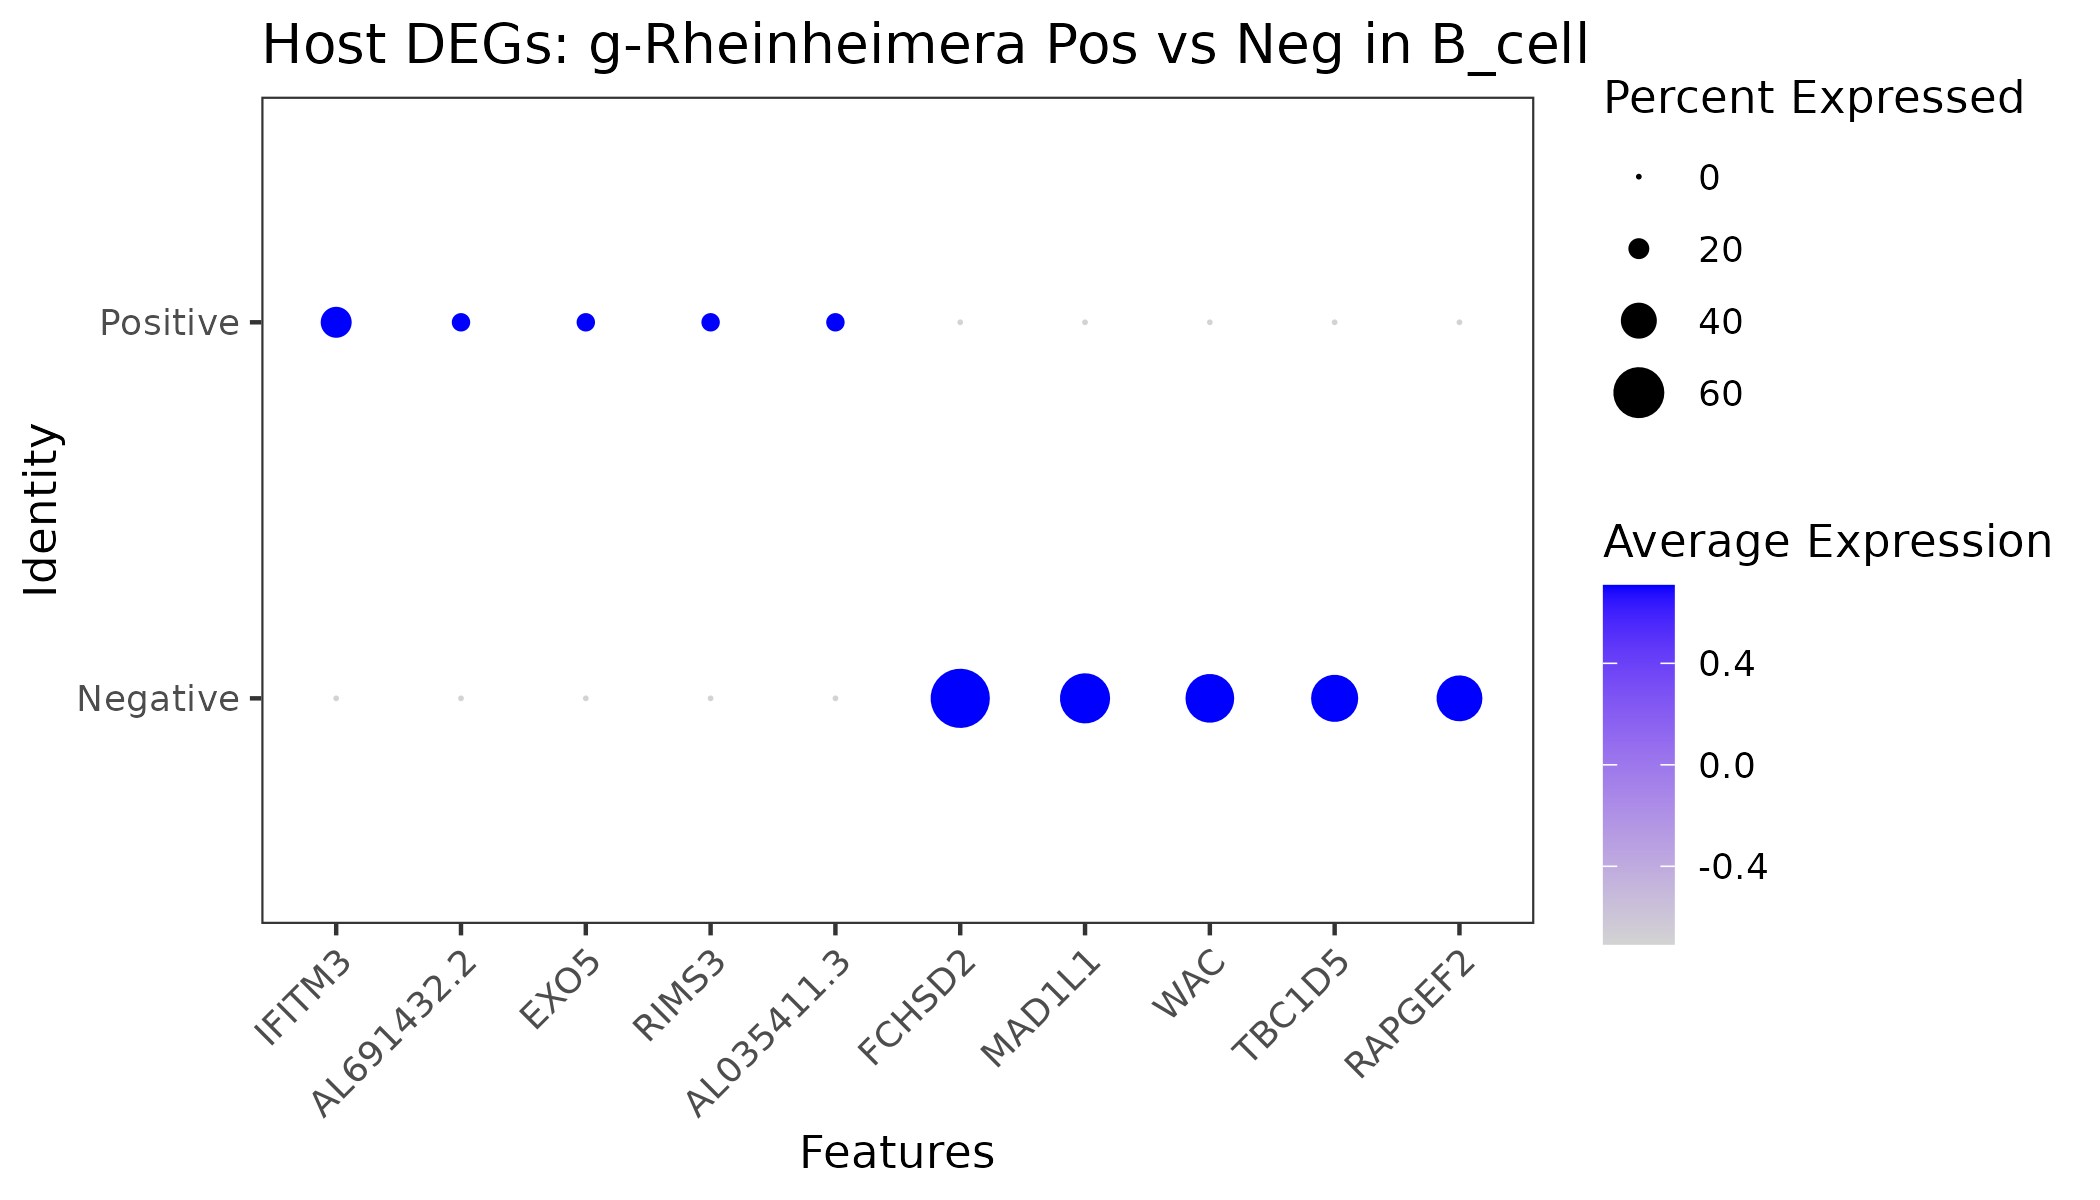
- Chart Interpretation: X-axis shows DEGs between positive and negative cells; Y-axis is group label. Dot size indicates expression proportion; color intensity indicates average expression (bluer = higher).
- Analysis Key Points: Focus on genes specifically upregulated in positive cells, which capture immediate host responses to microbial infection and provide mechanistic clues.
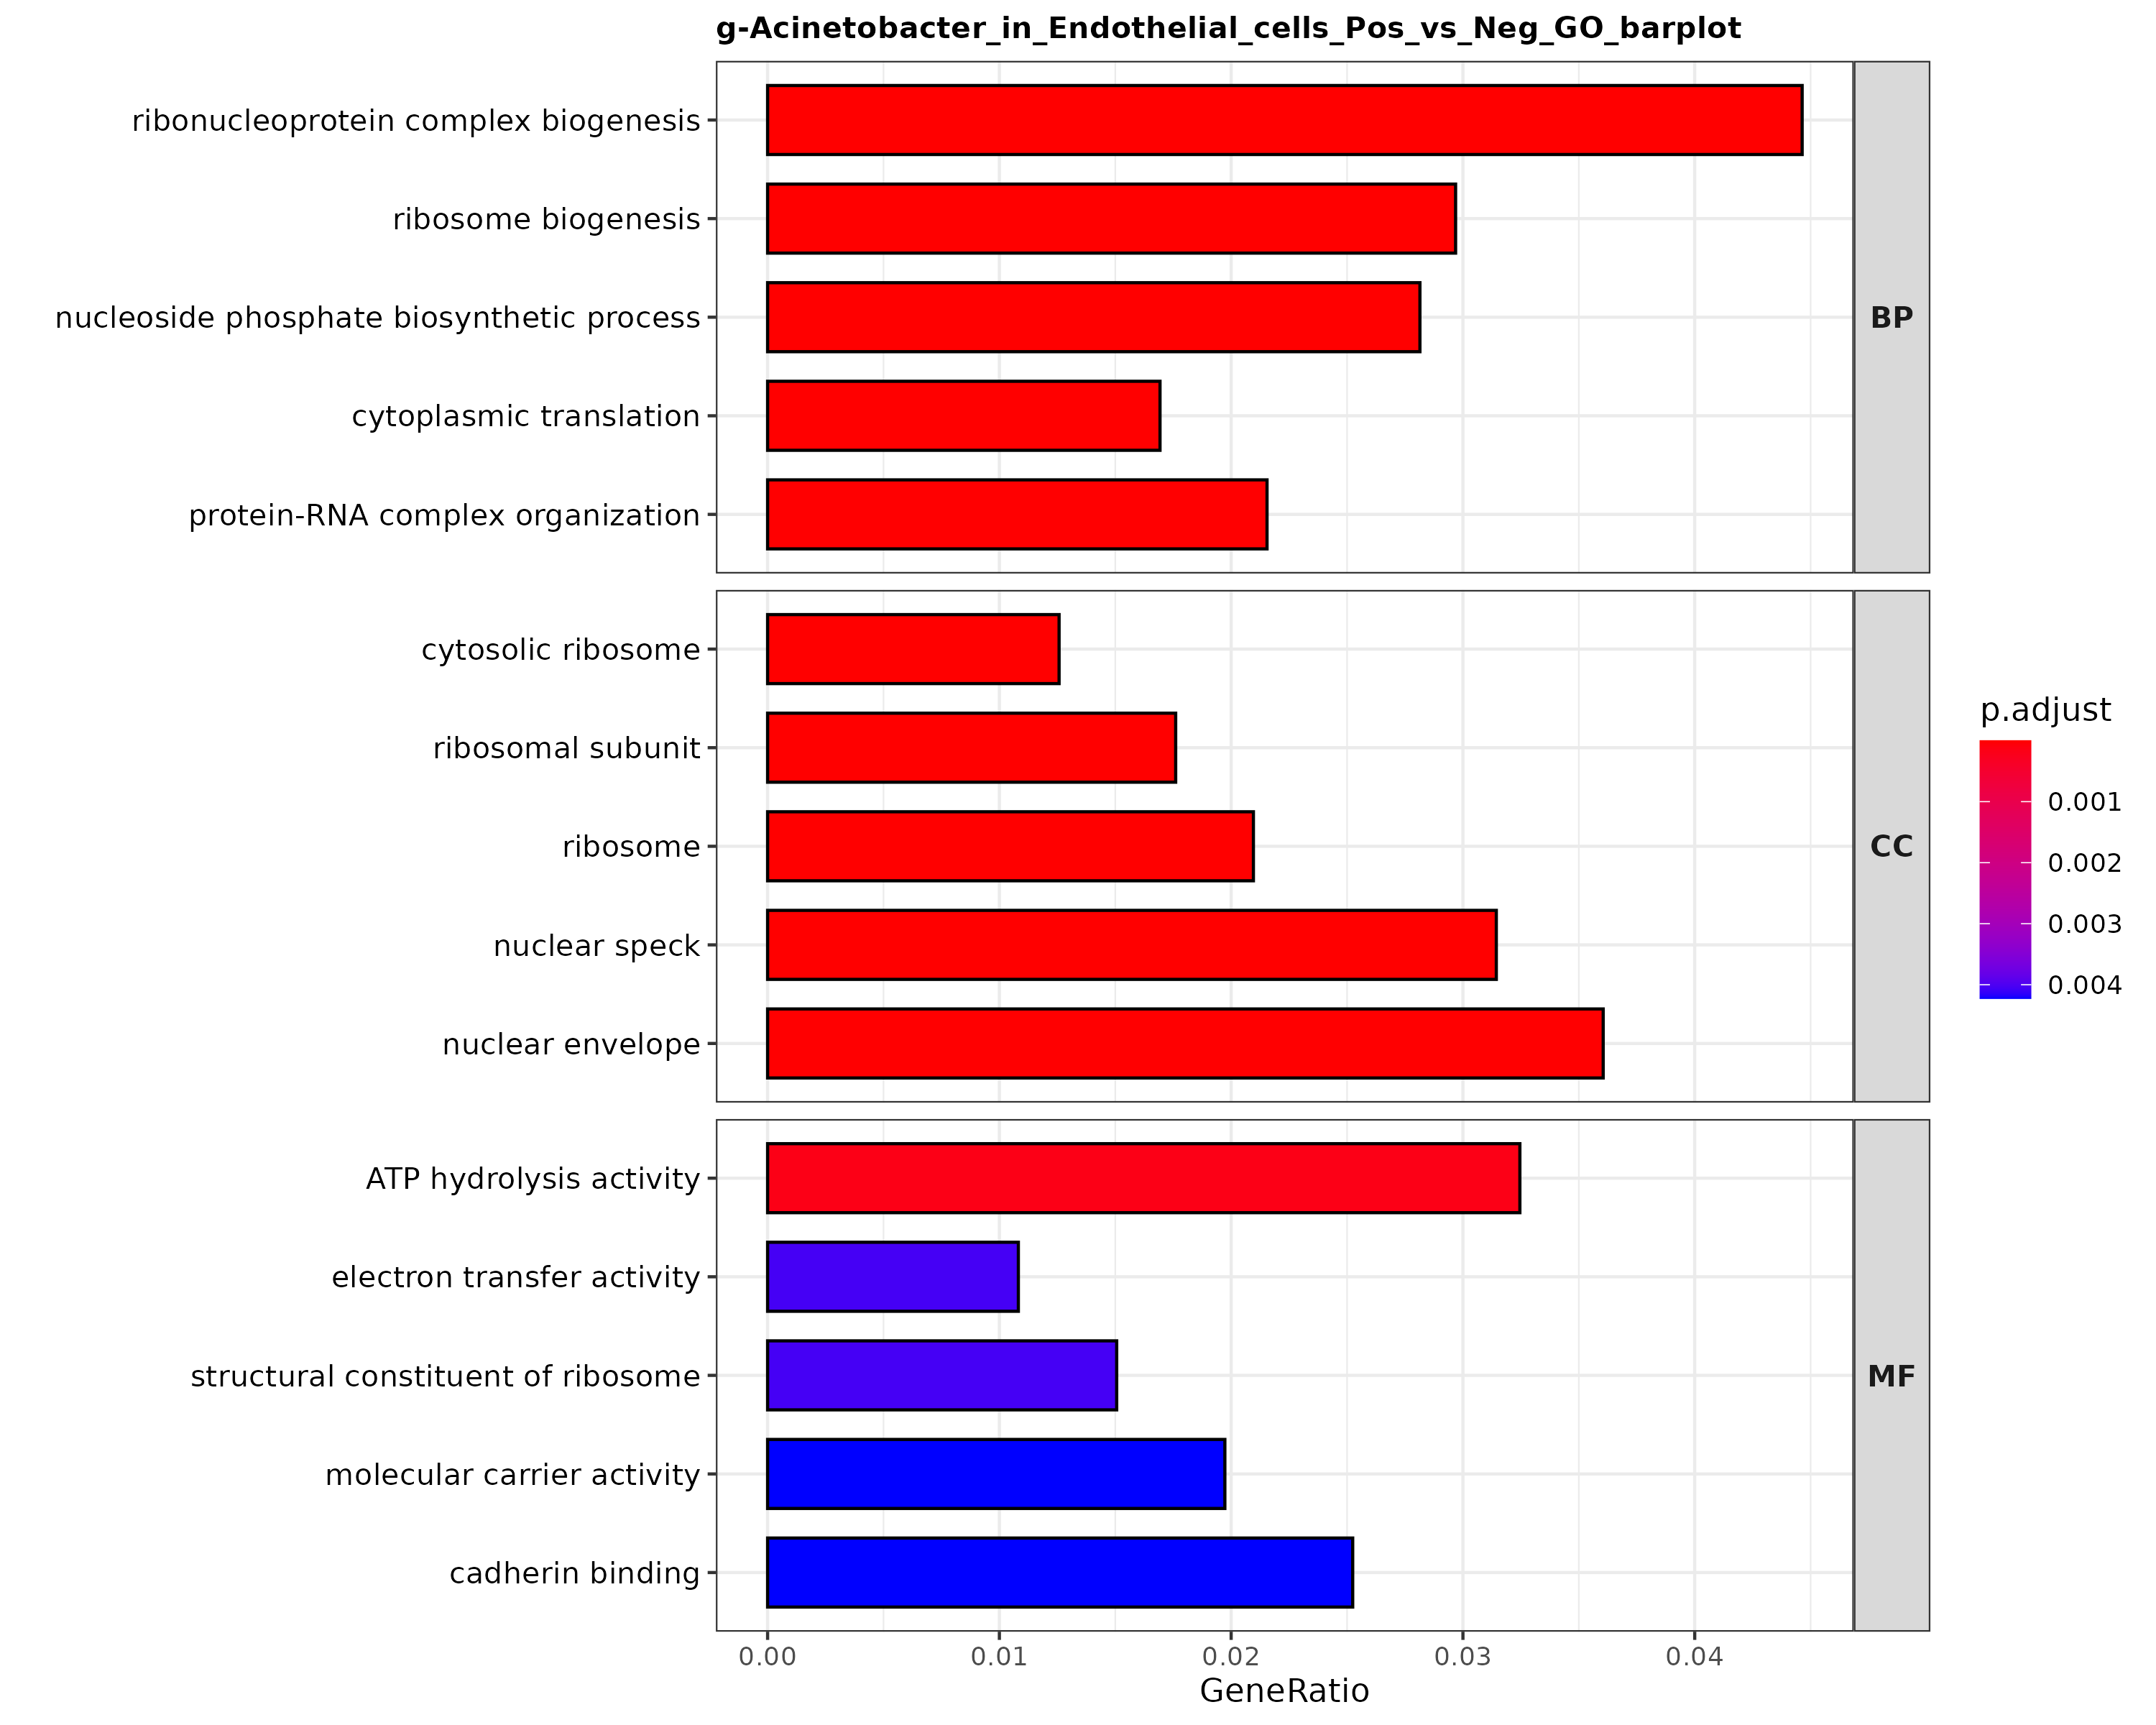
- Chart Interpretation: X-axis is GeneRatio; Y-axis is GO term. Bar color indicates adjusted significance (
p.adjust), redder = more significant. - Analysis Key Points: Check whether significant pathways converge on infection-related processes such as immune response, inflammation, metabolic reprogramming, and proliferation/apoptosis.
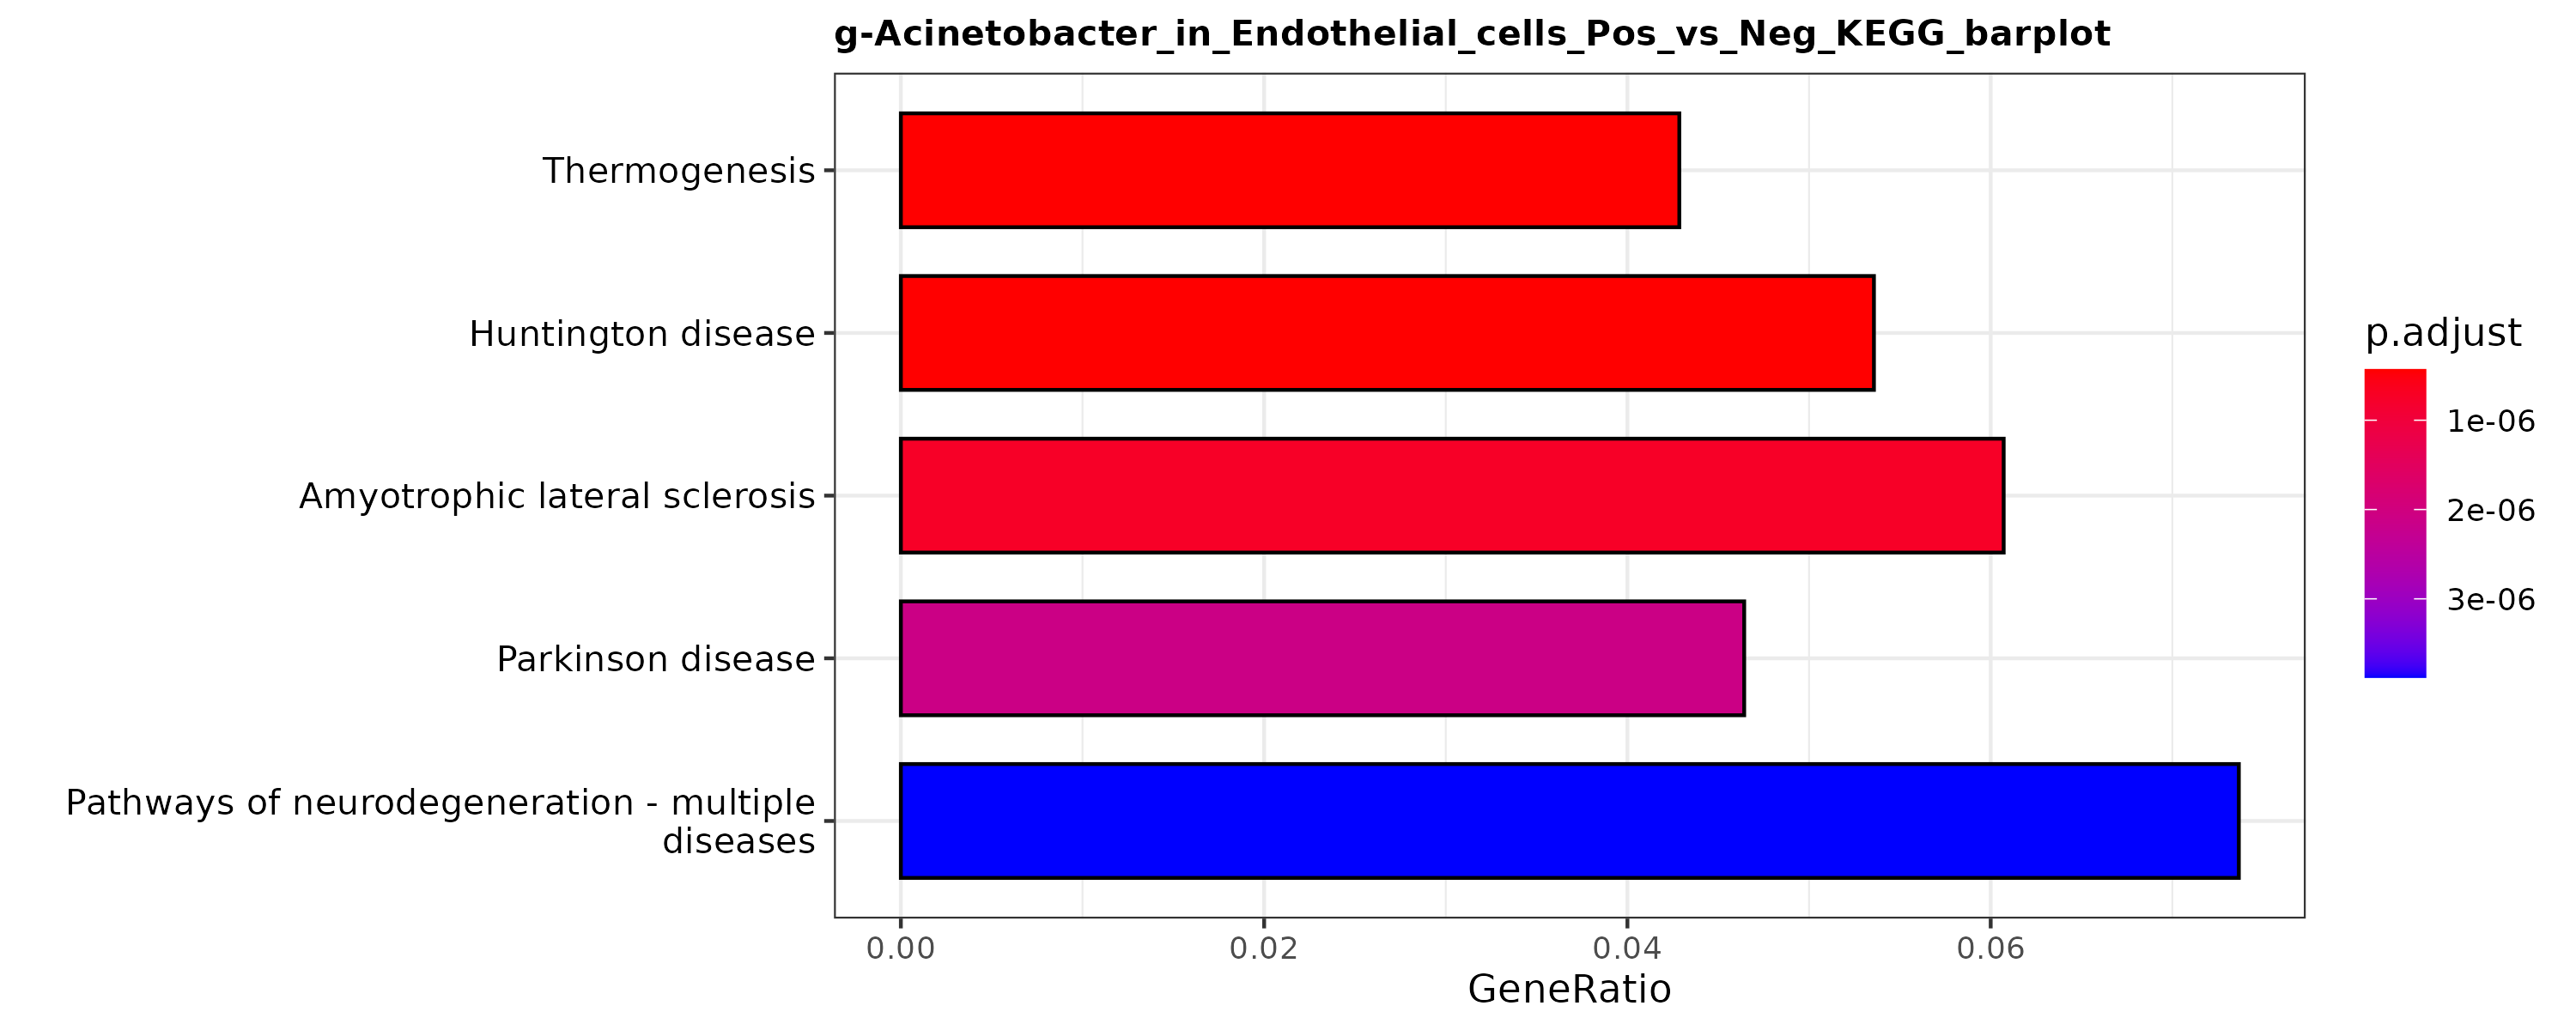
- Chart Interpretation: X-axis is GeneRatio; Y-axis is KEGG pathway. Bar color indicates significance (
p.adjust), redder = more significant. - Analysis Key Points: Focus on enrichment of canonical pathways related to immune regulation, infection signaling, apoptosis, and metabolism to infer affected cascades.
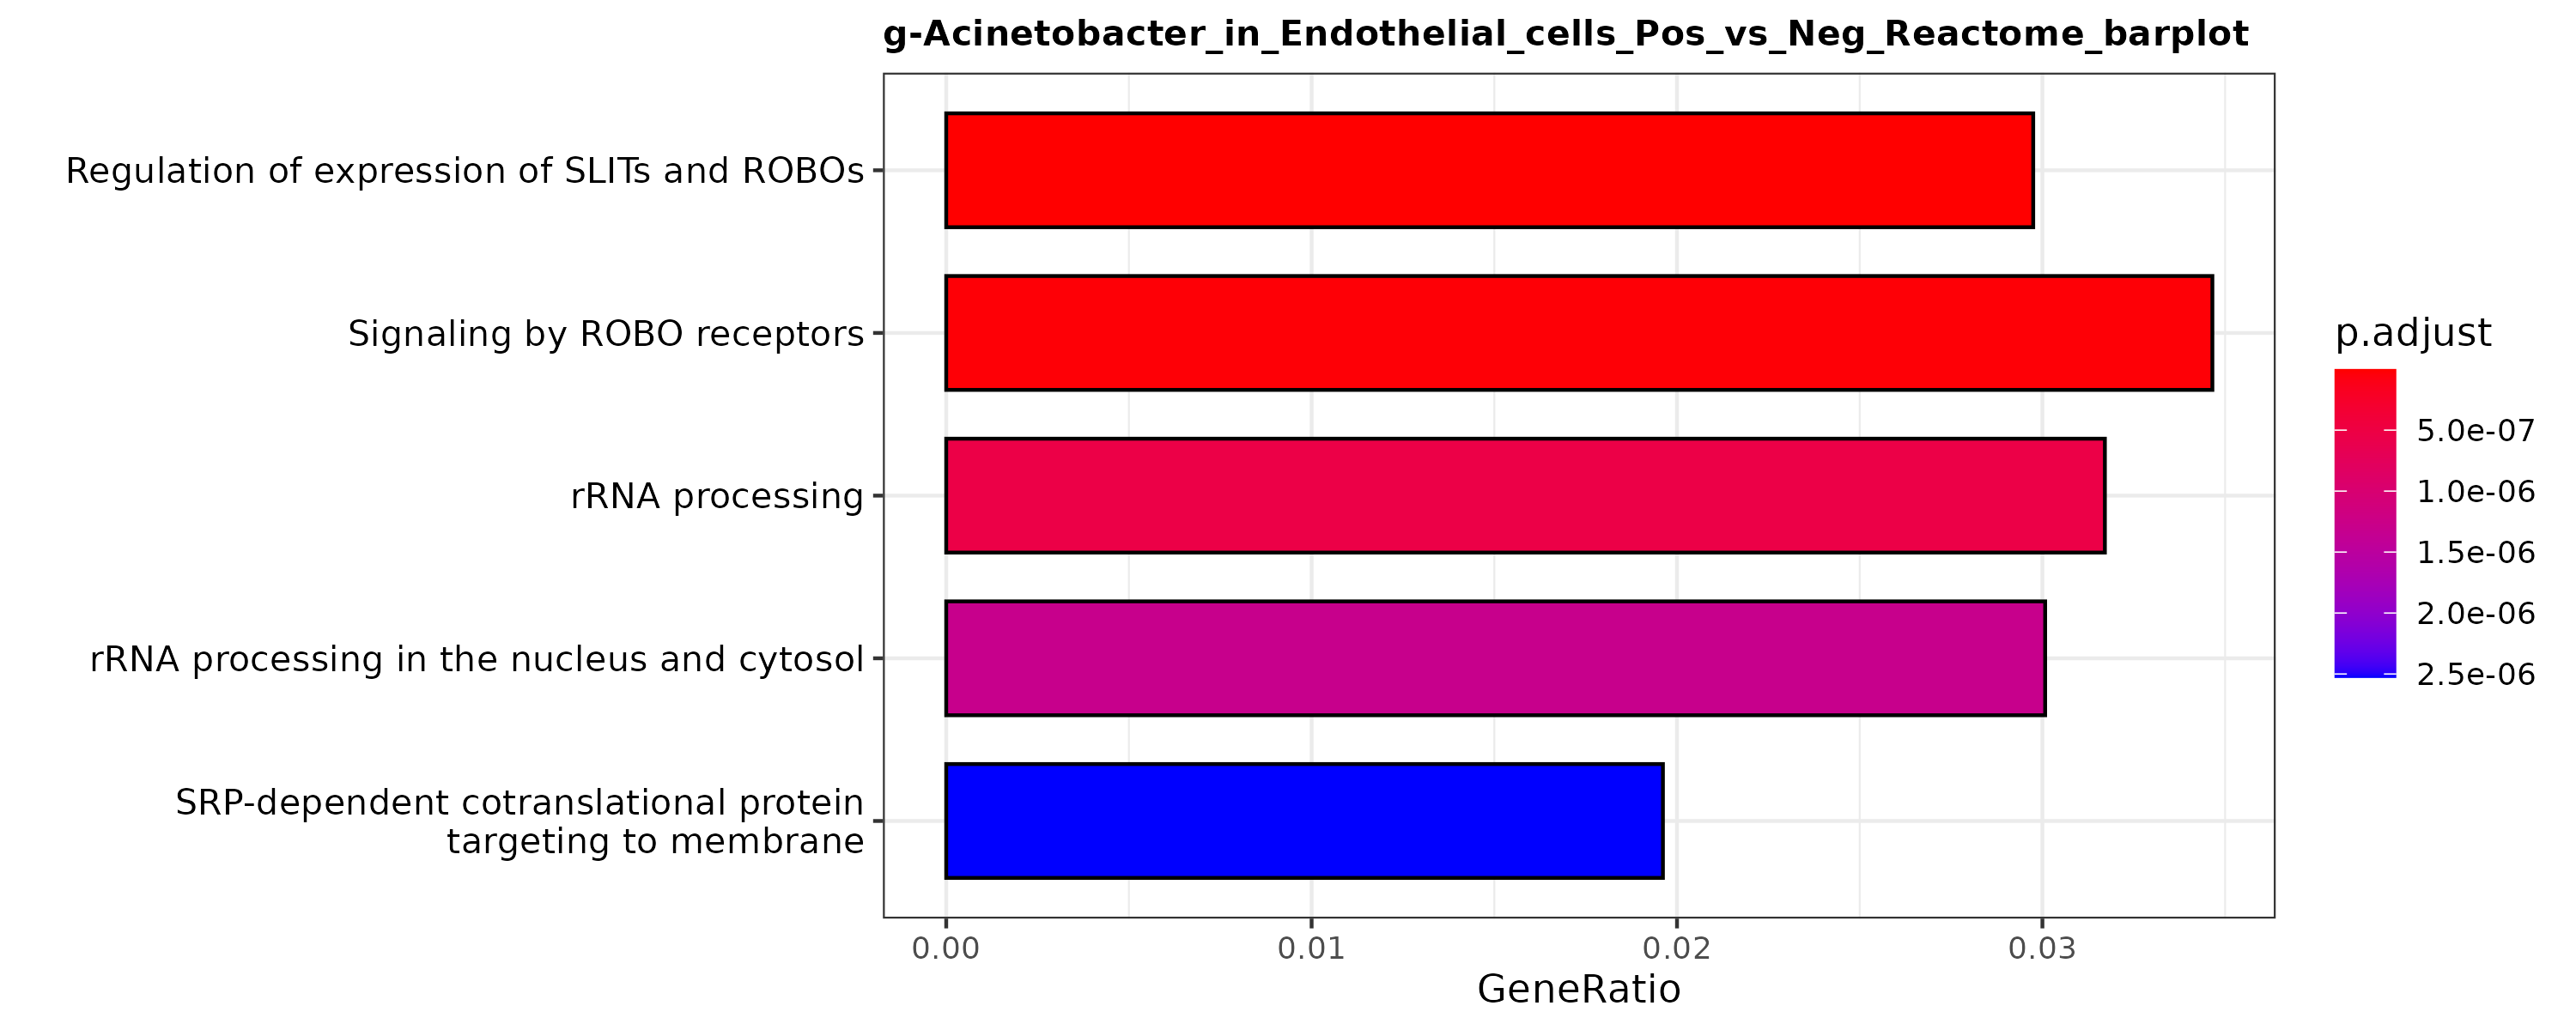
- Chart Interpretation: X-axis is GeneRatio; Y-axis is Reactome pathway. Bar color indicates significance (
p.adjust), redder = more significant. - Analysis Key Points: Reactome offers finer-grained annotations and complements GO/KEGG; together they form a stronger functional evidence chain.
2.3 Coordinated Changes Between Inter-group Microenvironment and Core Microbe Abundance (Group Mode)
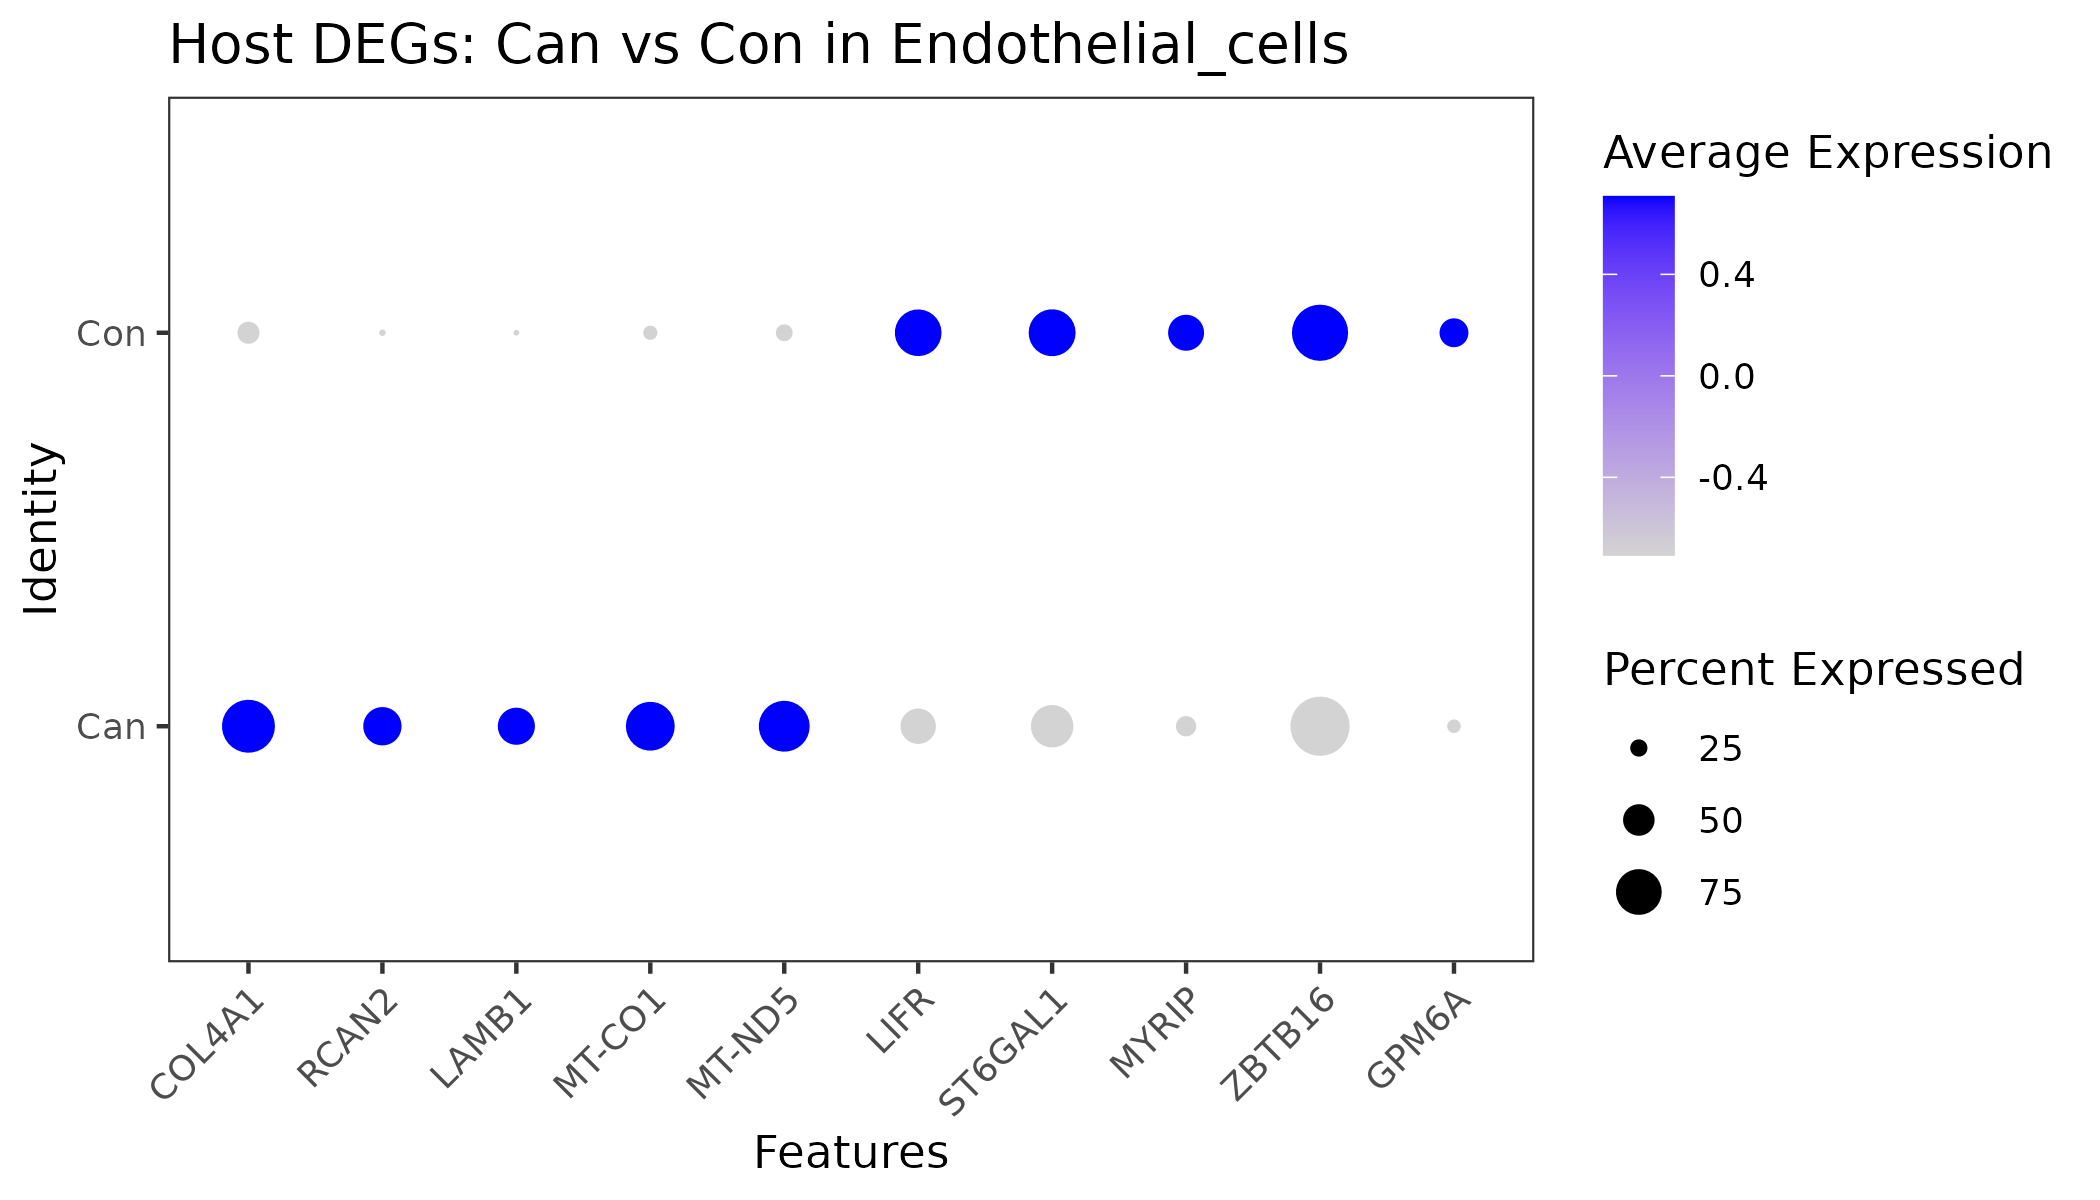
- Chart Interpretation: X-axis shows host DEGs between groups; Y-axis is group label. Dot size indicates expression proportion; color indicates average expression.
- Analysis Key Points: Compare dot size and color for the same gene across groups to infer up/down trends and system-level transcriptomic remodeling.
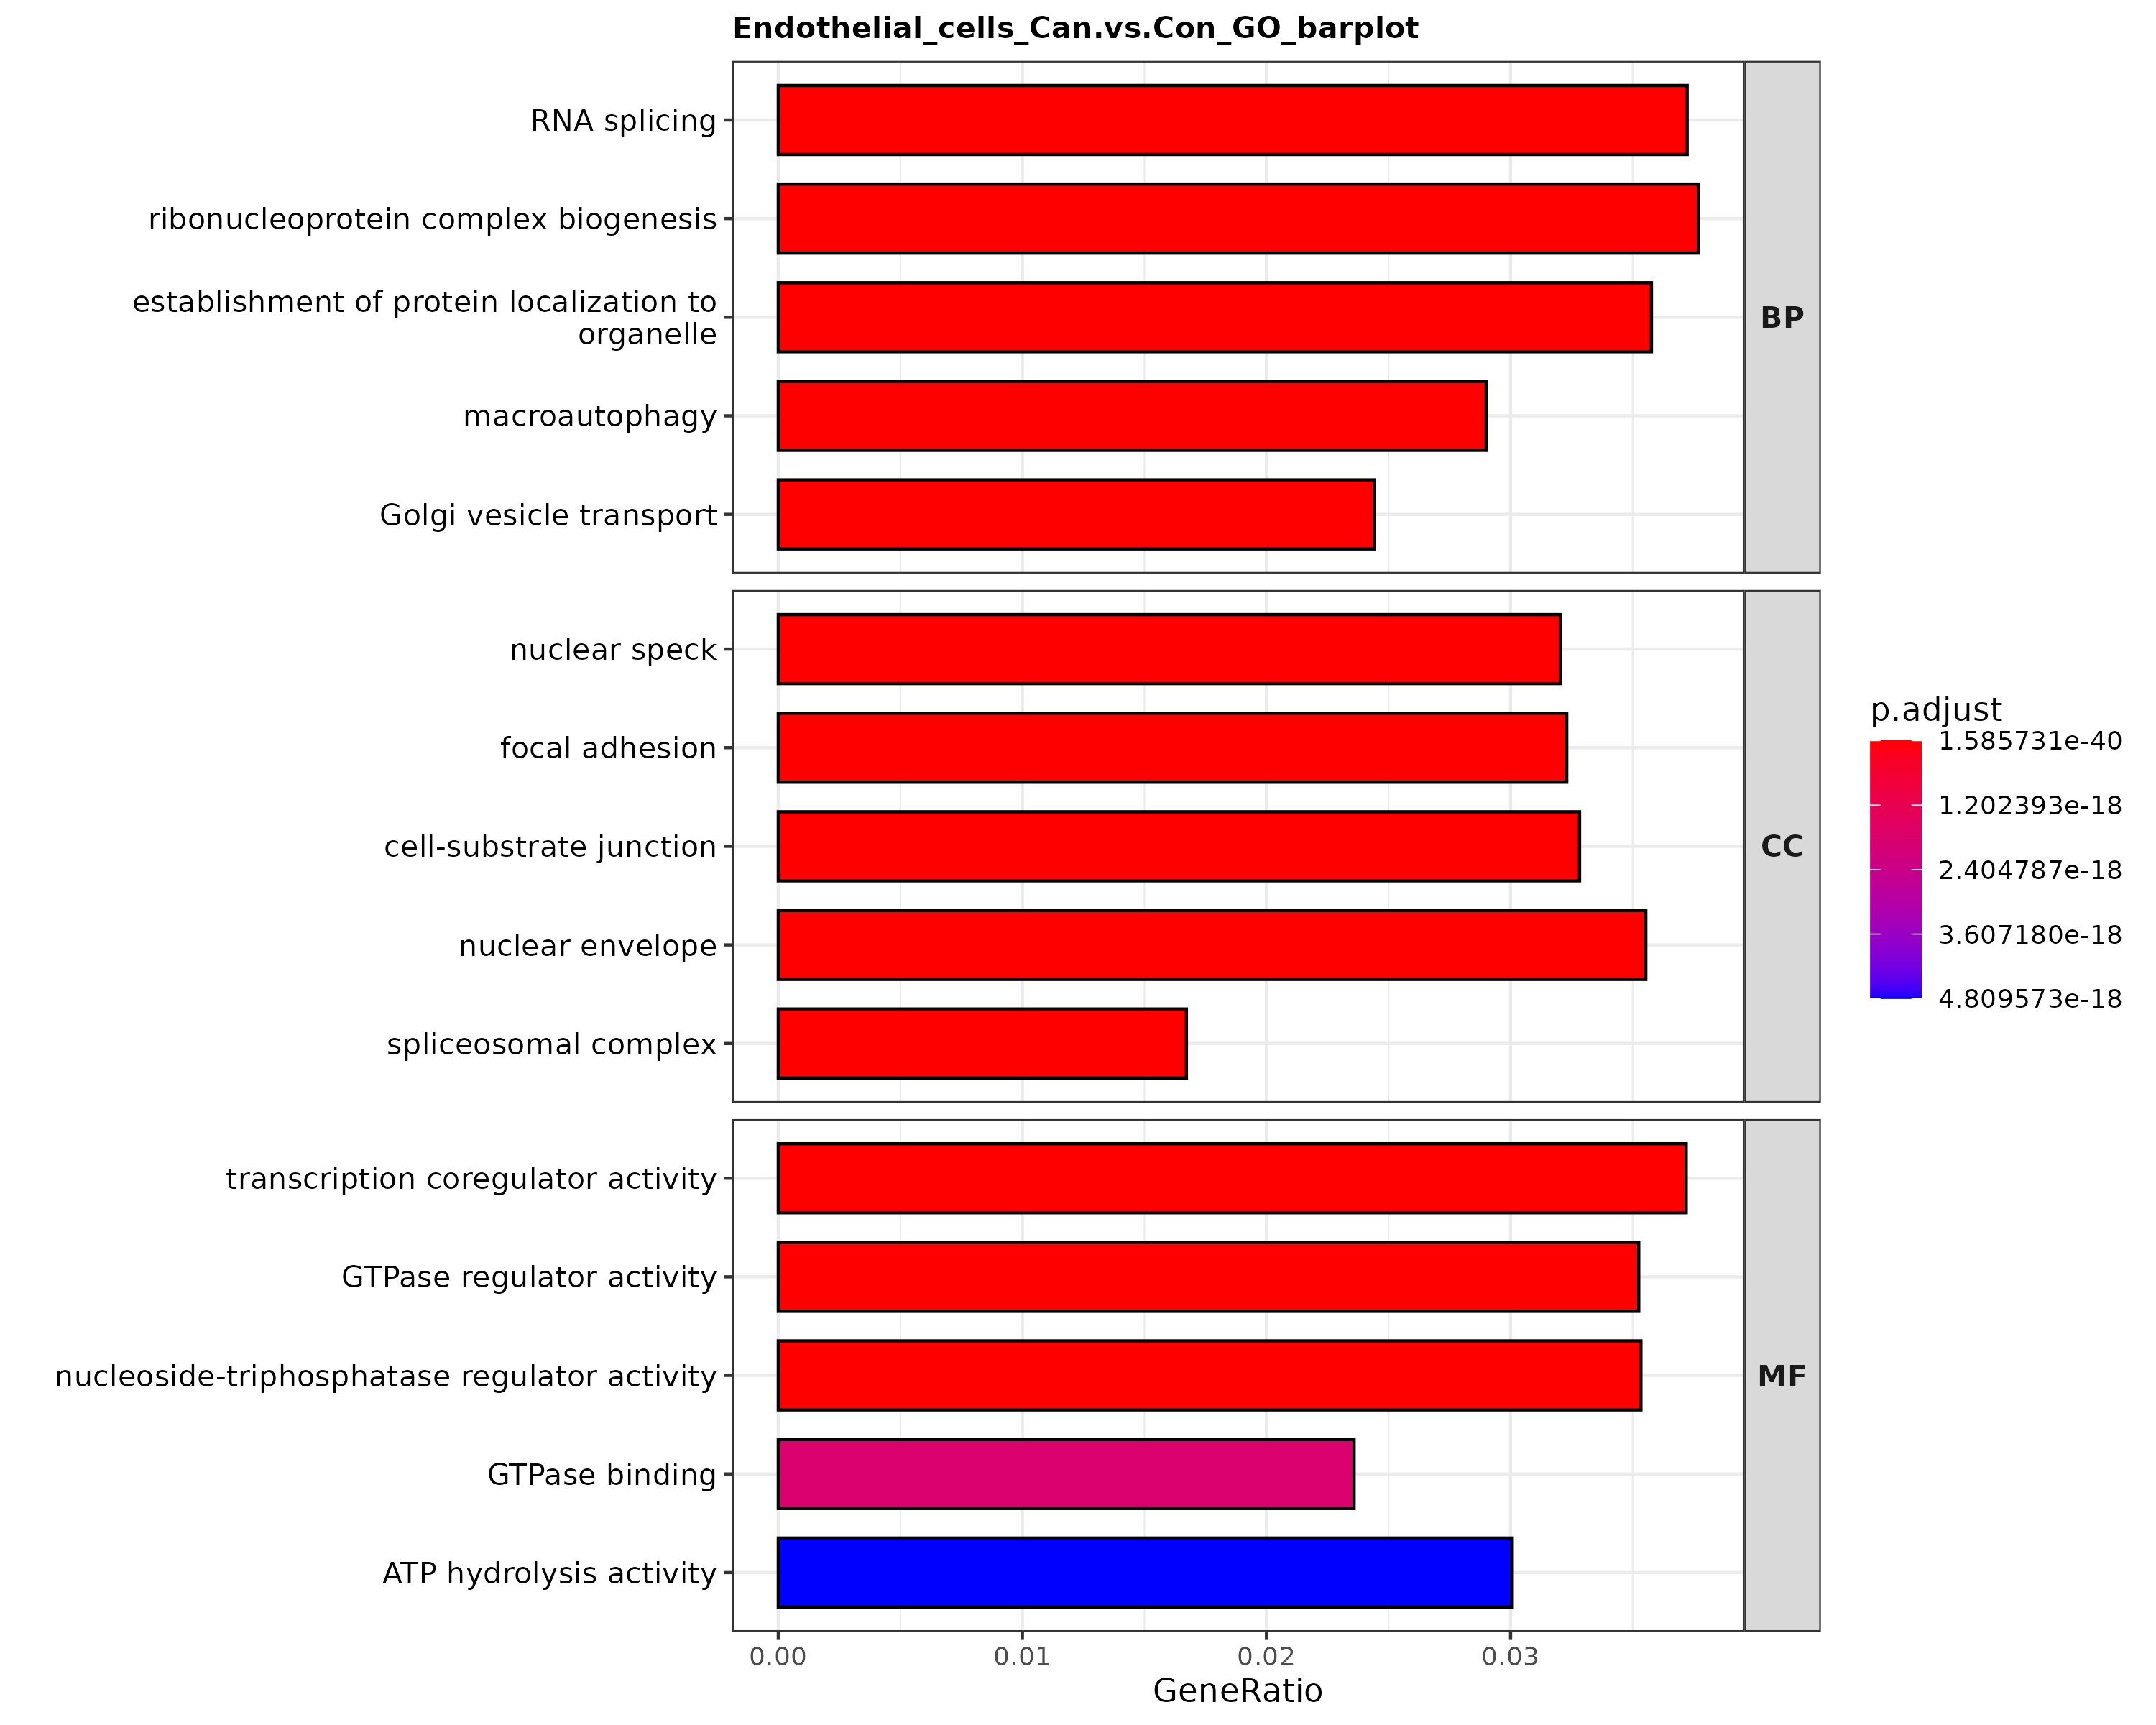
- Chart Interpretation: X-axis is GeneRatio; Y-axis is GO pathway. Bar color indicates enrichment significance.
- Analysis Key Points: Evaluates broad functional shifts under disease conditions and helps distinguish disease-driven from infection-driven changes when combined with Section 2.2.
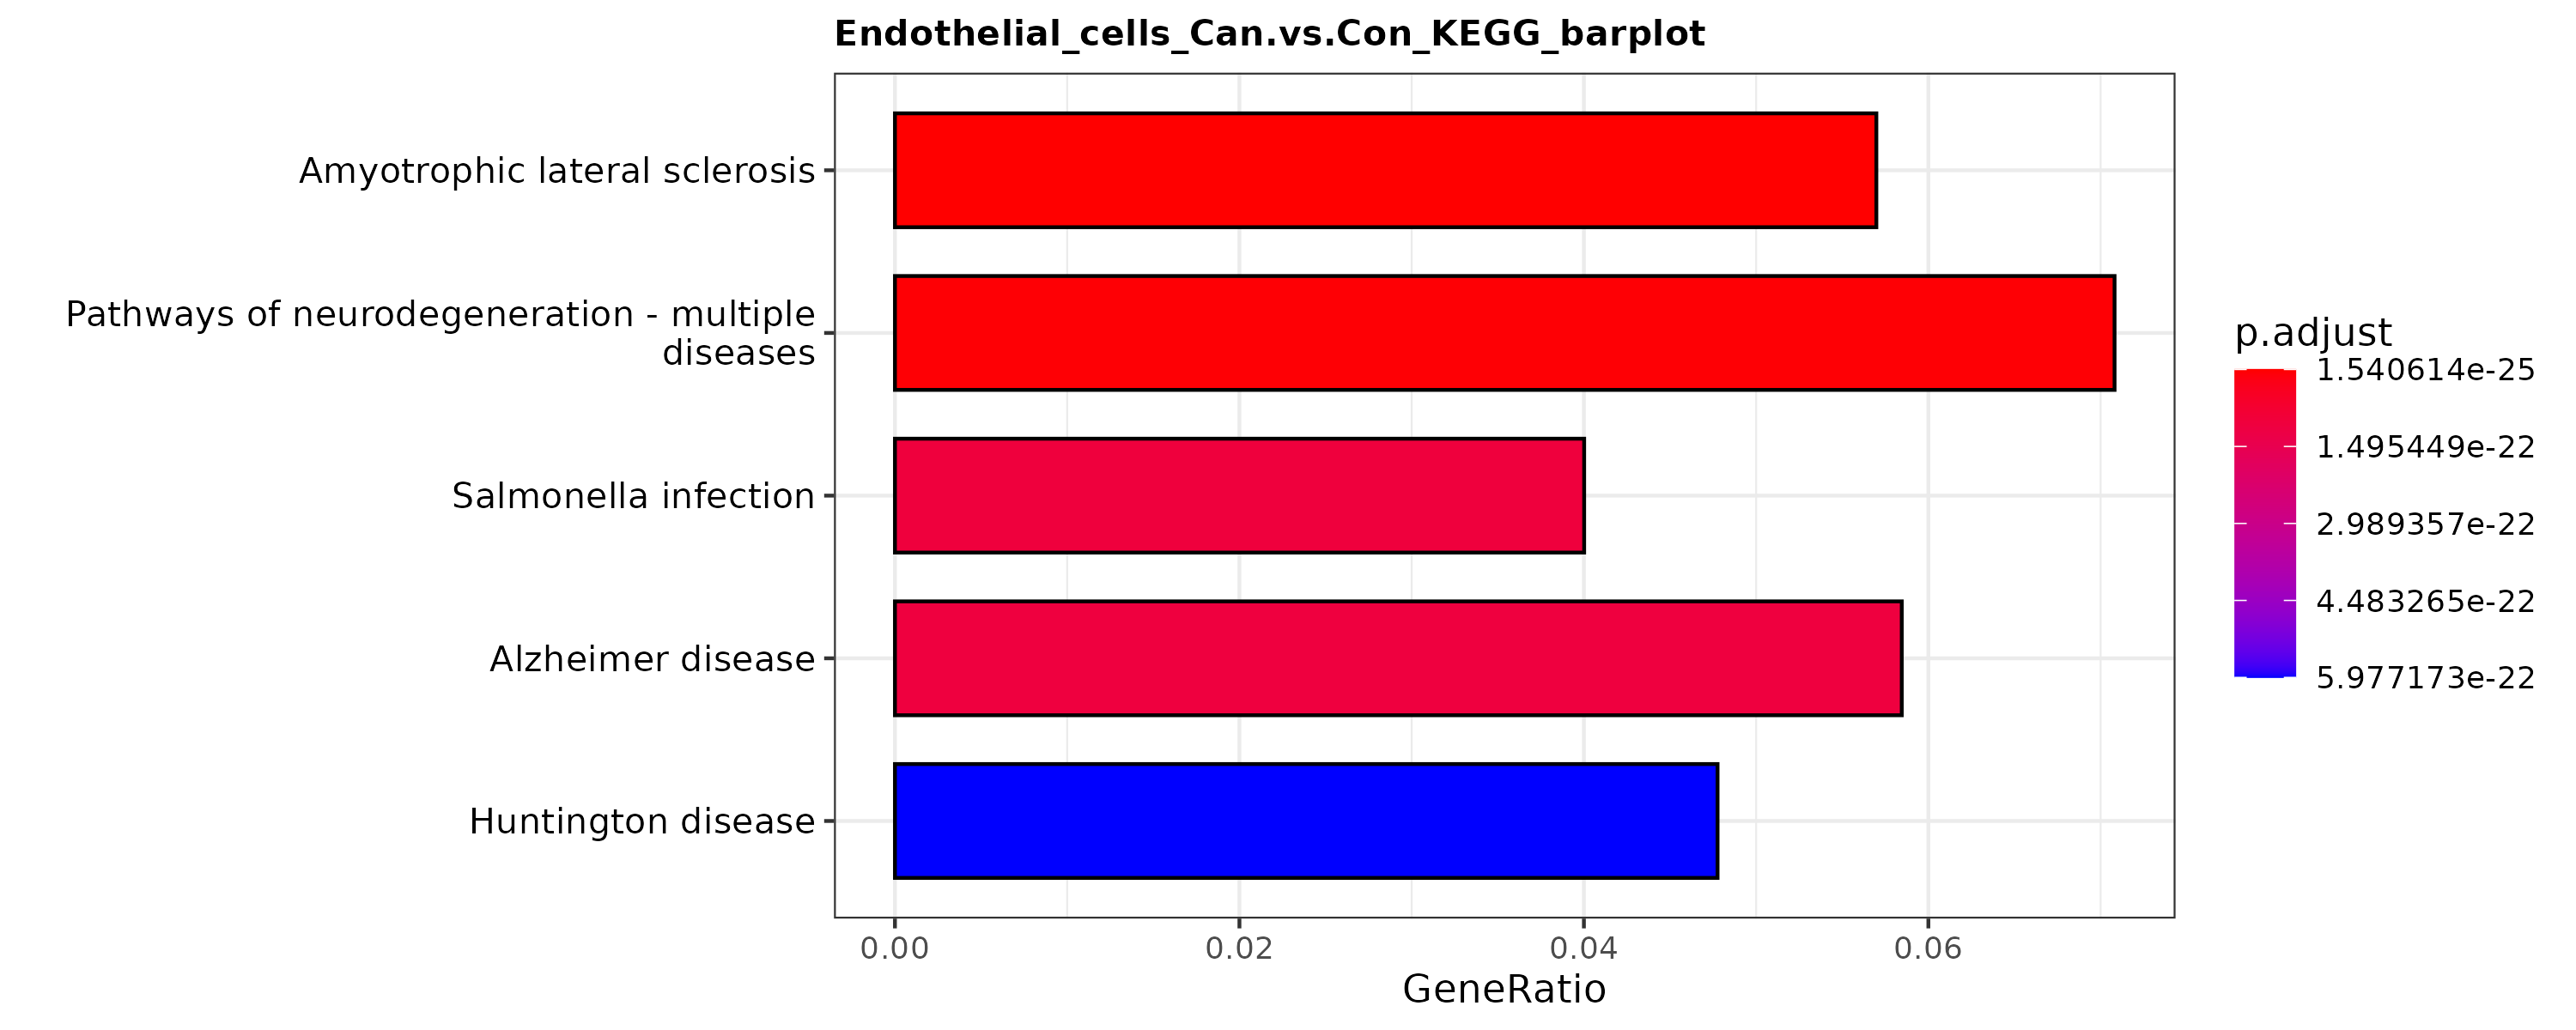
- Chart Interpretation: X-axis is GeneRatio; Y-axis is KEGG pathway. Bar color indicates enrichment significance.
- Analysis Key Points: Assesses pathway-level functional remodeling and is best interpreted together with positive/negative results from Section 2.2.
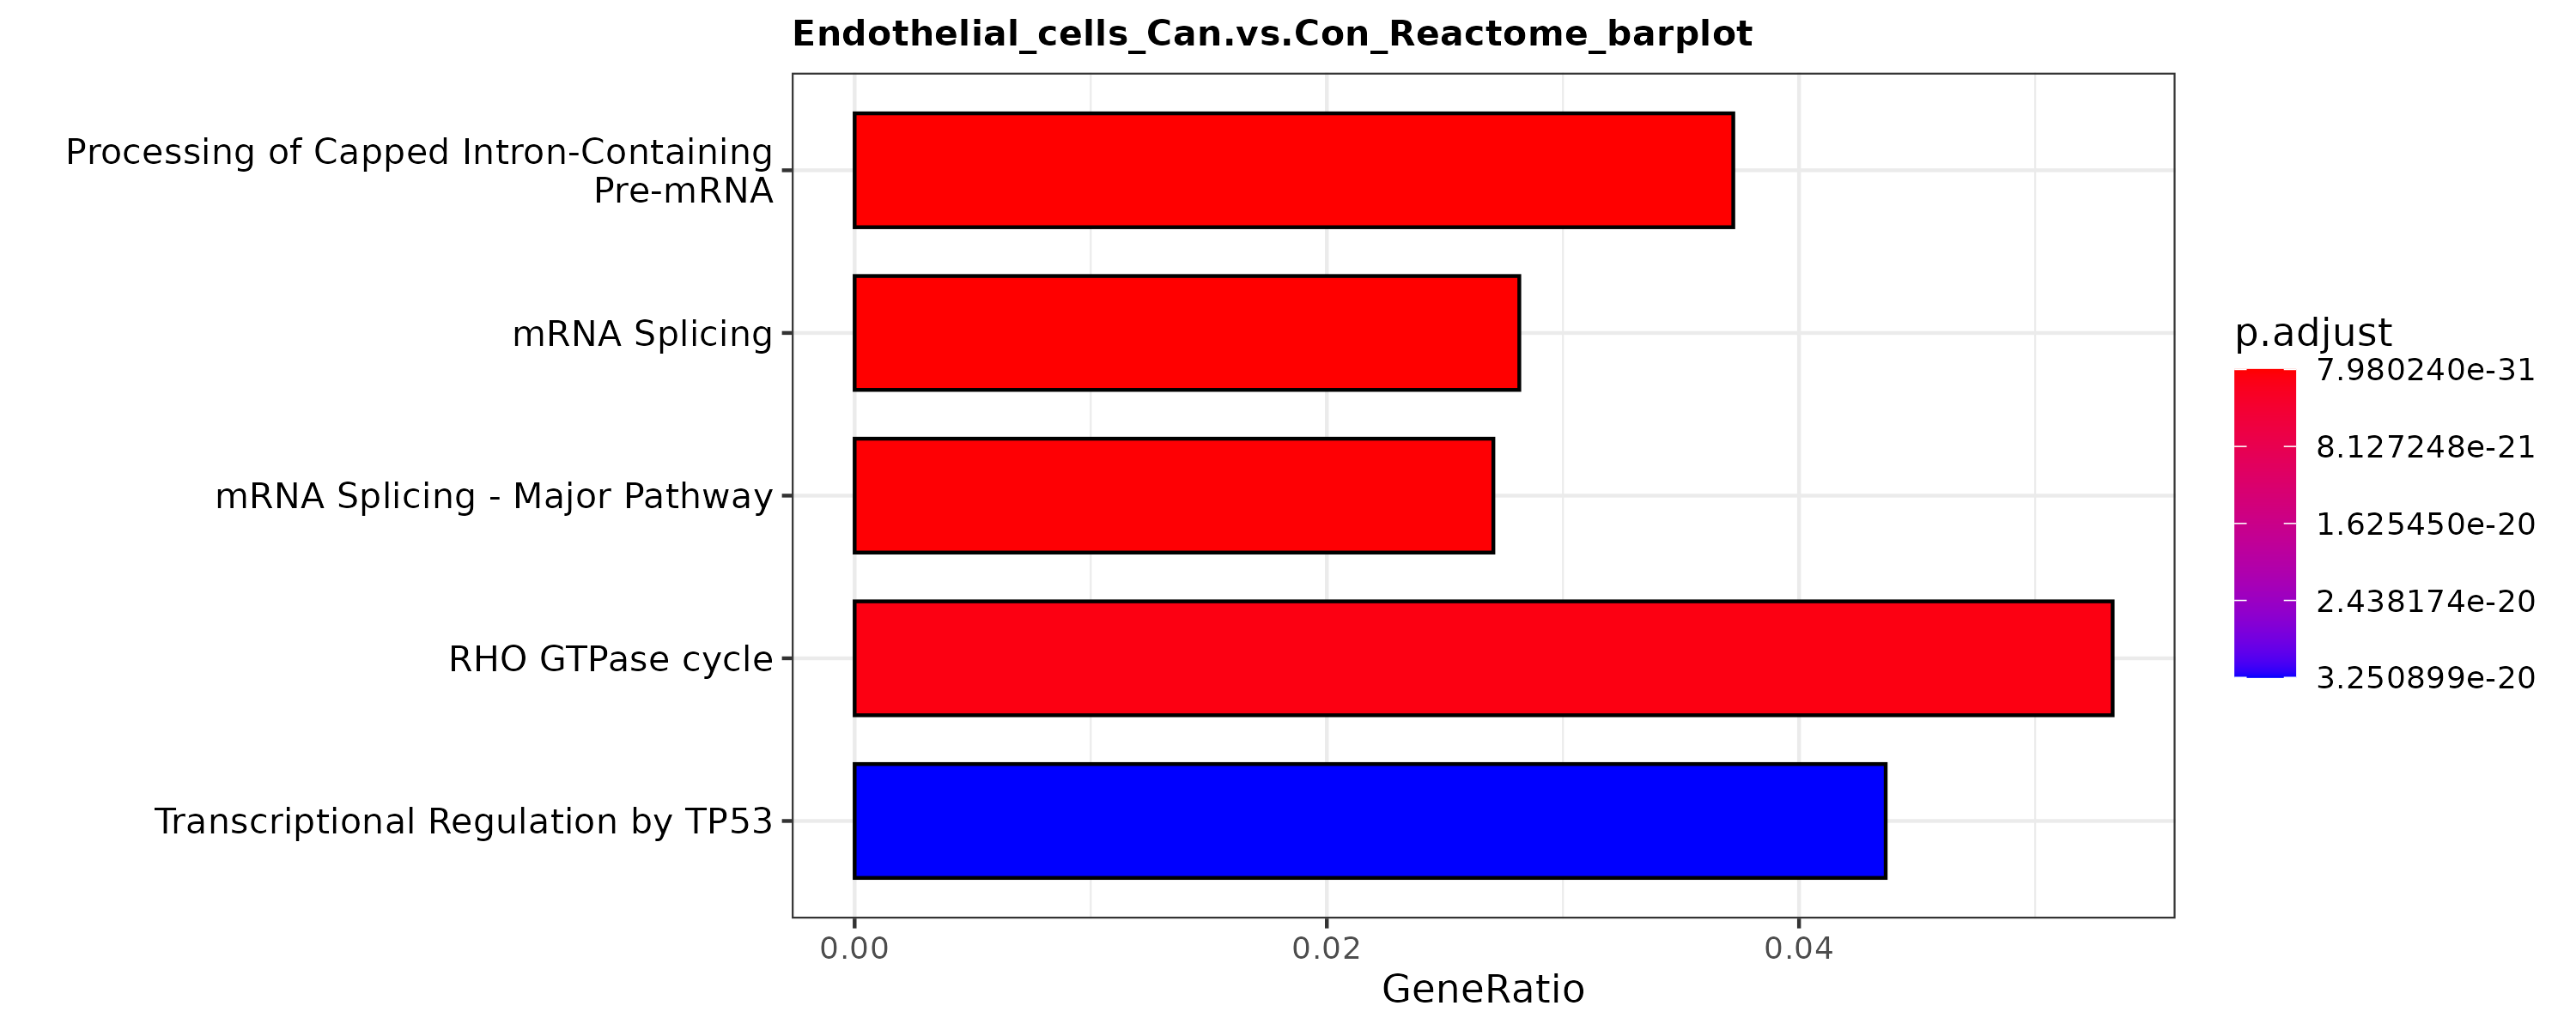
- Chart Interpretation: X-axis is GeneRatio; Y-axis is Reactome pathway. Bar color indicates enrichment significance.
- Analysis Key Points: Provides fine-grained pathway confirmation and complements GO/KEGG findings.
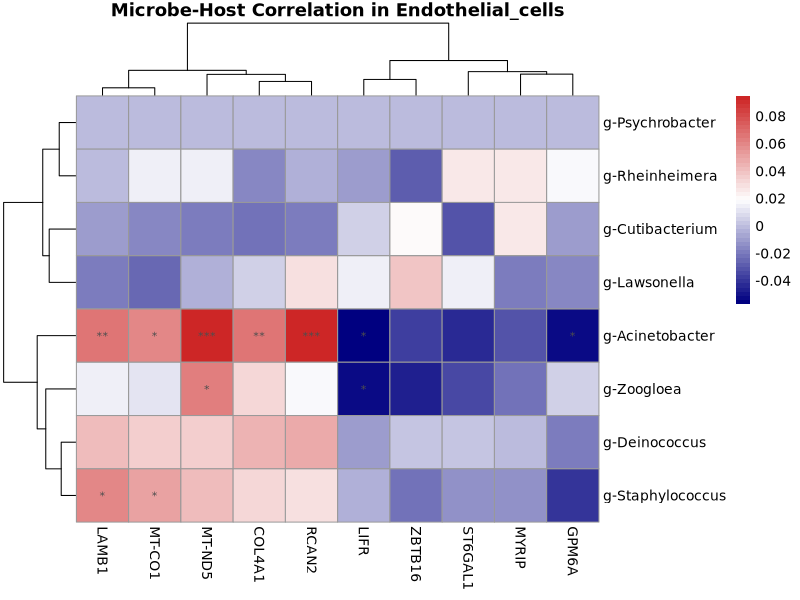
- Chart Interpretation: X-axis is inter-group host DEGs; Y-axis is candidate core microbes. Color shows correlation direction and magnitude (red positive, blue negative; darker = stronger); asterisks indicate significance.
- Analysis Key Points: Prioritize deep-colored, starred pairs as statistically significant microbe-gene co-variation candidates for follow-up validation.
3. Result File List
Main outputs are organized by taxonomic level (e.g., genus/).
| Directory/File | Description |
|---|---|
genus/global/ | Global basic statistics plots and tables, including stacked composition plots, overall UMAP overview, top-taxon UMAP plots, and positivity/abundance tables. |
genus/celltype/ | Cell-type stratified statistics, including composition comparisons, subset 2×2 UMAP plots, top-taxon UMAP plots, and detailed tables. |
genus/sample/orgenus/group/ | Sample/group stratified statistics, including stacked relative-abundance plots, corresponding 2×2 UMAP overviews, top-taxon UMAP plots, and summary tables. |
genus/diff_enrich/1_Core_Microbe_Panel | Core microbe screening results from abundance differences and Fisher test, with DotPlot and Fisher 2×2 visualizations. |
genus/diff_enrich/2_Direct_Infection_Effects | Infection effect analysis within target cells, including positive-vs-negative DEGs and GO/KEGG/Reactome enrichment outputs. |
genus/diff_enrich/3_Microenvironment_Coalteration | (Group mode only) coordinated analysis of inter-group host changes and core microbe abundance, including inter-group DEGs, enrichment results, and correlation heatmaps. |
genus/bac_list/ | (Generated when bac_list is provided) targeted statistics for selected microbes, including dedicated 2×2 UMAP plots and targeted summary tables. |
merged_genus_cloud_matrix.txt | Merged multi-sample single-cell microbial detection matrix for custom downstream mining; can be uploaded to cloud platform auxiliary labels as merged metadata. |
Notes
- This module does not perform raw 16S alignment/denoising; it accepts only upstream-standardized microbial detection matrices (e.g.,
feature_*_cells.tsv). - Due to intrinsic sparsity of single-cell 16S matrices, some subsets may not yield statistically significant differential/enrichment results (possibly empty outputs). To keep reports complete, plotting uses a fallback mechanism (prioritize significant features with
Significant = true, then supplement if needed). Focus interpretation on significant results. - Group information (e.g., disease vs control) is strongly recommended. Compared with single-sample natural variation, group comparison greatly improves biological interpretability of microbe-host association analysis, especially inter-group microenvironment changes.
Frequently Asked Questions (FAQ)
Q1: Why are some microbes or genes marked as Significant = FALSE in output tables?
A: For some plots (e.g., DotPlot), when statistically significant features are insufficient, the module supplements additional features by effect size/odds ratio to preserve plot readability. Use the Significant column as the primary interpretation criterion (true = significant, false = non-significant).
Q2: Why can the same candidate core microbe be significant (Significant = TRUE) in multiple cell types?
A: A microbe may have broad tropism rather than strict specificity. As long as its detection rate or abundance is significantly higher than background in a given cell type, it can be independently identified as enriched in that cell type.
Q3: Why are microbes listed in bac_list not found in results?
A: The microbe may not be detected within the selected analysis scope (samples/cell types/levels), or the provided name may not exactly match the matrix naming convention.
Methods
Download 16S_basic_statistics Method
References
[1] Lin NY, Fukuoka S, Koyama S, et al. Microbiota-driven antitumour immunity mediated by dendritic cell migration[J]. Nature. 2025 Aug;644(8078):1058-1068.
[2] Galeano Niño JL, Wu H, LaCourse KD, et al. Effect of the intratumoral microbiota on spatial and cellular heterogeneity in cancer[J]. Nature. 2022 Nov;611(7937):810-817.
[3] Zhou D, Wu C, Li C, et al. SLAMF7 regulates goblet cell mucus production and negatively impacts gut homeostasis and commensalism[J]. Gut Microbes. 2025 Dec;17(1):2527857.