Processing
Expression Library Analysis
estep1: Barcode/UMI Extraction
Transcriptome Library Structure:
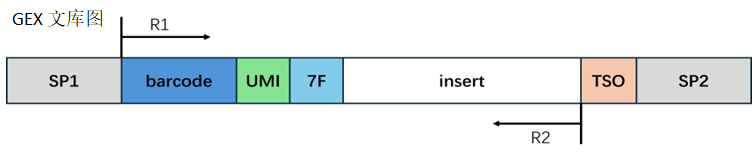
Barcode Processing:
According to the structural design, extract the corresponding sequence. When the extracted barcode sequence is in the whitelist, we consider it a valid barcode and count the number of Reads for the valid barcode; when the barcode is not in the whitelist, we consider it an invalid barcode.
TIP
During the sequencing process, there is a certain probability of sequencing errors. Provided with a whitelist, SeekArc™ Tools v1.1.0 can attempt barcode correction. When correction is enabled, if an invalid barcode exists in the whitelist with one base mismatch (one hamming distance):
- Only one sequence exists in the whitelist: We correct this invalid barcode to the barcode in the whitelist.
- Multiple sequences exist in the whitelist: We change this invalid barcode to the sequence with the most supporting Reads.
Adapter Processing:
In the transcriptome, the reverse complement sequence of 7F may appear at the end of Reads 2, which is the adapter sequence that may be introduced during library construction. We trim these contaminant sequences. The length of the trimmed Reads 2 needs to be greater than the set minimum length to ensure sufficient information to accurately align to the genome position. If the length of the trimmed Reads 2 is less than the minimum length, we consider this Read as an invalid Read.
estep2: Alignment and Gene Mapping
Sequence Alignment
- SeekArc™ Tools v1.1.0 uses STAR alignment software to align the processed R2 to the reference genome.
- SeekArc™ Tools v1.1.0 uses QualiMap software and the transcript annotation file GTF to count the proportion of Reads aligned to exons, introns, and intergenic regions.
- Uses featureCounts to annotate aligned Reads to genes, with options for different annotation rules such as strand specificity and quantification feature. When using exon quantification, if more than 50% of the bases of a Read map to an exon region, the Read is considered to originate from that exon and the corresponding gene; when using transcript quantification, if more than 50% of the bases of a Read map to a transcript region, the Read is considered to originate from that transcript and the corresponding gene.
After the above processing, the following data metrics are available:
- Reads Mapped to Genome: The proportion of Reads aligned to the reference genome out of all Reads (including Reads with only one alignment position and multiple alignment positions).
- Reads Mapped Confidently to Genome: The proportion of Reads with only one alignment position on the reference genome out of all Reads.
- Reads Mapped to Intergenic Regions: The proportion of Reads aligned to intergenic regions out of all Reads.
- Reads Mapped to Intronic Regions: The proportion of Reads aligned to intronic regions out of all Reads.
- Reads Mapped to Exonic Regions: The proportion of Reads aligned to exonic regions out of all Reads.
estep3: Quantification
UMI Quantification:
SeekArc™ Tools v1.1.0 extracts featureCounts output bam data by barcode unit, and counts the UMIs annotated to genes and the Reads corresponding to UMIs:
- Filter out Reads where the corresponding UMI is a single repeating base, such as UMI being TTTTTTTT.
- When a Read is annotated to multiple genes, it is a valid Read if there is a unique exon annotation; otherwise, it is filtered out.
UMI Correction:
NOTE
During sequencing, UMIs also have a certain probability of sequencing errors. SeekArc™ Tools v1.1.0 defaults to using the adjacency method of UMI-tools to correct UMIs.
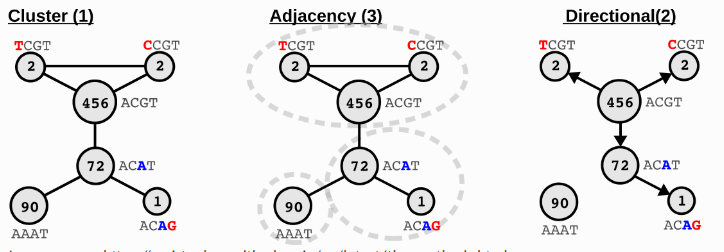
Image source: https://umi-tools.readthedocs.io/en/latest/the_methods.html
ATAC Library Analysis
astep1: Barcode Extraction
ATAC Library Structure:
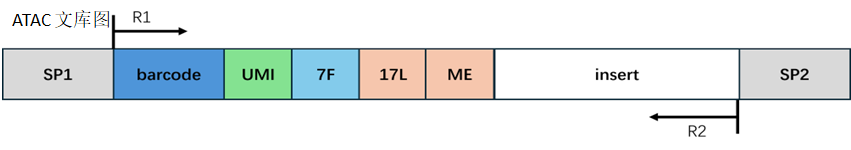
Barcode Processing:
Same processing method as estep1.
Adapter and Reads Processing:
In the ATAC library, Reads 1 has a fixed sequence, and adapter sequences may appear at the end; Reads 2 may have the reverse complement sequence of the fixed sequence and adapter sequences at the end. We trim these contaminant sequences. The length of the trimmed Reads 1 or Reads 2 needs to be greater than the set minimum length to ensure sufficient information to accurately align to the genome position. If the length of the trimmed Reads 1 or Reads 2 is less than the minimum length, we consider this Read as an invalid Read; if the length of the trimmed Reads 1 or Reads 2 is greater than 50, the first 50bp of the Reads 1 or Reads 2 sequence is truncated; if the length of the trimmed Reads 1 or Reads 2 is less than 50 and greater than the minimum length, the entire sequence of Reads 1 or Reads 2 is retained.
astep2: Alignment
Sequence Alignment:
Use bwa mem to align the processed Reads 1 and Reads 2 to the reference genome.
astep3: Quantification
Use SnapATAC2 v2.8.0 to process the BAM file output from astep2.
- Read BAM, get ATAC Sequencing and Mapping related metrics.
- Generate raw fragments file from BAM. Filter out mitochondria-related fragments to get filtered fragments file.
- Generate Anndata object from filtered fragments file.
- Plot TSS score distribution.
- Use MACS3 for call peak, and filter duplicate peaks, output to peaks.bed.
- Generate raw_peaks_bc_matrix based on peaks.
- Count related metrics for each barcode, output to per_barcode_metrics.csv.
- Plot insert size distribution.
- Cell determination.
- Generate filtered_feature_bc_matrix and filtered_peaks_bc_matrix.
- Count ATAC Cells and Targeting related metrics.
Cell Determination
If --min_atac_count and --min_gex_count are specified:
- Barcodes with UMI count greater than min_gex_count and events count greater than min_atac_count are determined as cells.
If not specified:
- First, retain barcodes with UMI count greater than 1 or events in peaks count greater than 1.
- Then, filter barcodes where "the fraction of fragments overlapping called peaks" is less than "the fraction of genome in peaks" (extend peaks range by 2kb forward and backward, merge two peaks ranges if extended peaks overlap).
- Remove duplicates. Filter barcodes with identical UMI values and events in peaks values.
- Log10 transform the UMI values and events in peaks values of the filtered barcodes.
- Use KMeans algorithm to divide barcodes into two groups based on transformed UMI values and events in peaks values, where the group with higher mean is cells and the other is not cells.
- Map the filtered out barcodes to cells or non-cells based on determined barcodes.
- Set maximum cell number to 20000.
astep4: Downstream Analysis
After the above steps, once the cell expression matrix and ATAC matrix are obtained, we can proceed to the next step of analysis.
Use Signac v1.14.0 to merge the cell expression matrix and ATAC matrix into a seurat object, filter features not in the database, normalize the expression matrix and ATAC matrix respectively, find highly variable genes, perform dimensionality reduction and clustering, find differential genes, perform WNN grouping, and finally calculate feature link.