scMethyl + RNA Multi-omics Analysis Guideline
Single-cell transcriptomics and single-cell methylation can simultaneously capture gene expression and epigenetic information within the same cell, helping characterize the associations among methylation changes, regulatory factors, gene expression, and cellular phenotypes.
Based on scMethyl + RNA multi-omics data, users can perform systematic analyses at multiple levels, including cell type annotation, subpopulation identification, developmental or disease-state dynamics, tumor heterogeneity, and clonal structure. In addition, differentially methylated regions (DMRs), differentially methylated genes (DMGs), differentially expressed genes (DEGs), functional enrichment, and motif analysis can be integrated to build an evidence chain from epigenetic regulation to gene expression and biological function, providing references for mechanistic interpretation, candidate target screening, and follow-up experimental validation.
To help users understand the analysis logic and key outputs of single-cell methylation multi-omics, SeekGene provides a systematic set of downstream analysis workflows and tutorials, covering doublet identification, data quality control and integration, differentially expressed gene (DEG) analysis, differentially methylated region (DMR) analysis, functional enrichment and motif analysis, methylation-based lineage and clonal-structure analysis, and tumor cell identification.
Each tutorial clearly defines input file requirements, applicable scenarios, core analysis steps, and major output results, with standardized code and example results. Users can select suitable analysis modules according to project-specific objectives and complete data interpretation and result presentation efficiently.
SeekSoul Methyl Tools
SeekSoul Methyl Tools is SeekGene's standardized analysis pipeline for single-cell methylation dual-omics, supporting the full-link processing from raw sequencing data (FASTQ) to cell-level expression and methylation detection. It provides a one-stop coverage for quality control, reads alignment, cell expression matrix construction, methylation site detection, result visualization, and report generation; it also provides complete runtime environment requirements, installation guides, sample data, and parameter templates, facilitating quick start and batch project deployment, and building a stable, reproducible production line from "raw data" to "analyzable matrix".
🔗 SeekSoul Methyl Tools Website: SeekSoul Methyl Tools
Doublet Identification
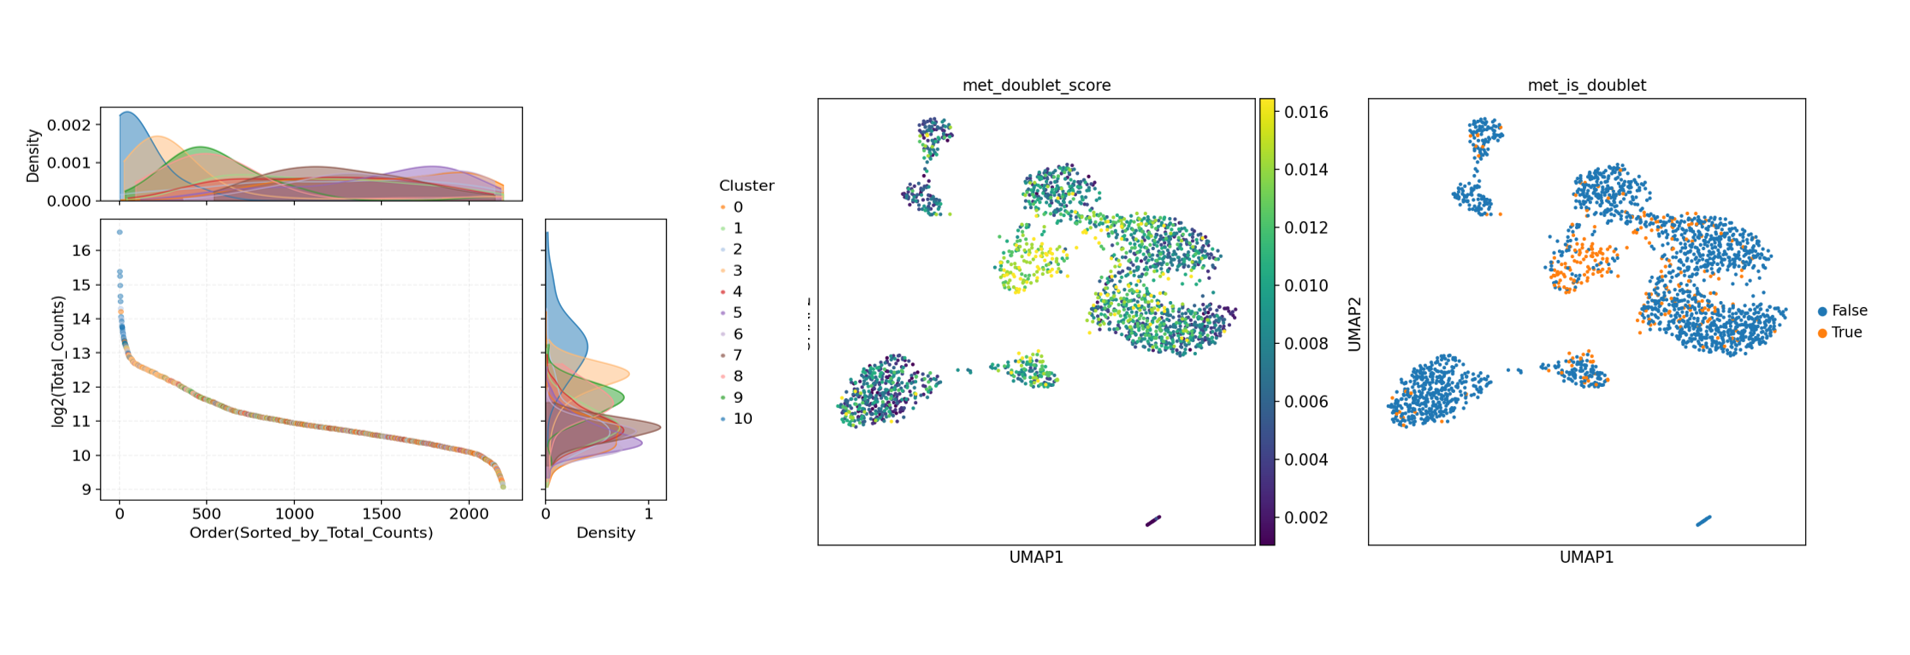
Single-cell library construction may produce "doublets" due to factors such as high loading concentration, cell adhesion/damage, two cells co-encapsulated in a droplet, or index collisions during the barcode/library construction process, where expression or methylation characteristics appear mixed. If not removed, they can easily create pseudo-intermediate states and pseudo-clusters, interfering with cell type annotation and reducing the interpretability and reproducibility of results. Therefore, doublets should be identified and filtered before downstream analysis.
Doublet Identification Tutorial provided by SeekGene: scMethyl+RNA_Multi-omics_Doublet_Detection.ipynb
This tutorial integrates three types of doublet determination methods:
- Transcriptome-based expression abnormalities.
- Methylation reads count-based abnormalities.
- Methylation rate-based MethylScrublet determination.
Improving the robustness of doublet detection from different dimensions.
Input Files
- Transcriptome Expression Matrix: RNA-level gene expression matrix (
filtered_feature_bc_matrixfolder). - Single-Cell Methylation Data: Methylation dataset in MCDS format (
.mcdsfile). - Barcode Mapping File (Optional): For dual-index libraries, i.e., using DD-MET3 construction, RNA and methylation data cell barcodes need to be matched.
- Download Link: DD-M_bUCB3_whitelist.csv.
Output Files
- Doublet Determination Results:
sample_doublet.txt. - Visualization Plots: Cell UMI distribution plots, methylation reads distribution plots, doublet identification distribution plots, etc.
Basic Analysis
In single-cell analysis, data from different samples, groups, and batches need to be projected onto a unified coordinate system for comparison. Sample integration not only improves the consistency of cell type annotation and enhances the detection of rare cells and weak signals but also supports cross-sample and cross-condition comparisons (e.g., different patients, different treatments), constructing an extensible reference atlas and robustly identifying cell populations reproduced across datasets, thereby driving in-depth mining of subsequent data.
Basic Analysis Tutorial: scMethyl+RNA_Multi-omics_Basic_Analysis.ipynb
This tutorial is a methylation dual-omics integration pipeline template developed by SeekGene based on ALLCools, Scanpy, and Harmony, covering data quality control, batch correction, dimensionality reduction clustering, and visualization. By configuring inputs and parameters according to the template, users can quickly complete integration analysis and obtain standardized, reproducible results and plots, improving analysis efficiency and the interpretability and reproducibility of conclusions.
Input Files
- Transcriptome Expression Matrix: RNA-level gene expression matrix (
filtered_feature_bc_matrixfolder). - Single-Cell Methylation Data: Methylation dataset in MCDS format (
.mcdsfile). - Barcode Mapping File (Optional): For dual-index libraries, i.e., using DD-MET3 construction, RNA and methylation data cell barcodes need to be matched.
- Download Link: DD-M_bUCB3_whitelist.csv.
Output Files
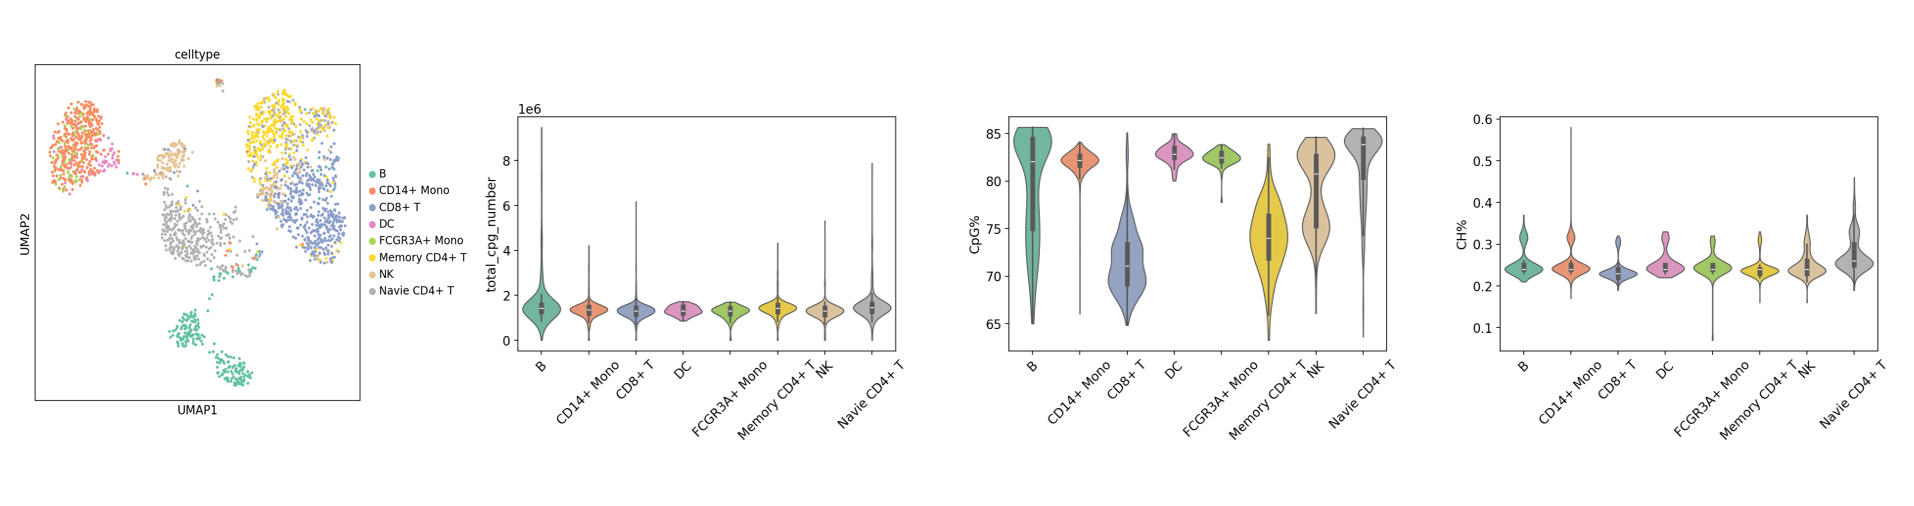
adata_rna.h5ad: Expression data integration results.adata_met.h5ad: Methylation data integration results.- Visualization Images: Quality control plots, cluster UMAP plots, gene expression UMAP plots, etc.
Multi-modal Integration Analysis
After completing the basic analysis of single-cell transcriptomics (RNA) and single-cell methylation (DNA Methylation), the key to revealing epigenetic regulatory mechanisms lies in the deep integration of these two distinct modalities at the single-cell level. Multi-modal integration overcomes the limitations of single-omics data, allowing for more precise definition of cell states and resolution of the regulatory logic from DNA methylation modifications to gene expression levels.
SeekGene provides the following two mainstream multi-modal integration solutions:
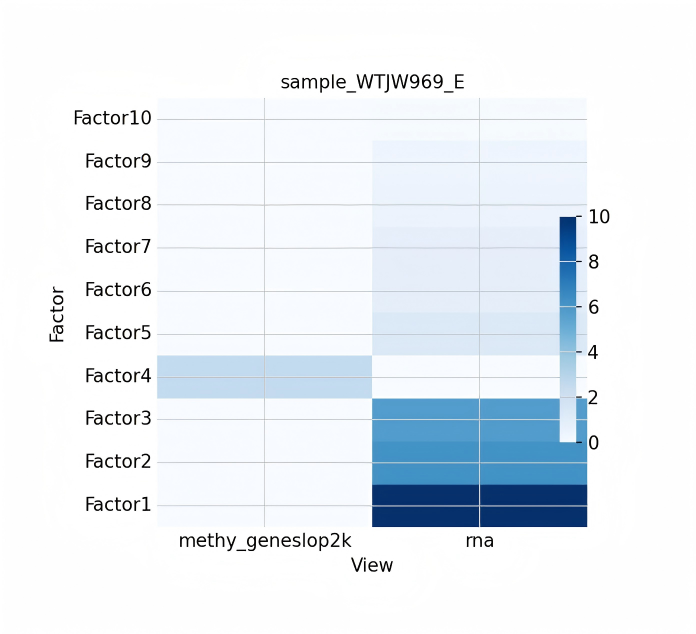
- MOFA+ Multi-modal Integration Analysis. Tutorial Documentation: scMethyl+RNA_Multi-omics_Integration_MOFA+.ipynb. Utilizes the MOFA+ (Multi-Omics Factor Analysis) framework to integrate single-cell RNA and methylation data through an unsupervised learning approach. By performing Latent Factors analysis, this method effectively quantifies the contribution weights of each omics modality to cell clustering, identifies cross-omics shared variations and omics-specific variations, and is ideal for exploring complex inter-omics interactions and discovering new cell subpopulation characteristics.
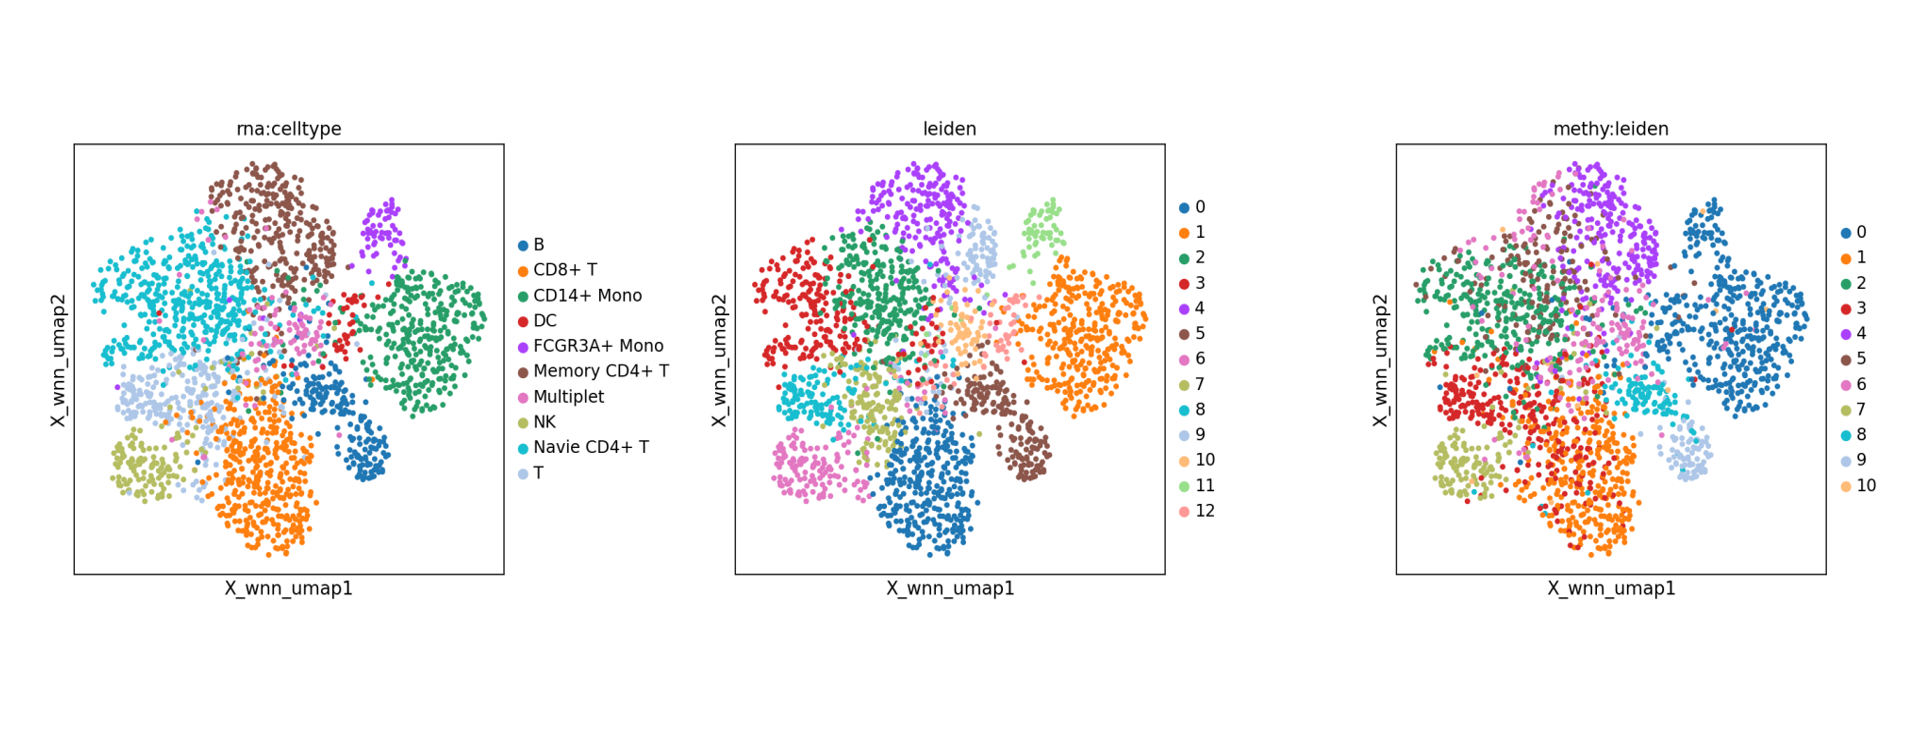
- WNN Multi-modal Integration Analysis. Tutorial Documentation: scMethyl+RNA_Multi-omics_Integration_WNN.ipynb. Based on the WNN (Weighted Nearest Neighbor) algorithm within the Seurat framework, this method automatically assigns weights based on the information content of each modality in every cell to construct a weighted nearest neighbor graph. It simultaneously leverages the high sensitivity of RNA and the epigenetic features of methylation to achieve more robust clustering and visualization. Compared to single-omics analysis, WNN integration typically offers higher biological resolution, identifying subtle cell state differences that might be masked in individual modalities.
Differences and Functional Enrichment
After single-cell annotation is complete, molecular differences between different cell populations/subpopulations need to be systematically compared, producing interpretable DEG/DMG/DMR lists, mapping "differentially expressed genes/regions" to biological processes and pathways, identifying key regulatory factors (TFs) and core mechanisms, extracting high-value functional modules from massive differences, and locating candidate pathways and genes for diagnosis/typing/prognosis, supporting target and biomarker screening and efficacy/immune assessment. Simultaneously, methylation (DMR/DMG) and expression (DEG) are placed within a unified functional framework for correlation, building an "epigenetic-expression-phenotype" evidence chain to enhance the credibility and translatability of conclusions.
Differential Analysis Tutorial: scMethyl+RNA_Multi-omics_Differential_Analysis_Functional_Enrichment_Analysis.ipynb
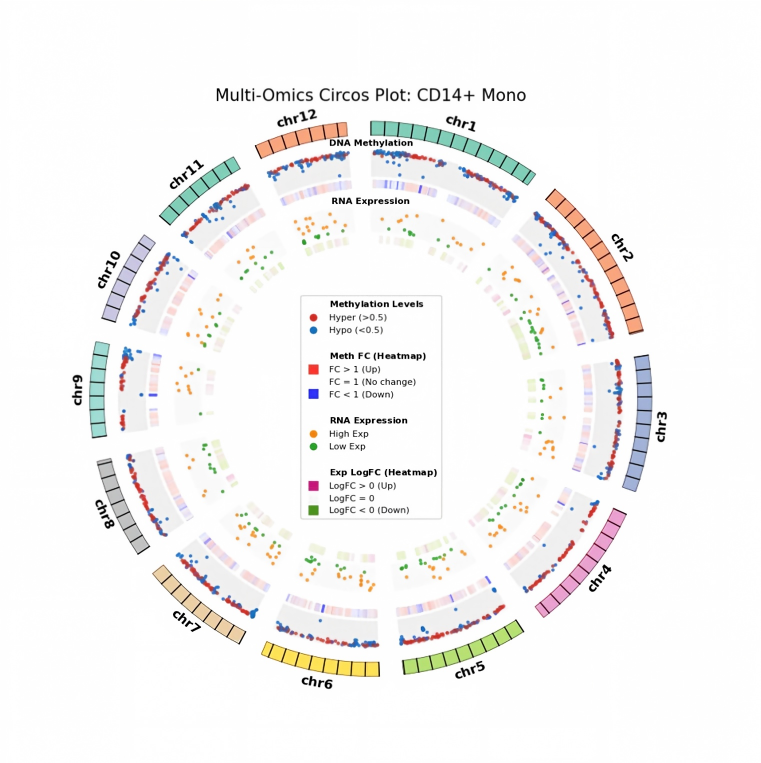
Differential functional enrichment analysis pipeline between cell populations based on methylation dual-omics data. With cell annotation completed, DMB analysis is performed using a 20 kb genomic window, DMG analysis using a gene region ±2 kb, and DEG identification; subsequently, multi-omics visualization correlation analysis is presented through Venn and Circos plots to resolve the linkage between methylation levels and gene expression, forming mechanistic clues and a priority validation list.
Input Files
adata_rna.h5ad: RNA-level integration annotation file containing cell annotation information and gene IDs, i.e., h5ad containsobs['celltype'],var['gene_ids'].adata_met.h5ad: Methylation-level integration annotation file containing annotated methylation data and sample information, i.e., h5ad containsobs['celltype'],obs['Sample'].- MCDS Format Data: Contains methylation information for 20 kb windows and gene regions ±2 kb, i.e.,
chrom20k,geneslop2k; other regional data can be set as needed.
Output Files
- DMB Analysis Results: Differential methylation block analysis results for different cell populations.
DEG.csv: Differentially expressed gene analysis results for different cell populations.hdf.hdfFile: DMG and DMB analysis results for all cell populations.- Visualization Plots: DEG and DMG visualization Venn plots, Circos plots, GO/KEGG visualization bar charts, bubble plots, etc.
Inter-group Differential Analysis
After single-cell annotation is complete, besides comparing differences in composition and proportion across different groups (e.g., disease/control, treated/untreated) in each cell population, it is more important to systematically evaluate inter-group changes in gene expression and methylation within cell populations, associating detected differences with potential biological mechanisms, and identifying epigenetic regulatory factors and signaling pathways driving cell state transitions. By linking methylation and transcriptome data and anchoring them to specific cell populations, key cell types, pathways, and regulatory elements are located, providing direct mechanistic hypotheses for understanding how epigenetic changes affect gene expression and ultimately lead to phenotypic differences in development or disease.
Inter-group Differential Analysis Tutorial: scMethyl+RNA_Multi-omics_InterGroup_CellType_Differential_Enrichment_Analysis.ipynb
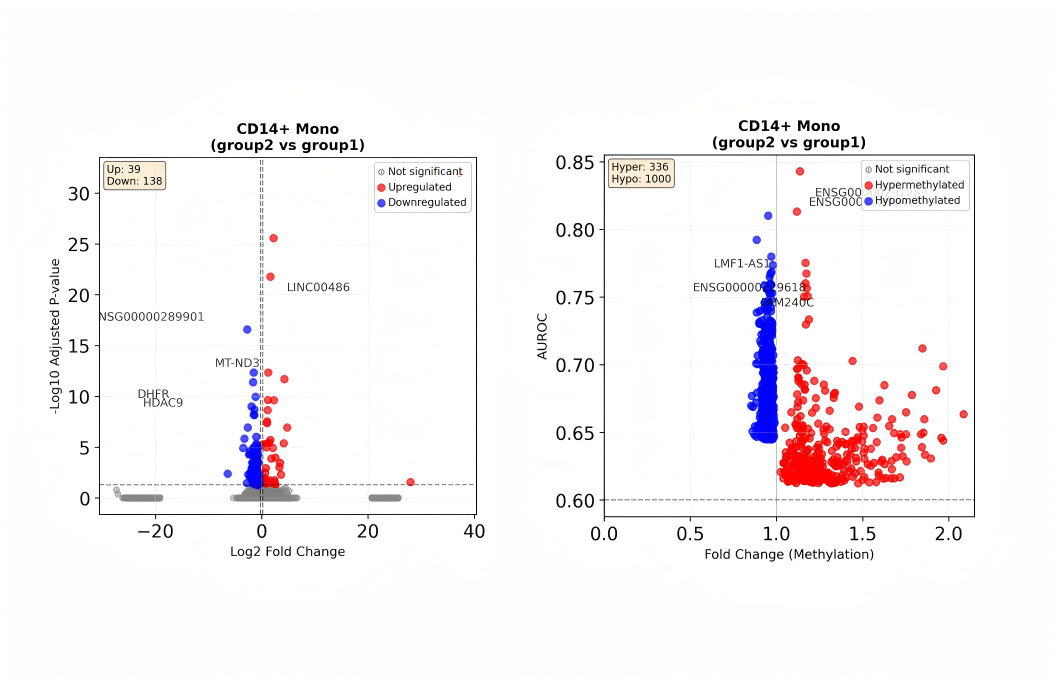
Inter-group differential analysis tutorial based on methylation dual-omics: based on cell annotation, perform differentially expressed gene (DEG) and differentially methylated gene (DMG) analysis by cell type, and perform GO/KEGG functional enrichment for differential genes; subsequently, perform multi-omics correlation integration (e.g., cross-analysis of DEG and DMG), resolve the relationship between methylation levels and gene expression, and intuitively display dual-omics correlations with Venn and Circos plots; simultaneously mine key transcription factors and elucidate the regulatory role of epigenetic modifications on gene expression.
Input Files
adata_rna.h5ad: RNA-level integration annotation file containing cell annotation information and gene IDs, i.e., h5ad containsobs['celltype'],var['gene_ids'].adata_met.h5ad: Methylation-level integration annotation file containing annotated methylation data and sample information, i.e., h5ad containsobs['celltype'],obs['Sample'].- MCDS Format Data: Contains methylation information for gene regions ±2 kb, i.e.,
geneslop2k; other regional data can be set as needed.
Output Files
DEG_group_comparison.csv: Inter-group differential analysis results for cell populations.DMG_group_comparison.csv: Inter-group DMG differential analysis results for cell populations.- Visualization Plots: DEG volcano plots, DMG differential volcano plots, DEG and DMG correlation visualization Venn plots, Circos plots, GO/KEGG visualization bar charts, bubble plots, etc.
MethSCAn Analysis
MethSCAn is an analysis tool for single-cell methylation data. Its core pipeline includes: converting raw single-cell methylation read counts into a sparse matrix (CSR) by chromosome coordinates; smoothing site signals along the genome to reduce noise caused by low coverage and positional randomness; scanning the whole genome based on inter-cellular methylation variation to detect variably methylated regions (VMRs); and performing two-group comparisons at the regional level to output differentially methylated regions (DMRs).
MethSCAn Tutorial: Provided by SeekGene, using MethSCAn to complete VMR detection and DMR analysis based on single-cell methylation data.
- Documentation: scMethyl+RNA_Multi-omics_MethSCAn_Differential_Methylation_Analysis.ipynb.
- Format Conversion: Before running, allc files generated by the SeekSoulMethyl pipeline need to be converted to bismark coverage format.
- Conversion Script: allc_to_bismarkCov.py.
DMRs_rGREAT Analysis
After completing differentially methylated region (DMR) analysis for single-cell methylation data, DMRs need to be associated with neighboring genes and subjected to functional enrichment (methylation region enrichment analysis) to clarify the biological processes and signaling pathways they might affect. Summarizing key GO/KEGG terms, candidate regulatory links, and potential driving factors from a large number of regions, and unifying DMR and DEG/transcription factor (TF) enrichment results into the same functional framework, constructs a coherent "epigenetic-expression-phenotype" evidence chain.
rGREAT Analysis Tutorial: scMethyl+RNA_Multi-omics_DMR_Functional_Enrichment_Analysis.ipynb
SeekGene uses rGREAT to annotate DMRs. rGREAT associates DMRs with neighboring genes and evaluates the enrichment of these genes in Gene Ontology (GO) and KEGG functional categories, outputting region-gene association results and GO/KEGG enrichment results to provide a basis for pathway resolution and mechanistic inference.
HOMER Motif Analysis
In single-cell methylation data analysis, sequences of differentially methylated regions (DMR/VMR) should be mapped to potential transcription factor (TF) binding sites to build a "methylation change → TF occupancy → gene regulation → expression difference" causal chain, and linked enriched TFs with their target genes to resolve upstream regulatory factors in cell type/state transitions, disease drivers, and therapeutic responses. Compared to performing only GO/KEGG enrichment, motif analysis points directly to the regulatory factor level, better helping to propose mechanistic hypotheses and design validation paths.
HOMER Analysis Documentation: scMethyl+RNA_Multi-omics_DMR_Motif_Enrichment_Analysis.ipynb
Provides an analysis pipeline based on HOMER for performing DNA sequence motif enrichment in genomic regions (e.g., ChIP-seq peaks, DMRs, etc.), identifying potential TF binding sites, and supporting the use of results for upstream regulatory resolution and TF-target gene association.
MethylTree Lineage Analysis
Single-cell DNA methylation patterns can reflect cell-state differences and certain clonal or lineage-related information. Based on CpG methylation similarity across genomic bins, MethylTree can construct cell-cell distance relationships, helping users examine hierarchical structures within cell populations, infer potential clonal structures, and interpret cellular heterogeneity together with RNA annotations or cell type information.
MethylTree Lineage Analysis Tutorial: scMethyl+RNA_Multi-omics_MethylTree_Lineage_Analysis.ipynb
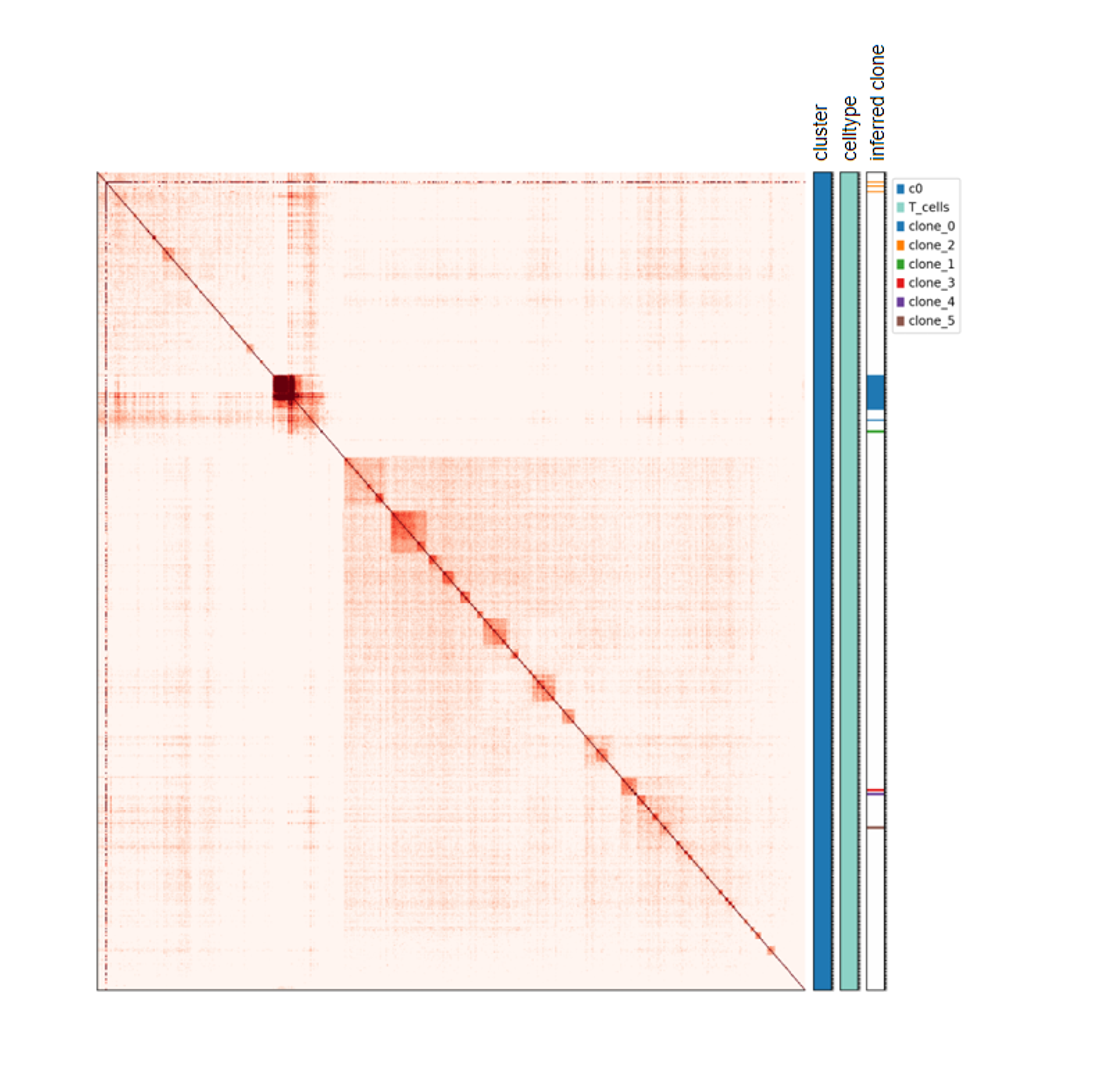
This tutorial starts from single-cell allc files and a cell annotation table. It first aggregates CpG methylation signals into fixed-length genomic bins and generates the input files required by the MethylTree main program. It then runs MethylTree to perform cell-cell similarity calculation, clonal-structure inference (clone inference), and heatmap visualization. This analysis is suitable for projects that aim to interpret cell lineage relationships, clonal structure, or tumor heterogeneity from the methylation modality.
Major results include a cell-cell methylation similarity heatmap, clonal-structure inference results, and visualizations with inferred clone annotations.
Copykit CNV Analysis
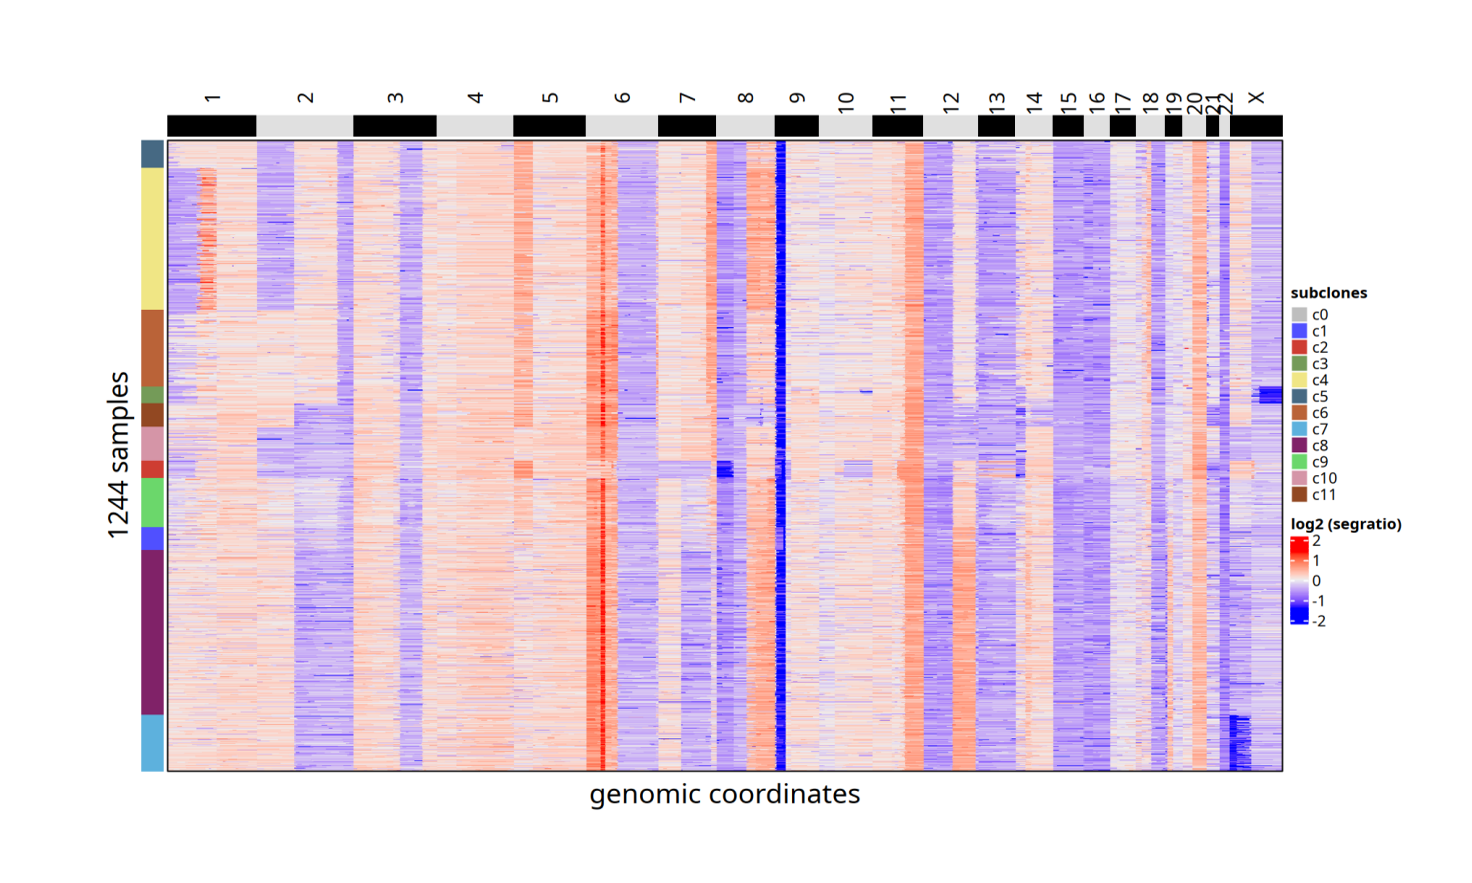
For tumor tissues, Copykit can be used to perform copy number variation (CNV) analysis on single-cell methylation data. Copykit counts read depth within preset genomic bins/regions based on aligned BAM files, focusing on regional-level signals rather than single nucleotides, thereby distinguishing tumor from normal cells, resolving tumor cell heterogeneity, constructing clonal lineages and evolutionary trajectories, and identifying dominant and secondary subclones.
Copykit Tumor Cell Determination and Clonal Analysis Documentation: scMethyl+RNA_Multi-omics_CNV_Analysis.ipynb
This document provides data preparation and running examples for three input scenarios (existing Copykit rds, single-cell BAM, only Bulk BAM), covering key steps, commands, and parameters such as "BAM splitting → flag correction → UMI deduplication → runVarbin", helping users quickly complete tumor cell determination and clonal resolution.
Data Analysis Recommendations
Note: The tutorials are based on methylation dual-omics data and aim to provide actionable references for data integration, differential resolution, and mechanistic inference, with general applicability; however, they may not be perfectly suited to all project analysis situations. Please adapt and select based on sample characteristics and research objectives.
Recommended Workflow:
- Complete "Doublet Identification" and "Basic Integration Analysis" first.
- Then choose "Differential Analysis and Functional Enrichment", "MethSCAn", "HOMER", "MethylTree", or "CopyKit" according to the analysis objective.
Result Linkage:
DMR→HOMER/rGREAT.DEG/DMG→GO/KEGG.MethylTree→Methylation similarity structure and clonal structure interpretation.CNV→Tumor Clonal and Subcluster Assistance.