
Processing
Expression Library Analysis
estep1: Barcode/UMI Extraction
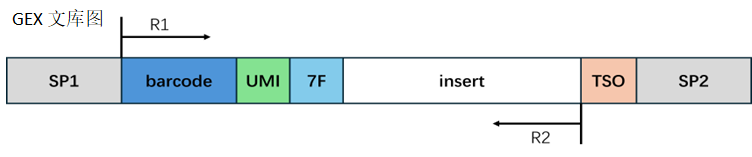
Gene expression library structure:
Barcode processing:
The corresponding sequences are extracted according to the library structure. If an extracted barcode is present in the whitelist, it is considered a valid barcode, and its supporting reads are counted as valid-barcode reads. If the barcode is not present in the whitelist, it is considered an invalid barcode.
TIP
Sequencing errors may occur during sequencing. When a whitelist is provided, SeekArc Tools v1.2.0 can attempt barcode correction. When correction is enabled and whitelist candidates exist at a Hamming distance of 1 from an invalid barcode:
- If only one candidate sequence is present in the whitelist, the invalid barcode is corrected to that whitelist barcode.
- If multiple candidate sequences are present in the whitelist, the invalid barcode is corrected to the candidate supported by the largest number of reads.
Adapter processing:
In the gene expression library, the reverse-complement sequence of 7F and adapter sequences introduced during library construction may occur at the end of Read 2. These contaminating sequences are trimmed. After trimming, Read 2 must be longer than the specified minimum length to retain sufficient information for accurate alignment to the reference genome. If the trimmed Read 2 is shorter than the minimum length, the read is considered invalid.
estep2: Alignment and Gene Assignment
Sequence alignment:
- SeekArc Tools v1.2.0 uses STAR to align the processed R2 reads to the reference genome.
- SeekArc Tools v1.2.0 uses QualiMap together with the transcript annotation GTF file to calculate the proportions of reads aligned to exonic, intronic, and intergenic regions.
- SeekArc Tools v1.2.0 uses featureCounts to assign aligned reads to genes. Different annotation rules can be selected, including strand specificity and the feature used for quantification. For exon-based quantification, a read is assigned to an exon and its corresponding gene when more than 50% of the read bases align to the exon region. For transcript-based quantification, a read is assigned to a transcript and its corresponding gene when more than 50% of the read bases align to the transcript region.
The following major metrics are generated:
- Reads Mapped to Genome: Percentage of all reads aligned to the reference genome, including uniquely mapped and multi-mapped reads.
- Reads Mapped Confidently to Genome: Percentage of all reads with only one alignment position in the reference genome.
- Reads Mapped to Intergenic Regions: Percentage of reads aligned to intergenic regions.
- Reads Mapped to Intronic Regions: Percentage of reads aligned to intronic regions.
- Reads Mapped to Exonic Regions: Percentage of reads aligned to exonic regions.
estep3: Quantification
UMI quantification:
SeekArc Tools v1.2.0 processes the BAM file generated by featureCounts by barcode and calculates the number of UMIs assigned to each gene and the number of reads supporting each UMI.
- Reads with UMIs composed of a single repeated base are filtered, for example,
TTTTTTTT. - When a read is assigned to multiple genes, it is retained only when a unique exon assignment can be determined; otherwise, it is filtered.
UMI correction:
NOTE
Sequencing errors may also occur in UMIs. By default, SeekArc Tools v1.2.0 uses the adjacency method implemented in UMI-tools for UMI correction.
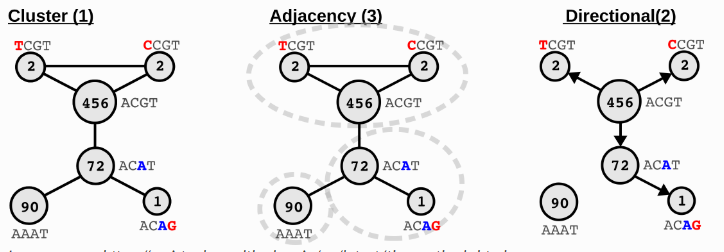
Image source: https://umi-tools.readthedocs.io/en/latest/the_methods.html
ATAC Library Analysis
astep1: Barcode Extraction
ATAC library structure:

Barcode processing:
The barcode processing method is the same as that used in estep1.
Adapter and read processing:
In the ATAC library, Read 1 contains a fixed sequence and may contain an adapter sequence at its end. Read 2 may contain the reverse complement of the fixed sequence and an adapter sequence at its end. These contaminating sequences are trimmed. The trimmed Read 1 and Read 2 must be longer than the specified minimum length to retain sufficient information for accurate alignment to the reference genome. If either trimmed read is shorter than the minimum length, the read is considered invalid. If a trimmed read is longer than 50 bp, only the first 50 bp are retained. If its length is no more than 50 bp but remains above the minimum length, the entire sequence is retained.
astep2: Alignment
Sequence alignment:
BWA-MEM is used to align the processed Read 1 and Read 2 sequences to the reference genome.
astep3: Quantification
SnapATAC2 v2.8.0 is used to process the BAM file generated by astep2.
- Read the BAM file and calculate ATAC sequencing and mapping metrics.
- Generate the raw fragments file from the BAM file. By default, fragments on mitochondrial chromosomes (
chrM,M,chrMT, andMT) are filtered; mitochondrial fragments are retained when--keep_mitois enabled. - Generate an AnnData object from the filtered fragments file.
- Generate the TSS enrichment score distribution.
- Use MACS3 for Peak calling, remove duplicated Peaks, and output
peaks.bed. - Generate
raw_peaks_bc_matrixbased on the called Peaks. - Calculate metrics for each barcode and output
per_barcode_metrics.csv. - Generate the fragment-length distribution.
- Perform joint RNA and ATAC cell calling.
- Generate
filtered_feature_bc_matrixandfiltered_peaks_bc_matrix. - Calculate ATAC Cells, Targeting, TSS, sequencing saturation, and related metrics.
Cell Calling
When both --min_atac_count and --min_gex_count are specified:
- A barcode is called as a cell when its GEX UMI count is greater than or equal to
min_gex_countand its number of ATAC events within Peak regions is greater than or equal tomin_atac_count. - The two parameters must be used together. Specifying only one of them does not enable threshold-based cell calling.
When the two parameters are not specified together, automatic cell calling is performed:
- Retain barcodes with a GEX UMI count greater than 1 and an ATAC event count within Peak regions greater than 1.
- Compare the fraction of fragments overlapping Peaks for each barcode with the fraction of the genome covered by extended Peaks. Peak regions are extended by 2 kb upstream and downstream, and overlapping extended regions are merged. Only barcodes with a fraction of fragments overlapping Peaks greater than the corresponding genomic fraction are retained.
- Remove duplicate combinations of GEX UMI counts and ATAC event counts within Peak regions.
- Transform the GEX UMI counts and ATAC event counts using
ln(x + 0.1). - Use K-Means to divide the barcodes into two clusters. The cluster with higher centroid values for both metrics is called as cells. A fixed random seed is used to improve consistency across repeated runs.
- When
--max_cellsis specified and the number of automatically identified cells exceeds the limit, retain the top N barcodes with the greatest distance from the non-cell cluster centroid. If the parameter is not specified, no upper limit is applied. - When
--strict_cell_callingis enabled, an ambient RNA background test is additionally performed using the raw expression matrix, and the intersection of the ambient RNA result and the K-Means result is used as the final cell set.
astep4: Downstream Analysis
After the cell gene expression matrix and ATAC matrix have been generated, downstream analysis can be performed.
Signac v1.14.0 is used to combine the cell gene expression matrix and ATAC matrix into a Seurat object. The RNA data are processed using normalization, highly variable gene selection, dimensionality reduction, clustering, and marker gene analysis. The ATAC data are processed using TF-IDF normalization, LSI dimensionality reduction, and clustering, followed by Peak–gene linkage analysis.
RNA-only Library Analysis
RNA-only library analysis uses the barcode/UMI extraction, sequence alignment, and UMI quantification methods described above for the gene expression library. Unlike ARC multi-omics analysis, this workflow uses only the RNA library for cell calling and downstream analysis and does not perform ATAC library analysis or joint RNA–ATAC cell calling.
step1: Barcode/UMI Extraction
Barcode/UMI extraction, barcode correction, and adapter processing are performed in the same way as in estep1.
After processing, FASTQ files are generated for downstream alignment.
step2: Alignment and Gene Assignment
Sequence alignment and gene assignment are performed in the same way as in estep2.
By default, the processed Read 2 sequences are aligned to the reference genome in single-end mode. Paired-end alignment using processed Read 1 and Read 2 is also supported. In paired-end mode, Read 1 and Read 2 are filtered synchronously; if either read does not meet the requirements, the corresponding read pair is removed.
STAR is used for sequence alignment, QualiMap is used to calculate the distribution of reads across exonic, intronic, and intergenic regions, and featureCounts is used to assign aligned reads to genes.
step3: UMI Quantification and Cell Calling
UMI quantification and correction are performed in the same way as in estep3. After quantification, raw_feature_bc_matrix is generated, and cells are identified according to the gene expression UMI counts of individual barcodes.
Cell calling first selects high-expression barcodes based on UMI counts to form an initial cell set. Low-UMI barcodes are then used to estimate the ambient RNA background expression profile, and candidate barcodes are tested against this background. Candidate barcodes that pass the background test are combined with the initial cell set to obtain the final cell set. The workflow also supports direct selection of a specified number of high-UMI barcodes as cells based on UMI ranking.
The filtered_feature_bc_matrix is generated from the final cell barcodes, and quality-control metrics including the number of cells, genes per cell, UMI counts, and sequencing saturation are calculated.
step4: Downstream Analysis and Result Summary
A Seurat object is generated from the filtered expression matrix. The mitochondrial gene proportion is calculated, followed by expression normalization, highly variable gene selection, data scaling, PCA, neighbor calculation, clustering, t-SNE and UMAP dimensionality reduction, and marker gene identification. The final Seurat RDS is saved, cell embedding coordinates, UMI information, and marker gene results are exported, and RNA/GEX sequencing, alignment, quantification, and cell-related quality-control metrics are summarized.