Single-Cell Spatial Transcriptomics Analysis Guideline
Single-Cell Spatial Transcriptomics technology acquires gene expression profiles at single-cell resolution while preserving the spatial location information of tissues. It enables the in situ parsing of complex biological networks involving "cell type—spatial distribution—microenvironment—cell communication".
Based on single-cell spatial transcriptomics analysis, one can not only characterize fine molecular maps of tissue structures and identify spatially specific gene expression patterns but also deeply analyze tumor microenvironments, immune infiltration states, spatial dynamics of embryonic development, and regional heterogeneity of brain tissues. Combined with multiplexed cell communication and colocalization algorithms, it can reveal complex intercellular interaction mechanisms, providing a powerful spatial evidence chain for basic biological research, disease pathogenesis exploration, and potential target mining.
To help users quickly master the mining and key outputs of spatial transcriptomics data, SeekGene provides a systematic downstream analysis workflow and tutorials, covering key steps such as basic quality control (QC), dimensionality reduction and clustering, multi-sample integration, spatial microenvironment (Niche) identification, spatial colocalization, and multi-dimensional cell communication analysis. Each tutorial clearly defines input file specifications, applicable scenarios, and interpretable outputs, assisting users in efficiently completing data interpretation and translating results.
SeekSpace™ Tools
SeekSpace™ Tools is SeekGene's standardized analysis software for single-cell spatial transcriptomics data. It uses SeekSoul Tools as the core to process transcriptomics expression data and has been specifically expanded for spatial omics technologies. It supports the full-chain processing from raw sequencing data (expression libraries, spatial libraries, HDMI libraries) and section images (DAPI/HE) to cell-level spatial feature expression matrices.
It provides one-stop coverage of the following core analysis modules:
- Spatial Cell Localization: Precisely locates single cells to the physical pixel coordinates of the chip by parsing the mapping relationship between Spatial Barcodes and Cell Barcodes on the chip.
- Tissue Image Segmentation: Automatically processes tissue section images to achieve segmentation of effective tissue coverage areas from the background.
- Downstream Data Analysis: Built-in Seurat and Scanpy workflows to perform QC, dimensionality reduction, clustering, and differentially expressed gene (DEG) analysis on cells localized within tissue regions.
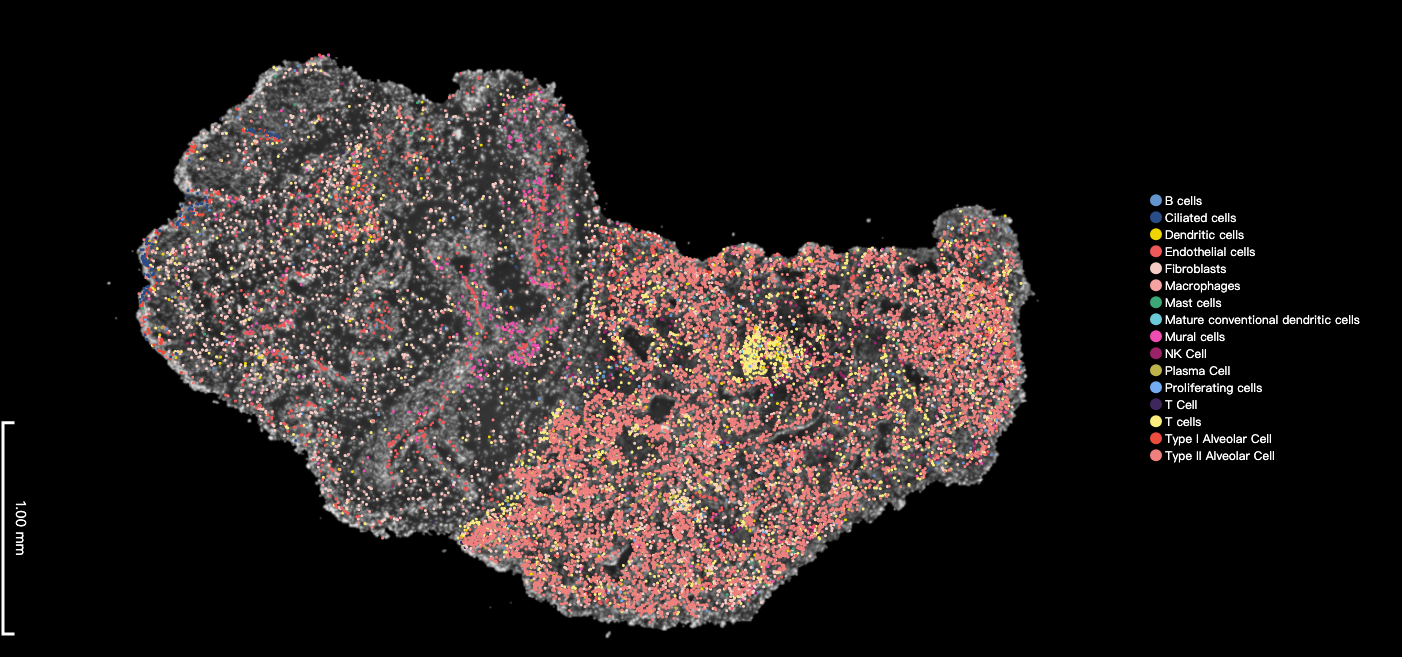
- Spatial Visualization: Accurately overlays clustering results onto in situ tissue images for display.
After processing by SeekSpace™ Tools, it provides high-quality standard inputs (including the filtered_feature_bc_matrix expression matrix and the cell_locations.tsv.gz file with real cell pixel coordinates) for subsequent advanced spatial mining.
Spatial Visualization and Image Correction
When overlaying spatial coordinates onto tissue images, precise alignment is a crucial prerequisite to ensure the reliability of the final visualization presentation and biological interpretation (e.g., intuitively confirming whether a certain type of cell accurately falls within the tumor region or a specific tissue structure).
Related Tutorial:
- Spatial Visualization Guideline: Single-Cell Spatial Transcriptomics: Spatial Visualization Guideline
Troubleshooting Tip: If you find significant alignment deviations (non-overlapping) between the cell distribution scatter plots and the underlying H&E or DAPI tissue images during the final spatial visualization display, you can refer to the instructions and code in the guideline above. While keeping the cell spatial coordinate matrix completely unchanged, you can achieve precise alignment by zooming in, zooming out, translating, and rotating the H&E or DAPI images. Finally, you can export the modified and corrected tissue images for high-quality publication figures or result presentations.
Basic Analysis
After obtaining the spatial expression matrix, systematic preprocessing, normalization, dimensionality reduction, and clustering analyses are required. Meanwhile, in multi-sample studies, eliminating batch effects and projecting different sections into a unified coordinate system is the prerequisite for constructing a consistent spatial reference map. The results of basic analysis serve as the foundation for all subsequent advanced spatial mining.
Related Tutorials:
- Basic Analysis (based on Seurat): Single-Cell Spatial Transcriptomics - Basic Data Analysis (Seurat)
- Basic Analysis (based on Scanpy): Single-Cell Spatial Transcriptomics - Basic Data Analysis (Scanpy)
Covers the workflow from single-sample QC, normalization (such as LogNormalize or SCTransform), PCA dimensionality reduction and clustering, to UMAP visualization. Users can choose the appropriate pipeline based on their programming preferences (R or Python).
Input Files
- Standard Spatial Transcriptomics Output: The
filtered_feature_bc_matrix(expression matrix) and corresponding spatial coordinate files output by SeekSpace™ Tools.
Output Files
seurat_spatial.rds/adata_spatial.h5ad: Standard analysis objects containing dimensionality reduction (PCA/UMAP), clustering, and spatial coordinate information.- Visualization Plots: QC violin plots, spatial clustering distribution plots (SpatialPlot), UMAP plots, spatial mapping plots of feature genes, etc.
Spatial Microenvironment and Clustering Analysis
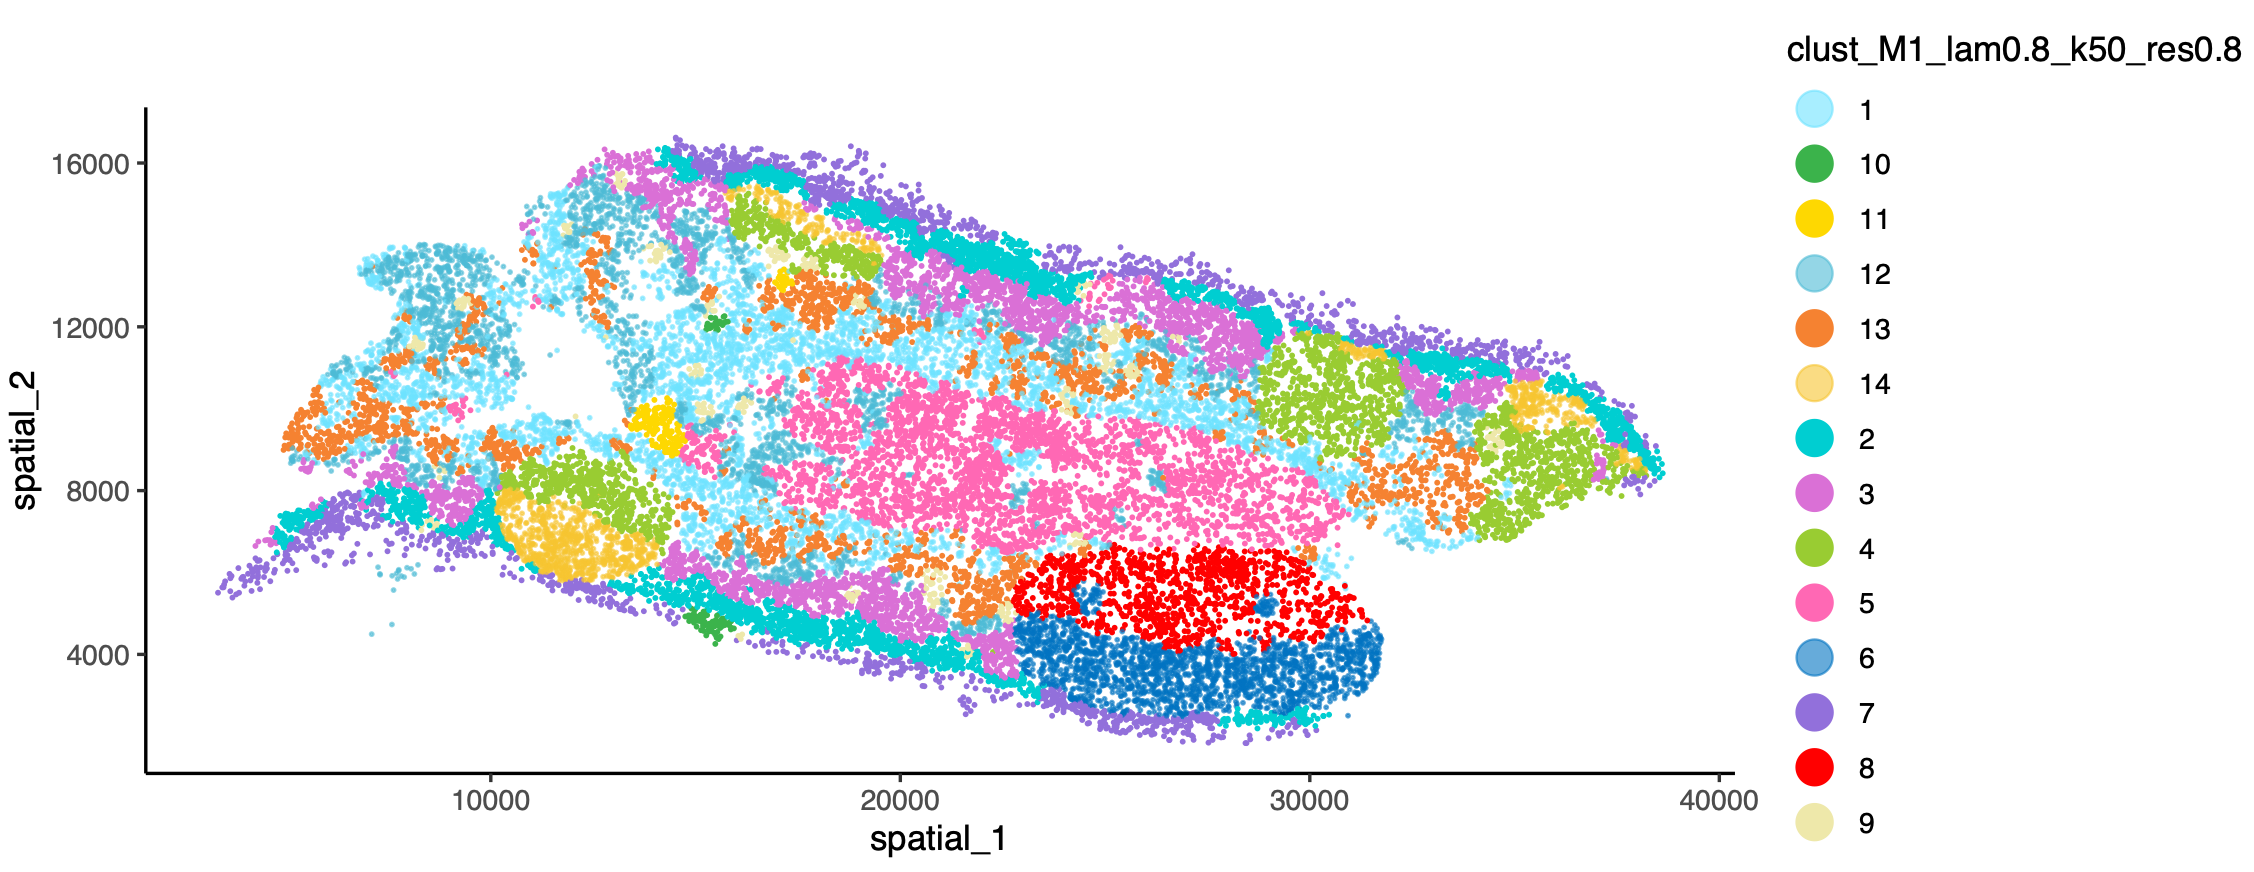
The unique spatial neighborhood information of spatial transcriptomics data allows us to go beyond pure gene expression-based clustering. By combining the physical locations of cells and their neighbor information, we can define spatial microenvironments (Niche) and spatial domains. This is of great significance for resolving tumor infiltration boundaries and complex tissue stratification (e.g., cerebral cortex).
Related Tutorials:
- Banksy-based Spatial Clustering Analysis: Single-Cell Spatial Transcriptomics: Spatial Clustering Analysis Combines gene expression and local spatial neighborhood features for spatial clustering, generating spatial microenvironment (Niche) and structural domain segmentations.
Input Files
- Annotated Spatial Analysis Object: A
.rdsfile that has undergone basic dimensionality reduction clustering or cell type annotation, and must contain valid spatial coordinates (e.g.,reductions$spatial).
Output Files
- Microenvironment Annotation Results: Newly added microenvironment/niche labels.
- Visualization Plots: Spatial domain distribution plots, etc.
Spatial Colocalization and Density Analysis
To explore the spatial distribution patterns of different cell types, ligand-receptor pairs, or specific genes within tissues, cell type colocalization and Kernel Density Estimation (KDE) analyses are required. This helps discover which cell types tend to aggregate spatially (e.g., interaction areas between immune cells and tumor cells) or locate high-expression hotspots of key genes.
Related Tutorials and Software Features:
1. CellCharter-based Spatial Neighborhood Enrichment Analysis
- Tutorial Link: Single-Cell Spatial Transcriptomics: Spatial Neighborhood Enrichment Analysis
- Pros: Excels at processing high-resolution/single-cell resolution spatial data, accurately evaluating the spatial proximity enrichment or avoidance relationships between cell populations by constructing Delaunay or kNN spatial proximity graphs.
- Cons: Mainly focuses on global neighborhood enrichment statistics, and is less rich than MISTy in characterizing multi-scale (e.g., short-range vs. long-range) spatial dependencies.
- Input: An AnnData (
.h5ad) object containing cell type annotations and spatial coordinates. - Output: Neighborhood enrichment/avoidance heatmaps between cell types.
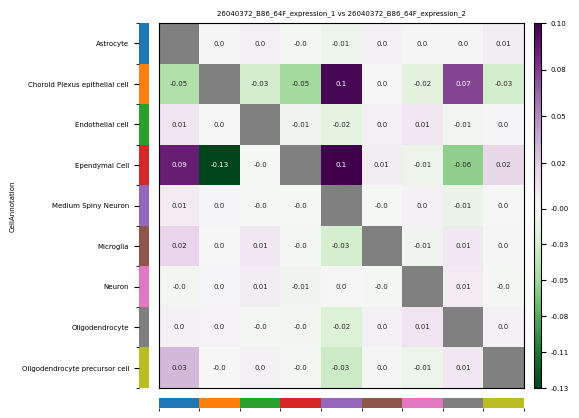
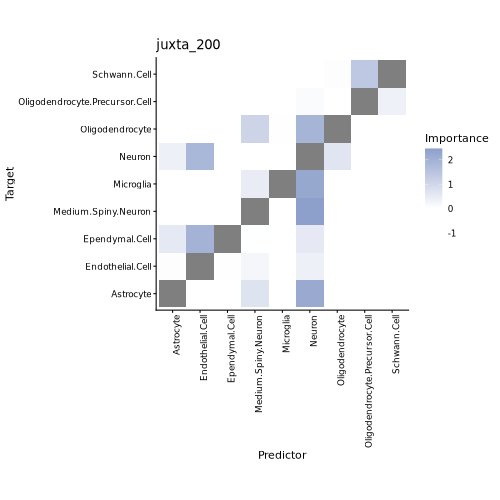
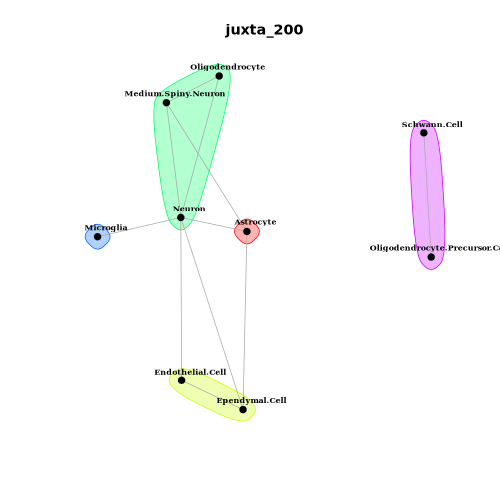
2. MISTy-based Cell Type Colocalization Analysis
- Tutorial Link: Single-Cell Spatial Transcriptomics: Cell Type Colocalization Analysis
- Pros: Supports multi-scale modeling, analyzing not only direct physical contacts between cells (nearest neighbor view) but also long-range colocalization patterns within the signal diffusion range based on distance-decay weights.
- Cons: Predicts cell abundances based on machine learning (e.g., Random Forest), meaning model training time and memory consumption will increase significantly with the number of cells and views.
- Input: A Seurat (
.rds) object containing cell type annotations and physical spatial coordinates. - Output: Spatial dependency scoring matrices of cell types across different spatial scales, MISTy spatial dependency network plots, and variable importance score bar plots.
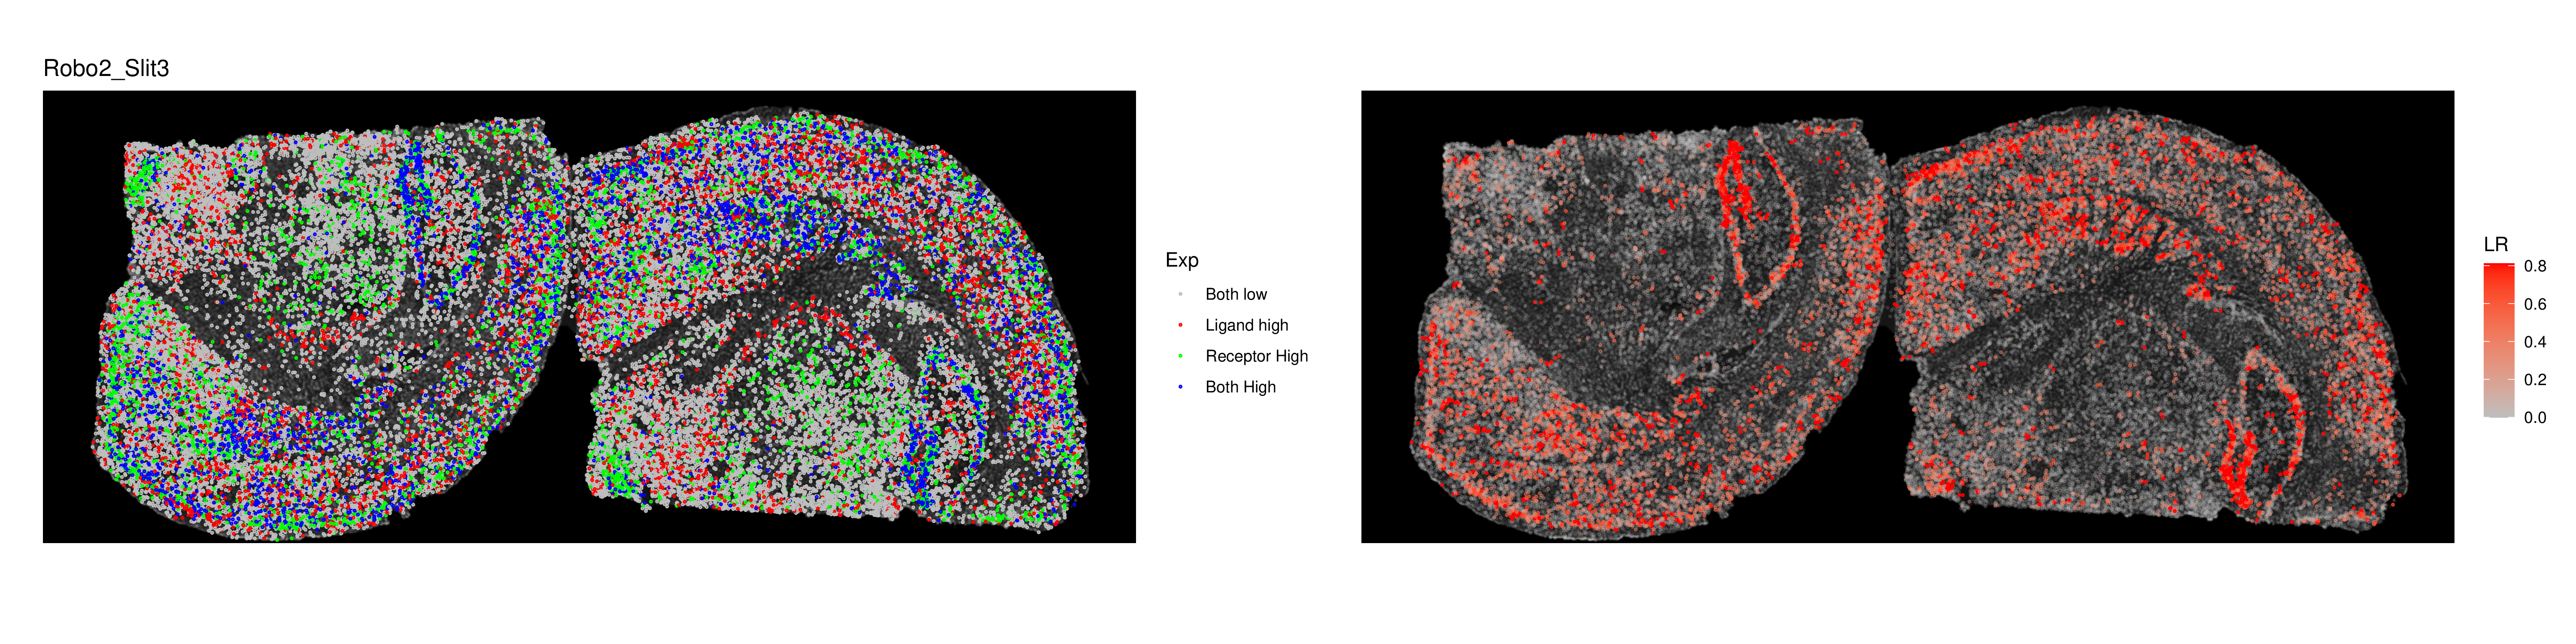
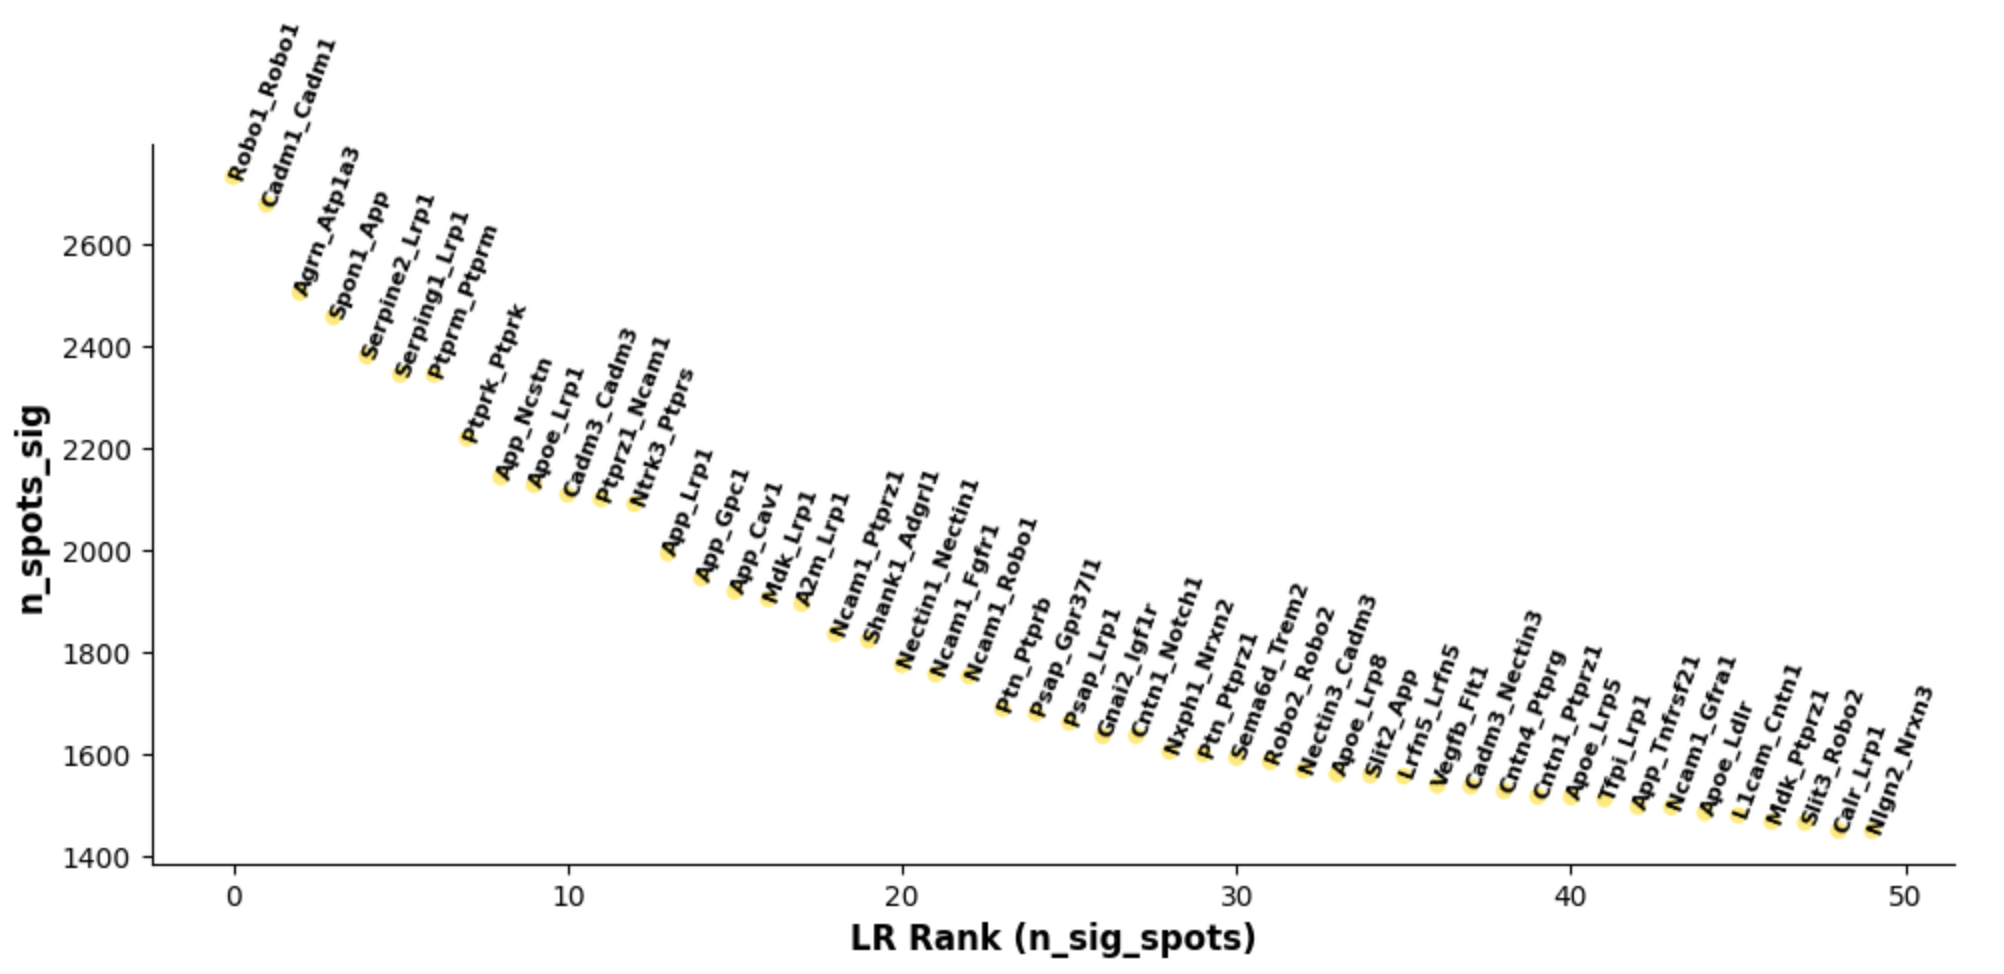
3. SpaGene-based Spatial Ligand-Receptor Colocalization Analysis
- Tutorial Link: Single-Cell Spatial Transcriptomics: Spatial Ligand-Receptor Colocalization Analysis
- Pros: Specifically evaluates the spatial distribution similarity of receptors and ligands, using algorithms like Earth Mover's Distance (EMD) to quantify the degree of spatial colocalization, effectively screening LR pairs with potential interaction prerequisites.
- Cons: Only evaluates the prerequisite of "colocalization" and does not directly calculate intercellular communication probabilities or infer downstream signaling.
- Input: A Seurat (
.rds) object containing spatial coordinates and gene expression matrices, along with a list of ligands and receptors of interest. - Output: Spatial colocalization score rankings of ligand-receptor pairs, and colocalization visualization plots of specific LR pairs on the tissue section.
Cell Communication Analysis
Spatial transcriptomics has an inherent advantage in resolving cell-cell communication (CCI) because it provides real physical distance constraints between cells, avoiding the "false positive" global communication inferences in traditional single-cell sequencing. Combined with spatial coordinates, it can pinpoint the specific tissue regions where communication occurs and identify communication hotspots. We have integrated multiple mainstream cell communication algorithms to meet different research needs.
Related Tutorials and Software Features:
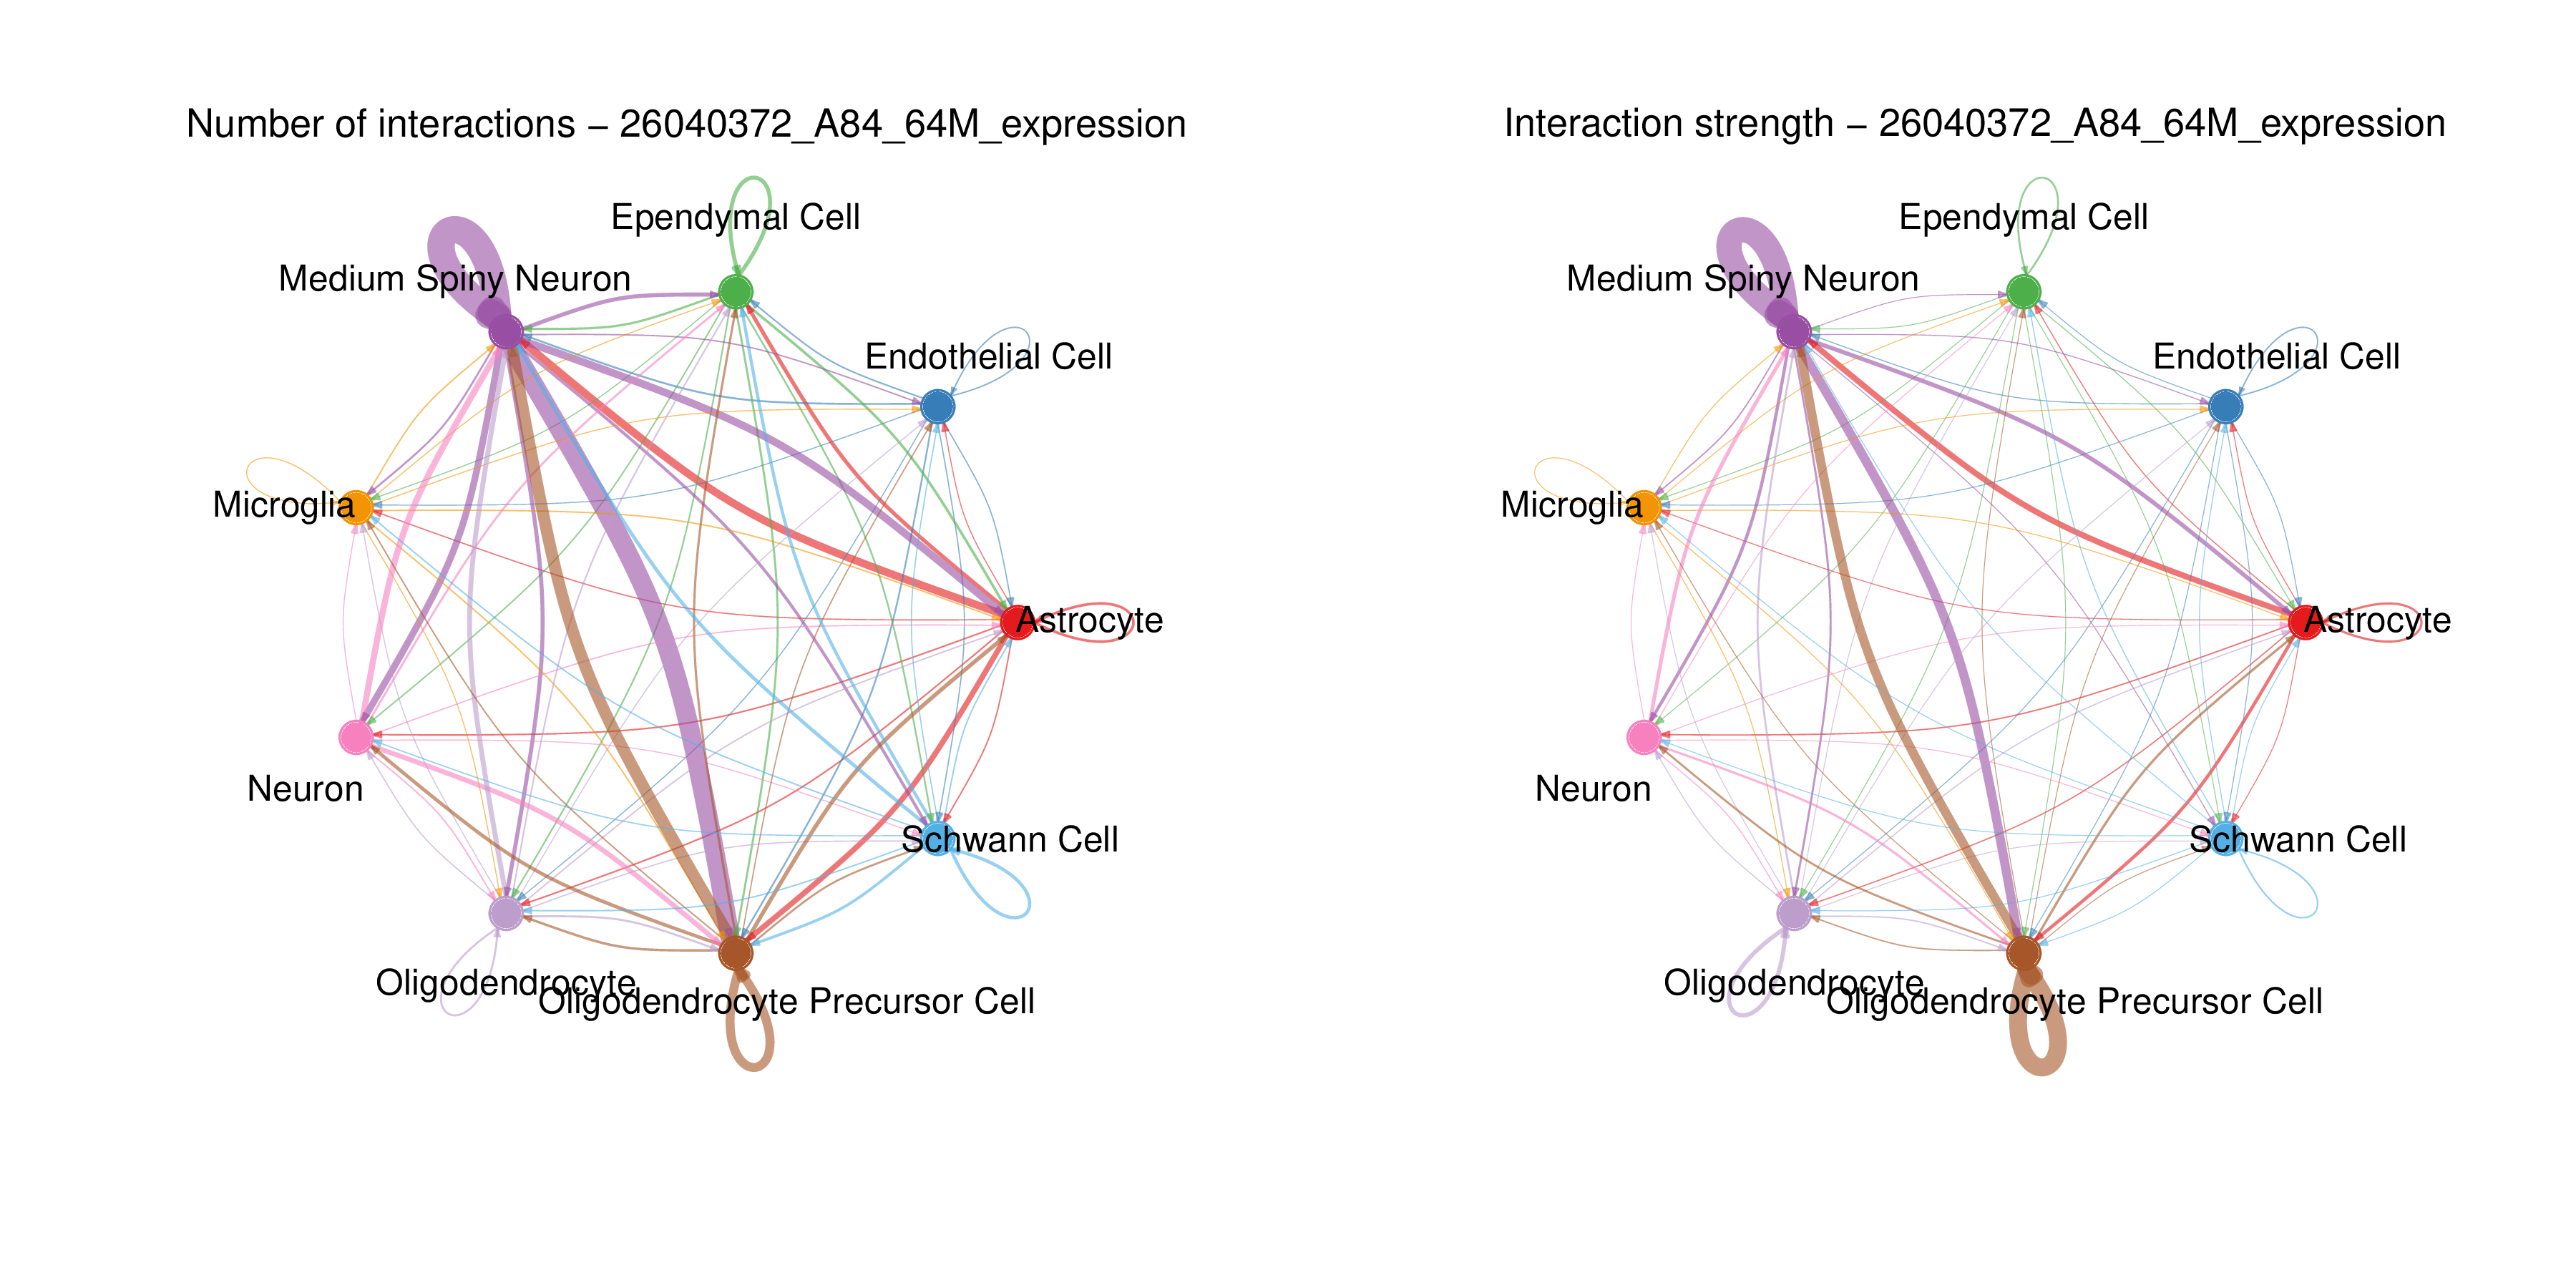
1. CellChat-based Cell Communication Analysis
- Tutorial Link: Single-Cell Spatial Transcriptomics: Cell Communication Analysis (based on CellChat)
- Pros: Comprehensive database (including signaling pathway-level annotations); excels at multi-group/multi-sample network comparisons; highly rich visualization features.
- Cons: Weak hard constraints on spatial physical distances, essentially performing probability inference on clustered cell populations.
- Input: Normalized expression matrix containing cell type annotations, and spatial coordinate matrix.
- Output: Pathway-level communication probability matrices, chord diagrams, dot plots, and signaling pathway hierarchical network plots.
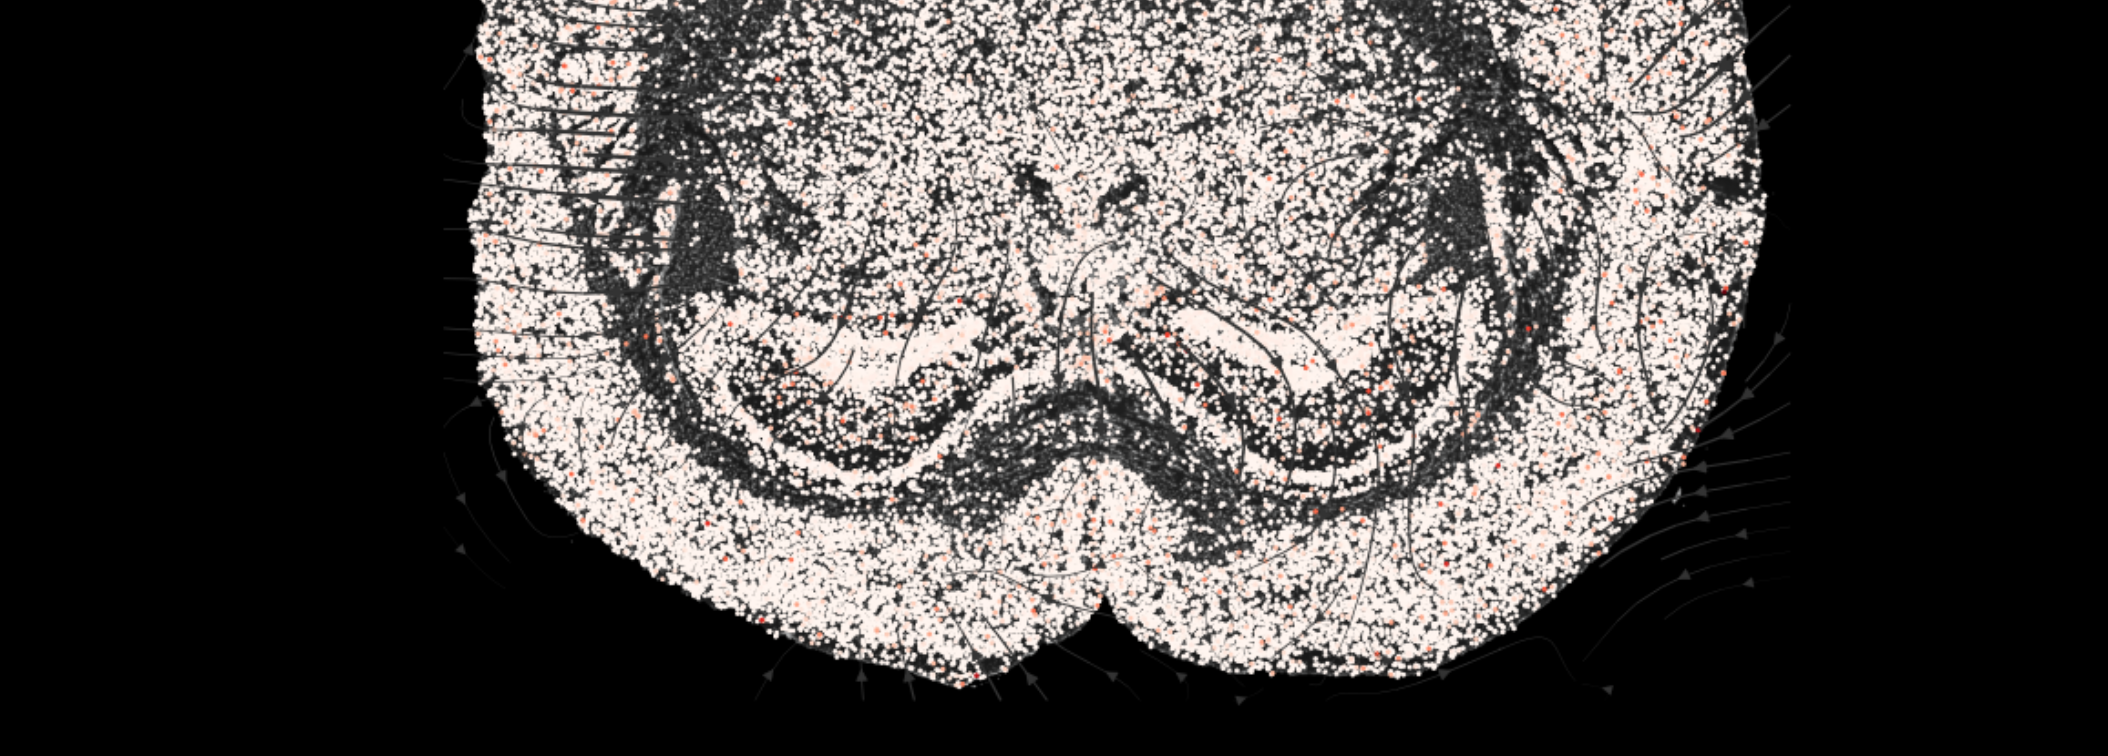
2. COMMOT-based Cell Communication Analysis
- Tutorial Link: Single-Cell Spatial Transcriptomics: Cell Communication Analysis (based on COMMOT)
- Pros: Adopts Optimal Transport theory, using physical distance between cells as a strong constraint, enabling precise characterization of the spatial diffusion range of signaling molecules in tissues.
- Cons: High computational complexity of the algorithm, leading to longer processing times for ultra-large-scale cell/Spot data.
- Input: Annotated
.h5adspatial analysis object (including spatial coordinatesobsm['spatial']). - Output: Cell-pair level spatial communication flow maps, and spatial flow maps of signal sending and receiving potentials.
3. stLearn-based Cell Communication Analysis
- Tutorial Link: Single-Cell Spatial Transcriptomics: Cell Communication Analysis (based on stLearn)
- Pros: Capable of calculating spatial communication scores and identifying significantly interacting LR pairs through P-value filtering, directly locating "spatial hotspots" of high-frequency interactions.
- Cons: Runtime and memory consumption are proportional to data scale; processing high-definition spatial data with an extremely large number of cells (e.g., whole brain sections) may require "Grid" downsampling.
- Input: AnnData object combining cell type annotations and spatial coordinate matrix (if only performing cell communication analysis, H&E image features are not strictly required; the background image is mainly used for the final spatial visualization mapping).
- Output: Spatial hotspot distribution plots of LR interaction scores, significant interaction network plots (cci_net), chord plots, and ligand-receptor interaction heatmaps.
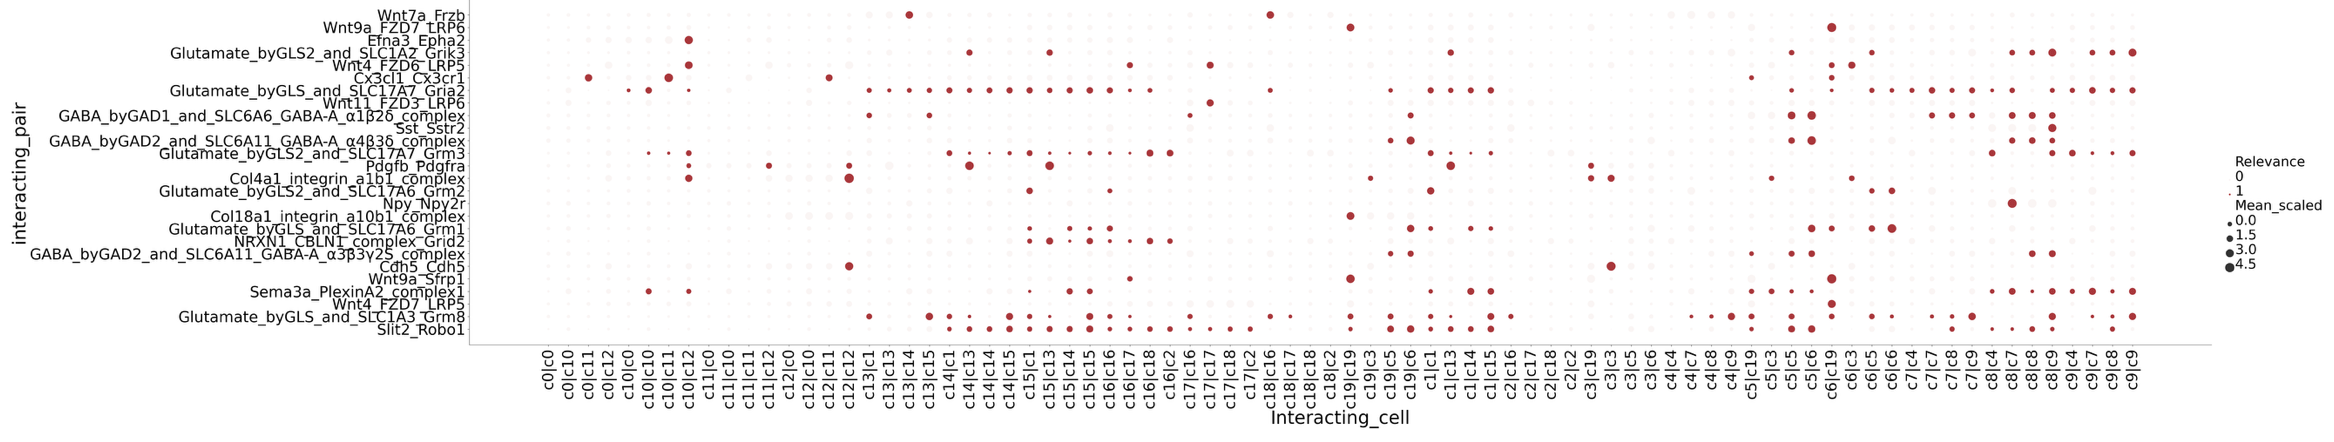
4. CellPhoneDB-based Cell Communication Analysis
- Tutorial Link: Single-Cell Spatial Transcriptomics: Cell Communication Analysis (based on CellPhoneDB)
- Pros: The biggest highlight is its unique database, which fully considers the multi-subunit structure of receptors and ligands, enabling accurate identification of heteromeric complexes. Combined with spatial location information (through pre-defined spatial microenvironments), it can achieve interaction inference under spatial constraints.
- Cons: The default version lacks continuous physical distance constraints, requiring users to pre-define spatial microenvironments (via clustering or segmentation) before running by regions.
- Input: Cell type annotation file (
meta.txt), normalized expression matrix (counts.txt), and differentially expressed genes file (DEGs.txt). - Output: Significant interaction P-value matrices, mean expression matrices (
means.txt), and classic ligand-receptor interaction dot plots.
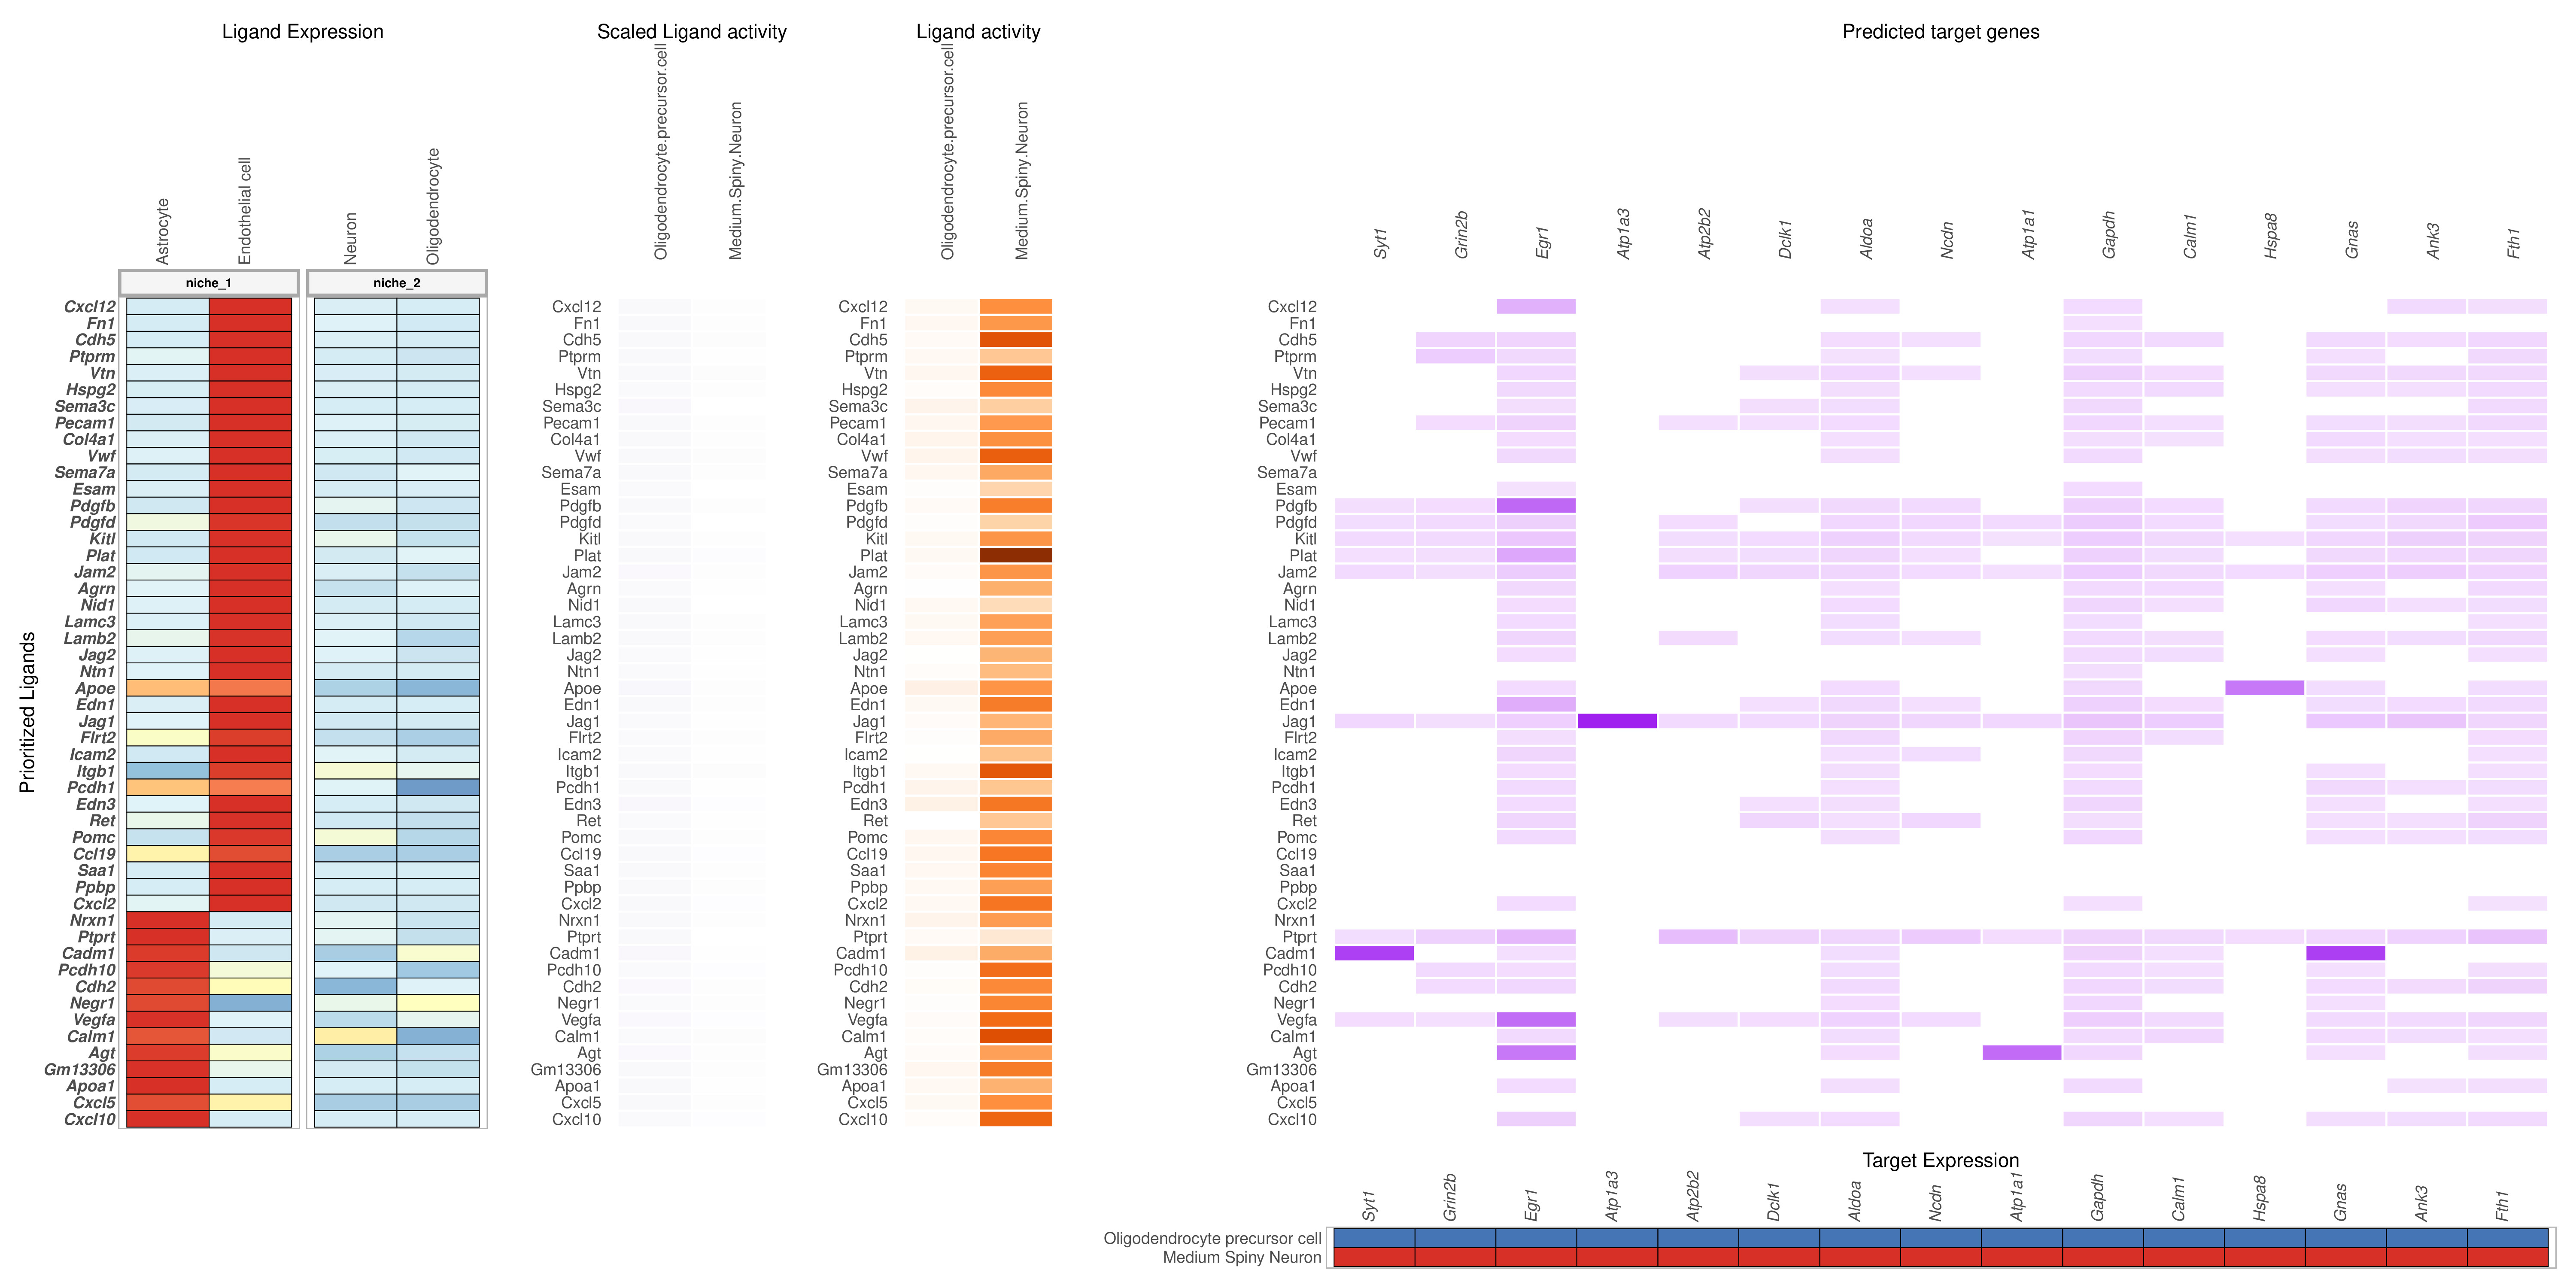
5. NicheNet-based Cell Communication Analysis
- Tutorial Link: Single-Cell Spatial Transcriptomics: Cell Communication Analysis (based on NicheNet)
- Pros: Not only infers ligand-receptor interactions but also predicts the downstream target gene transcriptional changes triggered in receiver cells after ligand-receptor binding, pointing directly to biological effects.
- Cons: The model highly depends on its built-in prior network of gene regulation, and requires users to explicitly specify the "sender" and "receiver" cell populations.
- Input: Expression matrices of sender and receiver cells, and a set of downstream genes of interest (usually DEGs).
- Output: Ligand activity ranking, and ligand-receptor-target gene regulatory network heatmaps and Circos plots.
Data Analysis Recommendations
Note: Single-cell spatial transcriptomics analysis is highly dependent on tissue specificity and driven by specific biological questions. The multi-dimensional analysis modules provided in this guideline aim to build a complete spatial feature map. You can flexibly combine or tailor the analysis pipeline based on the quality of sample sections, the complexity of cell types, and core research objectives.
Core Analysis Path Recommendations:
- Basic Parsing and Map Construction: Sequentially perform "Basic Data Analysis" (if encountering multi-sample/multi-section data, perform "Multi-Sample Integration and Batch Correction" first) to complete unsupervised cell clustering, differential gene screening, and preliminary cell type annotation.
- Spatial Heterogeneity and Domain Segmentation: After obtaining cell annotations, it is recommended to use tools like Banksy to conduct "Spatial Microenvironment and Clustering" analysis, upgrading pure expression-driven classification to tissue structural domain (Spatial Domain) segmentation combined with spatial neighborhoods, to characterize the in situ tissue microenvironment.
- Spatial Interaction and Mechanism Mining: Based on clear structural domains and cell distributions, select "Spatial Colocalization and Density Analysis" (e.g., CellCharter, SpaGene) to find cell populations or ligand-receptor pairs with strong spatial dependencies; finally, combining these clues, choose appropriate tools to deeply mine "Cell Communication Networks", moving from phenotypic distribution to molecular-level mechanistic explanations.
Progression and Connection of Analysis Modules:
Basic Cell Clustering→ Drives →Banksy Microenvironment (Niche) Identification and Tissue Partitioning.Cell Type Spatial Distribution→ Guides →CellCharter Cell Type Colocalization Analysis.SpaGene Ligand-Receptor Colocalization Screening→ Validates →COMMOT / CellChat Spatial Communication Hotspot Localization and Flow Inference.