FAST Mutation Analysis
Introduction:
NOTE
Based on single-cell expression data, we can explore the gene expression patterns of each cell, while combining mutation data allows us to explore potential factors behind expression differences. Mutations not only help understand how diseases evolve and spread at the cellular level but also reflect cellular diversity in development and function, providing new perspectives for studying internal diversity and adaptability of organisms.
IMPORTANT
SeekGene's FAST product breaks through the limitations of conventional 3' or 5' end transcriptome sequencing by using random primers to capture the entire transcriptome, resulting in richer transcriptome information. Therefore, FAST data can be used for mutation analysis in single-cell transcriptome data. Similarly, panel enrichment data derived from FAST libraries can also be used for mutation analysis.
In this document, we will detail the corresponding mutation analysis pipeline. This pipeline is proposed with reference to Souporcell (https://www.nature.com/articles/s41592-020-0820-1). Souporcell is a tool proposed by Heaton H. et al. for cell clustering based on genotypes. Please note that there are numerous mutation analysis tools and pipelines available, and you can choose according to your data characteristics and tool features.
TIP
Mutation: refers to changes in DNA, which can be classified as non-synonymous and synonymous mutations based on whether they cause amino acid changes, and as SNPs and indels based on mutation type, corresponding to base substitutions, insertions, and deletions respectively.
Part 1: Analysis Pipeline
NOTE
Based on FAST data or panel data, we propose the following pipeline:
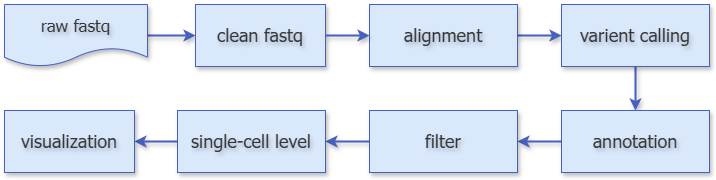
IMPORTANT
This pipeline first uses the seeksoultools software to identify tag information in sequencing reads, obtaining clean fastq data after primer removal, followed by subsequent analysis. Here, we use STAR for alignment, freebayes for mutation detection, and VEP for mutation annotation. After obtaining all mutations, considering false positives caused by sequencing errors, we filter the mutation results and finally use vartrix to generate mutation and coverage matrices, obtaining mutation information at the single-cell level. Additionally, we have added differential analysis and visualization for subsequent analysis.
Part 2: Running Environment and Data
1) Data Acquisition:
2.1.1 Raw Data
NOTE
Taking SeekGene's human cell line data as an example, this data is a 1:1:1 mixture of cell lines A549(KRAS G12S), HCC827(EGFR 19del), and K562(BCR-ABL1 fusion) FAST data, which can be used as an example to verify the mutation analysis pipeline.
(The following code is executed in terminal command line)
# fastq
wget https://seekgene-public.oss-cn-beijing.aliyuncs.com/software/data/demodata/panel.raw.tar.gz
# Decompress
tar -zxvf panel.raw.tar.gz
2.1.2 Get Analysis Scripts and RDS Data
wget https://seekgene-public.oss-cn-beijing.aliyuncs.com/software/FAST/20250610_mut_script.zip
unzip 20250610_mut_script.zip
NOTE
This folder contains the scripts and RDS needed for subsequent mutation analysis. The RDS data here is obtained after quality control analysis of the cell line data with seeksoultools.
2.1.3 Genome Data
IMPORTANT
Human and mouse reference genomes can be obtained below. For other species, please refer to http://seeksoul.seekgene.com/zh/v1.2.2/reference.html#ref-label to build. Here we only need to download the human genome data.
# human
wget -c -O GRCh38.tar.gz "https://seekgene-public.oss-cn-beijing.aliyuncs.com/software/data/reference/GRCh38.tar.gz"
# decompress
tar -zxvf GRCh38.tar.gz# mouse
wget -c -O mm10.tar.gz "https://seekgene-public.oss-cn-beijing.aliyuncs.com/software/data/reference/mm10_ensemble_102.tar.gz"
tar -zxvf mm10.tar.gz2.1.4 VEP Annotation Database
NOTE
VEP (Variant Effect Predictor) is an analysis software for mutation annotation, which can be downloaded from ENSEMBL (http://useast.ensembl.org/info/docs/tools/vep/script/vep_cache.html#cache). Here we download the database for human species, version 111:
wget https://ftp.ensembl.org/pub/release-111/variation/indexed_vep_cache/homo_sapiens_merged_vep_111_GRCh38.tar.gz
tar -zxf homo_sapiens_merged_vep_111_GRCh38.tar.gz
2) Environment Configuration:
2.2.1 Installation of seeksoultools
CAUTION
# seeksoultools
wget -c -O seeksoultools_fast_mut_dev.tar.gz "https://seekgene-public.oss-cn-beijing.aliyuncs.com/software/FAST/Fusion.v1/seeksoultools_fast_mut_dev.tar.gz"
# Decompress
mkdir seeksoultools
tar -zxvf seeksoultools_fast_mut_dev.tar.gz -C seeksoultools
source seeksoultools/bin/activate
seeksoultools/bin/conda-unpack
# export to PATH
export PATH="`pwd`/seeksoultools/bin:$PATH"
2.2.2 Installation of Other Software:
TIP
It is recommended to use conda/micromamba for installation, integrated in one environment. You can install directly from the yaml file or install separately:
YAML File Installation:
micromamba env create -f mut_script/env.yaml
micromamba activate test_mut_pip
Separate Installation:
Create environment and install required software:
micromamba create -n test_mut_pip
micromamba activate test_mut_pip

micromamba install bioconda::freebayes  bioconda::bcftools bioconda::ensembl-vep  bioconda::vartrix
Install R/python required packages:
# R
micromamba install r-base
Rscript -e 'install.packages(c("Seurat", "tidyverse", "argparse", "patchwork", "Matrix", "future.apply", "stringr"), repos="https://mirrors.tuna.tsinghua.edu.cn/CRAN/")'

# python
pip install click json loguru collections pandas pysam Bio
NOTE
Versions:
# seeksoultools	1.2.0
# freebayes	1.3.6
# bcftools	1.21
# vep	111.0
# vartrix	1.1.22
# #####################
# python	3.7.12
# click	8.1.7
# json	2.0.9
# loguru	0.7.2
# pandas	2.2.2
# pysam	0.22.1
# biopython	1.81
# #####################
# R	4.4.1
# Seurat	5.1.0
# tidyverse	2.0.0
# argparse	2.2.3
# patchwork	1.3.0
# Matrix	1.6-5
# future.apply	1.11.2
# stringr	1.5.1
Part 3: Running Examples and Results Explanation
Input:
star_index="/path/GRCh38/star"
fq1="/path/panel_R1_001.fastq.gz"
fq2="/path/panel_R2_001.fastq.gz"
sam="demo"
vepcache="/path/indexed_vep_cache/homo_sapiens_merged/111_GRCh38/"
rdsfile="/path/mut_script/demo.rds"
out="/path/output"

mkdir -p $out
cd $out
NOTE
Note: You can complete the sequencing data quality control process according to your needs.
Step 1: Extract Tag Information
IMPORTANT
Use seeksoultools analysis software to identify barcode and UMI sequences, and remove primers and adapter sequences to obtain clean fastq data:
seeksoultools mut step1 \
    --fq1 $fq1  \
    --fq2 $fq2  \
    --samplename $sam  \
    --outdir  $out
NOTE
The output results sam.cutTSO_1.fq.gz and sam.cutTSO_2.fq.gz are used for subsequent analysis.
Step 2: Alignment
IMPORTANT
Next, use STAR for alignment and process the bam file:
STAR \
    --runThreadN 13 \
    --limitOutSJcollapsed 5000000 \
    --readMapNumber -1 \
    --genomeDir $star_index \
    --readFilesCommand zcat \
    --outFileNamePrefix $out/${sam}.star. \
    --outSAMtype BAM Unsorted \
    --readFilesIn ${out}/step1/${sam}.cutTSO_1.fq.gz ${out}/step1/${sam}.cutTSO_2.fq.gz

samtools sort -@ 12 -O BAM -o $out/${sam}.star.sort.out.bam $out/${sam}.star.Aligned.out.bam
samtools index $out/${sam}.star.sort.out.bam
seeksoultools utils addtag --inbam $out/${sam}.star.sort.out.bam --outbam $out/${sam}.star.tagged_sorted.bam
samtools index $out/${sam}.star.tagged_sorted.bam
NOTE
Output Results Description:
| file | description |
|---|---|
| starAligned.out.bam | STAR output bam |
| sort.star.bam | STAR output bam sorted by chromosome position |
| *.tagged_sorted.bam | tagged indicates adding tags to bam, where "CB" and "UB" in tags represent barcode and UMI sequences respectively |
| *.bam.bai | index file |
Step 3: Mutation Detection, Annotation, Filtering
IMPORTANT
Use the mut.py script to complete mutation detection, annotation, and preliminary filtering:
python mut_script/mut.py \
    --bam1 $out/${sam}.star.tagged_sorted.bam \
    --rds $rdsfile \
    --outdir $out \
    --cachedata $vepcache \
    --samplename $sam \
    --species human \
    --refpre $star_index/../fasta/genome
Step 4: Single-cell Level Statistics
NOTE
In the previous step, we generated mutation matrices through vartrix. Here we filtered mutation information belonging to cells and generate corresponding mutation information tables:
Rscript mut_script/tomatrix.R \
    --refmatrix $out/matrix/ref_matrix.mtx \
    --altmatrix $out/matrix/alt_matrix.mtx \
    --annofile $out/${sam}.filter.vcf.txt \
    --barcode $out/${sam}barcodelist.xls \
    --variants $out/${sam}.filter.vcf.txt \
    --outdir $out \
    --sam $sam
IMPORTANT
Output Results Description:
| file | description |
|---|---|
| sample.snp_indel.alt_UMI.matrix | mutation*cells matrix, matrix values represent UMI counts of mutations in cells |
| sample.snp_indel.all_UMI.matrix | mutation*cells matrix, matrix values represent UMI counts of cells covering mutation sites |
sam.anno.cluster.xls
NOTE
Stores detailed annotation information of mutations. For different column descriptions, please refer to http://asia.ensembl.org/info/docs/tools/vep/vep_formats.html#output
sam.simple.anno.cluster.txt
TIP
Stores basic information of mutations, column descriptions:
| column | description |
|---|---|
| sample | sample name |
| Chr | chromosome information |
| pos | mutation position |
| Ref | reference genome base |
| Allele | mutated base |
| Consequence | mutation type |
| SYMBOL | gene name where mutation occurs |
| HGVSc | amino acid changes caused by mutation |
| HGVSp | protein changes caused by mutation |
| Existing_variation | information of this site in CLIN_SIG, SOMATIC, PHENO databases |
| alt_clusters | cluster information where mutation occurs |
| coverage_clusters | cluster information covering this site |
Step 5: Differential Analysis and Visualization
IMPORTANT
To better understand the characteristics of mutations in cell populations, Fisher's exact test can be used to calculate whether mutations are significantly enriched in cell populations, and UMAP plots can be used to show mutation performance in different dimensions:
Rscript mut_script/snv_module.R \
    --rna_mat $rdsfile \
    --name $sam \
    --outdir  $out/mutation_umap \
    --snv_cover_mat  $out/${sam}.snp_indel.all_UMI.matrix \
    --snv_mut_mat $out/${sam}.snp_indel.alt_UMI.matrix
NOTE
In the result files, demo_snv_markers.xls is the Fisher test result, column descriptions are as follows:
| column | description |
|---|---|
| SNV | mutation |
| p_val | Fisher test p-value |
| ident*_ref | number of cells covering but not having the mutation |
| ident*_mut | number of cells with the mutation |
| ident*_cover | ref+mut |
| cluster | target cell population |
| p_val_adj | adjusted p-value |
(ident1 represents target cell population, ident2 represents non-target cell population)
Taking KRAS G12S mutation as an example:
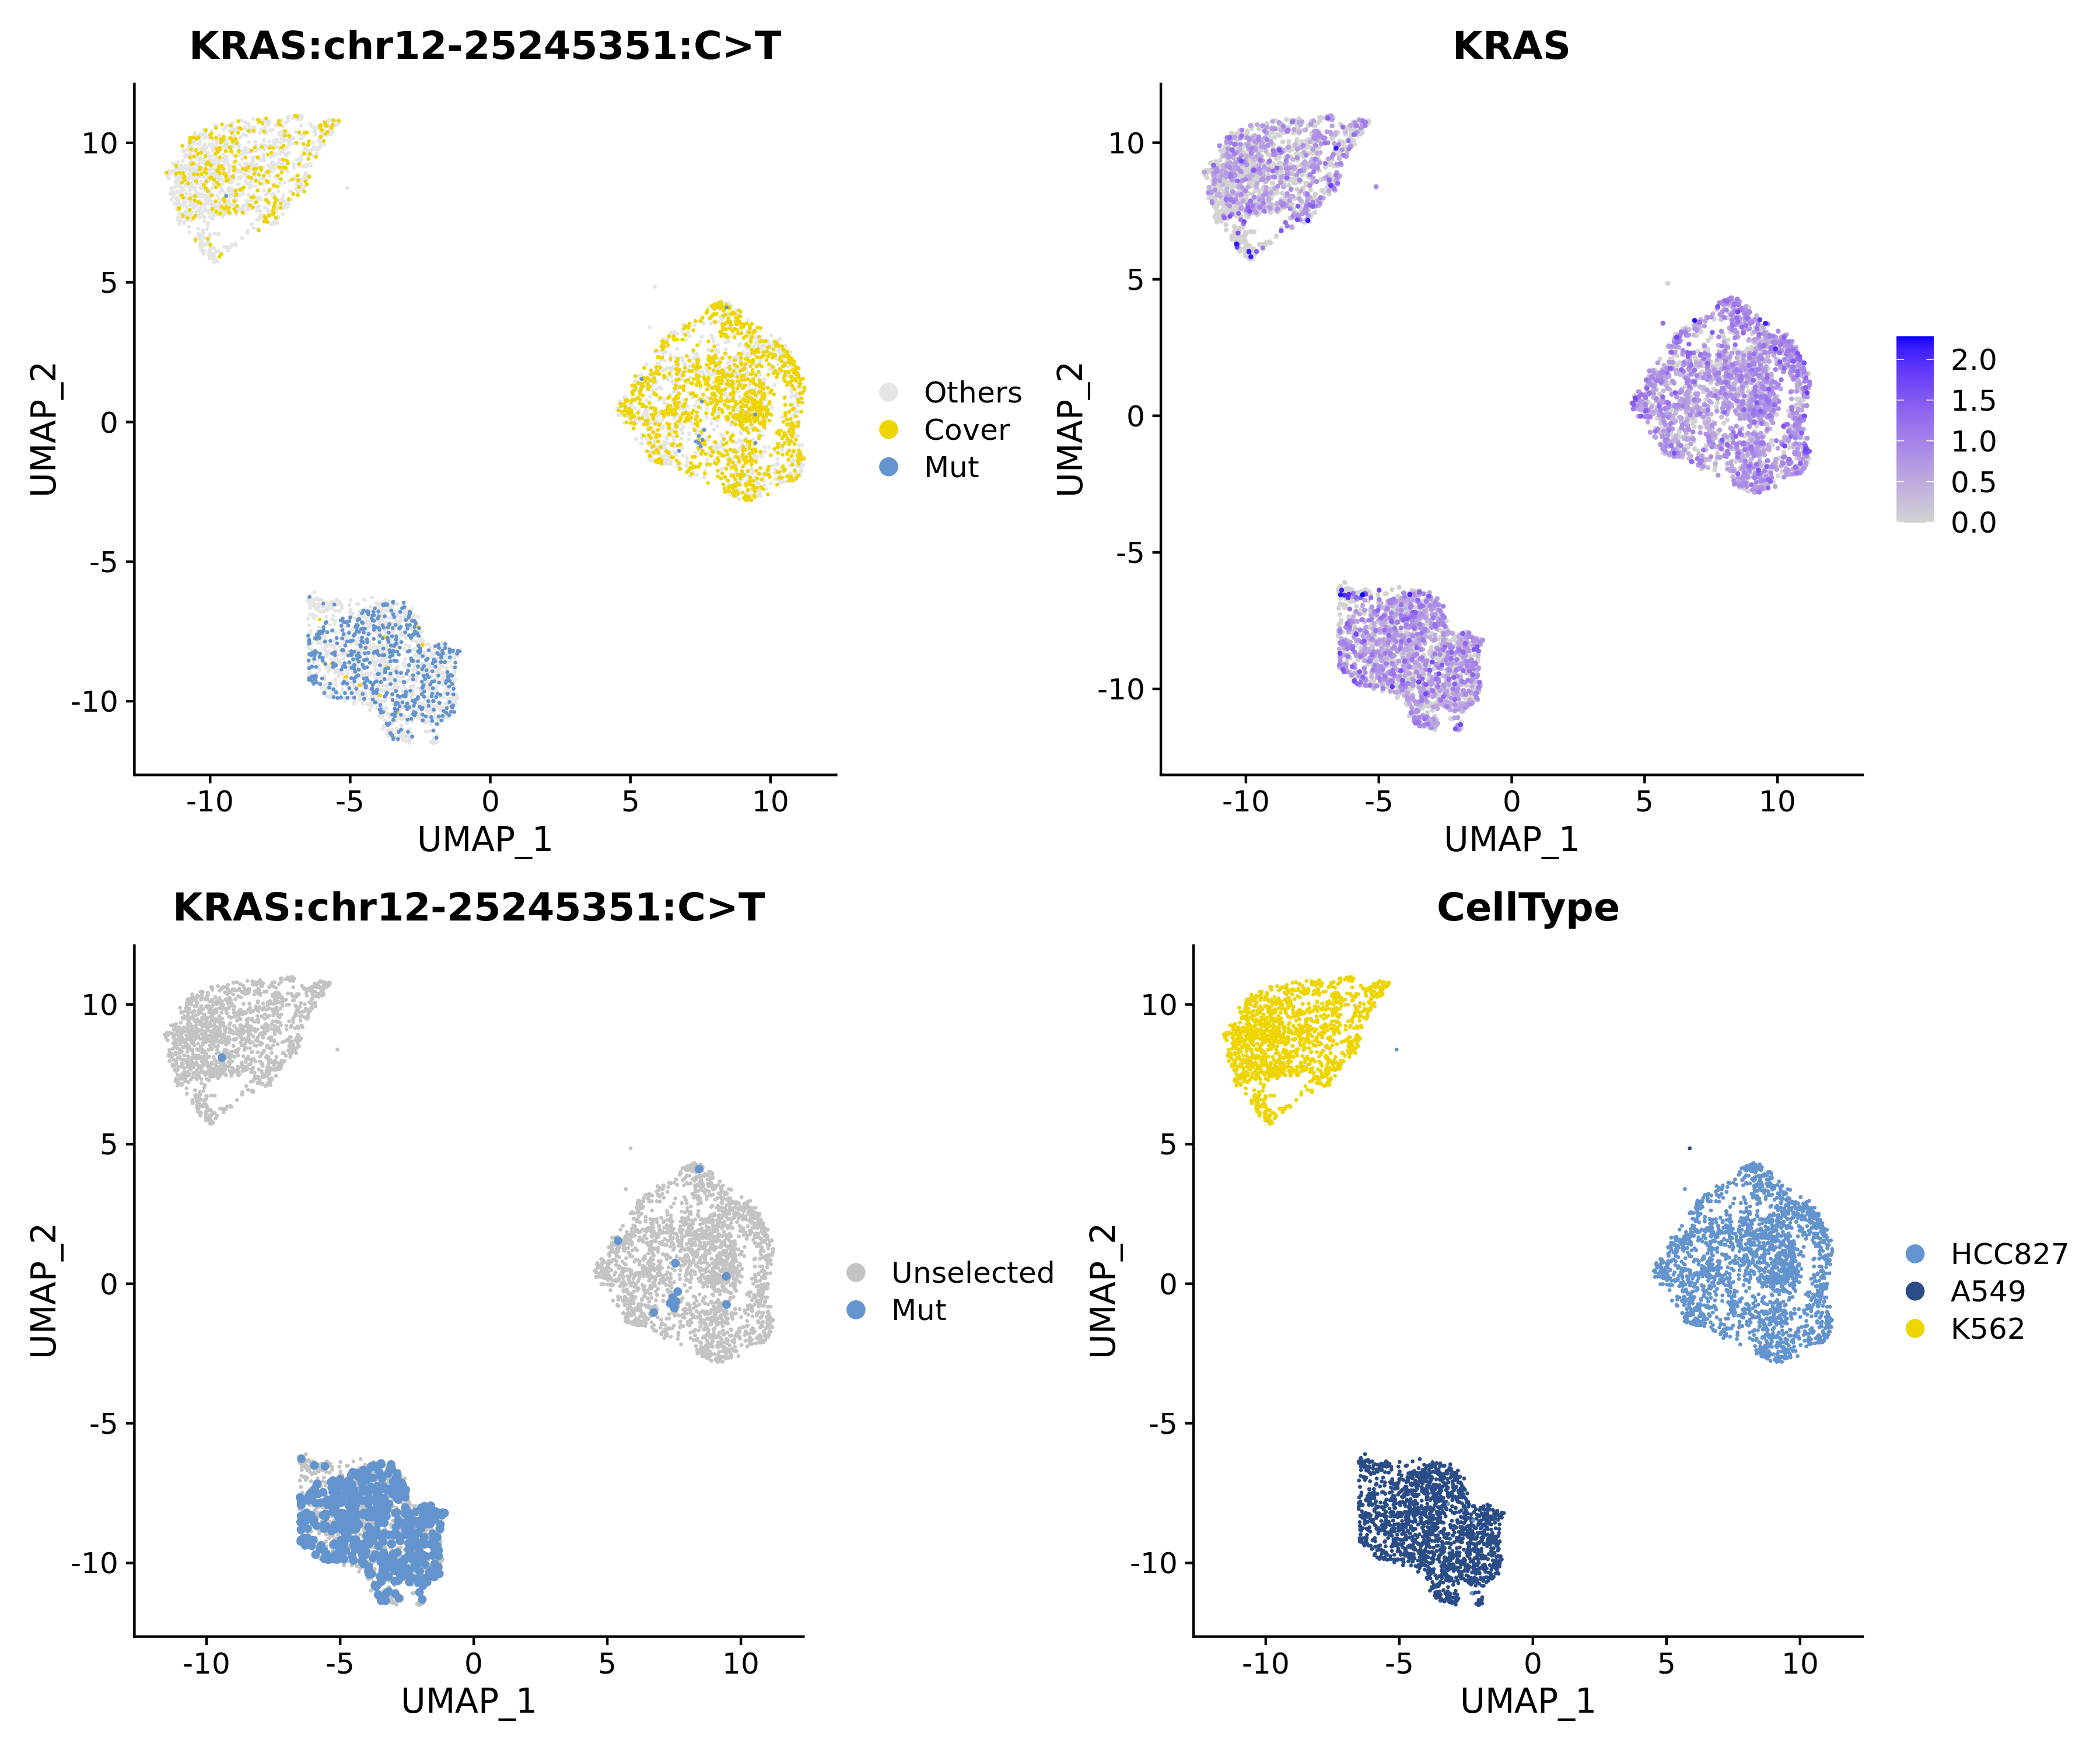
TIP
Each point in the figure represents a cell
Top left: Yellow cover indicates cells covering but not having the mutation, blue represents cells with the mutation;
Bottom left: Blue represents cells with the mutation;
Top right: Expression level of the gene where the mutation occurs, with blue intensity indicating expression level at the RNA level. With this figure, we can understand the correlation between mutation detection and gene expression;
Bottom right: Cell lines.
It can be seen that the KRAS G12S mutation is significantly enriched in cell line A549(KRAS G12S). Therefore, the accuracy of mutation detection can be verified.
Conclusion
NOTE
In this document, we explored mutation analysis at the single-cell level and presented an analysis pipeline as an example for your reference. This pipeline, through the integration and optimization of various bioinformatics tools and databases, can effectively detect mutations and complete joint analysis on single-cell data. It can effectively help you obtain mutation-level features of single-cell transcriptomes and identify potential functional variants and their possible effects.