
ATAC-RNA Single-Cell Multi-Omics Analysis Guideline
SeekArc single-cell multi-omics data (RNA + ATAC) technology simultaneously captures two dimensions of molecular information — chromatin accessibility (scATAC-seq) and gene expression (scRNA-seq) — within the same cell, enabling the resolution of causal links between "epigenetic regulation and transcriptional output" at single-cell resolution.
Based on ATAC + RNA dual-omics data, one can not only perform cell type annotation and differential gene analysis as in traditional single-omics approaches, but also address deeper regulatory mechanism questions: Which transcription factors (TFs) drive specific cell states? Which cis-regulatory elements (CREs) are activated in particular cell types? How are the physical connections between regulatory elements and target genes established? What is the heterogeneity of regulatory networks across different cell types?
To help users unlock the value of ATAC + RNA dual-omics data, SeekGene provides systematic downstream analysis pipelines and tutorials, covering everything from basic quality control and dimensionality reduction clustering, to differential accessibility analysis, Motif enrichment, Peak-Gene linkage, TF regulatory triplet inference, TF footprinting analysis, and complete regulatory network construction based on SCENIC+. Each tutorial clearly specifies input file formats, parameter configurations, and interpretable output results, helping users efficiently transform data into biological mechanistic insights.
1. Data Preprocessing
SeekArc® Tools is used to perform barcode extraction and correction, sequence alignment, and quantification separately for the RNA library and ATAC library of SeekArc single-cell multi-omics data. After jointly determining cell boundaries, it outputs an RNA expression matrix, Peak matrix, and Fragment file, providing standardized input data for downstream multi-omics analysis. This step ensures that RNA and ATAC data originate from the same cell and generates standardized format files suitable for subsequent quality control.
2. Basic Analysis
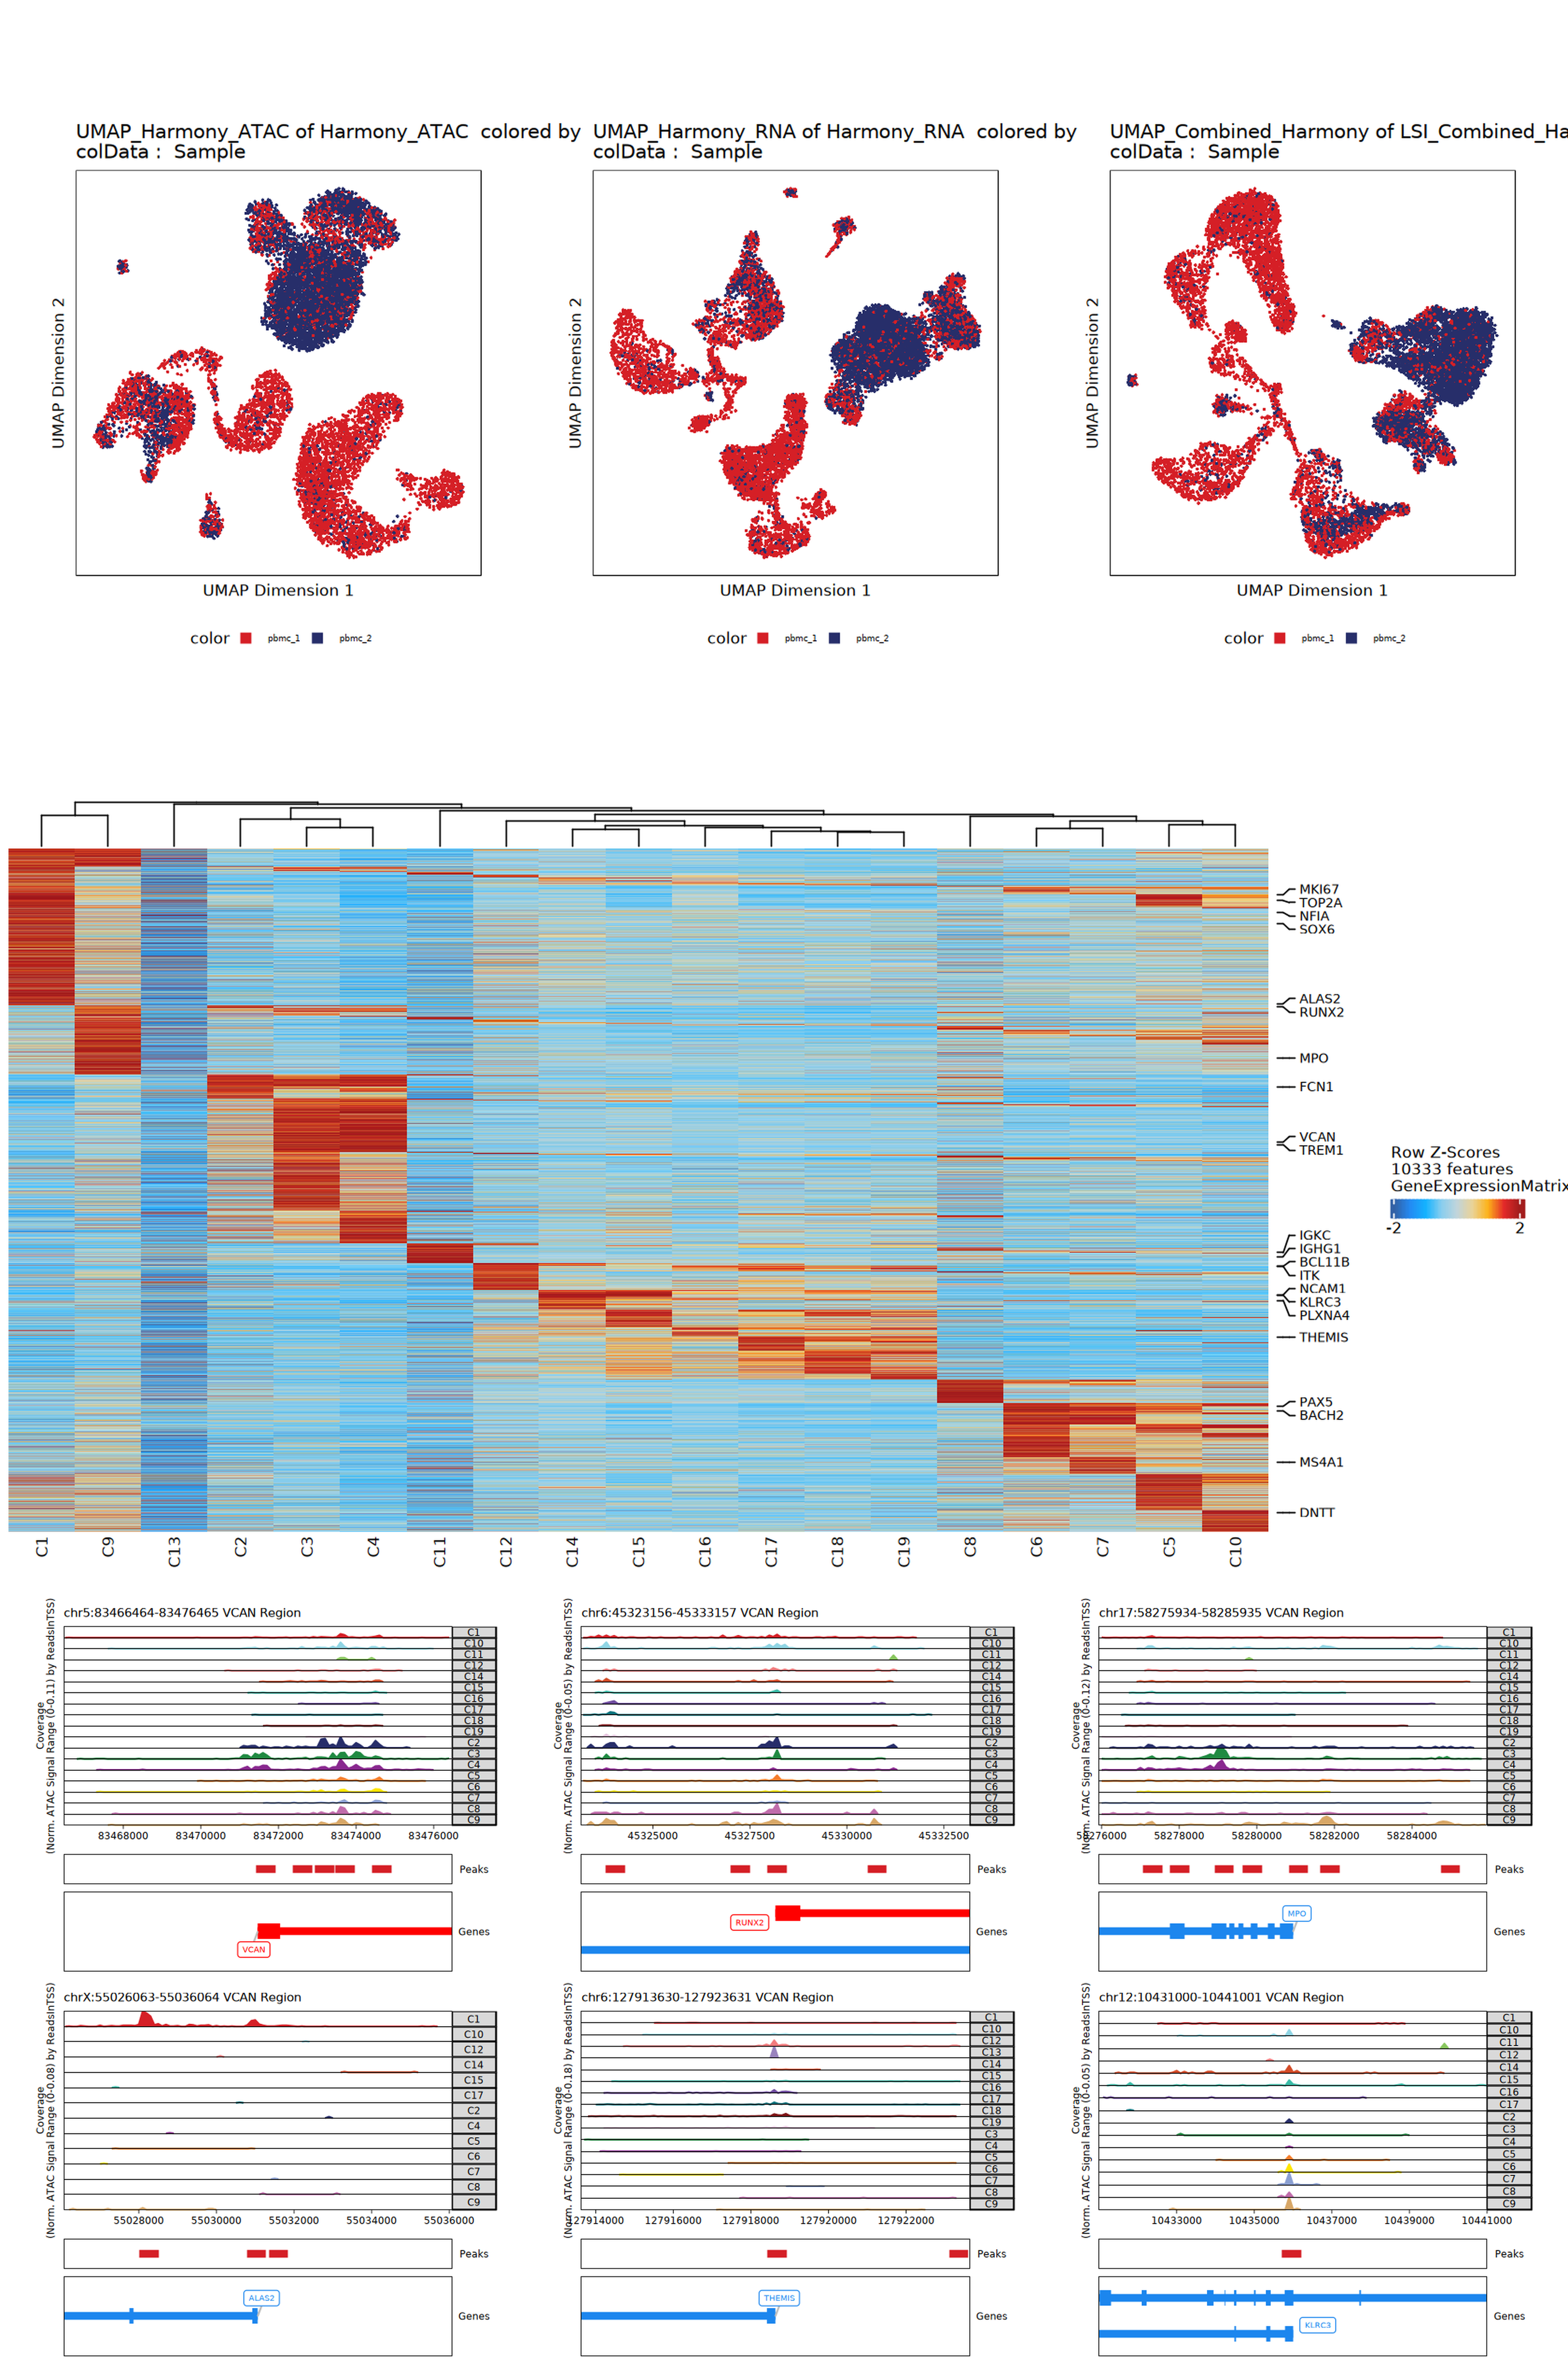
After completing data preprocessing, systematic quality control, dimensionality reduction clustering, and cell type annotation are required. To accommodate different analysis needs and programming preferences, we provide two parallel basic analysis pipelines — based on the ArchR framework (R) and the Signac framework (R) — allowing users to flexibly choose based on project scale, analytical habits, and downstream requirements.
The ArchR pipeline employs the LSI (Latent Semantic Indexing) iterative dimensionality reduction algorithm, achieving efficient memory management through the construction of Tile Matrix and Gene Score Matrix, and is particularly suitable for handling large-scale datasets (>100K cells). Its advantages include comprehensive built-in functionality and high computational efficiency, enabling rapid completion of the entire workflow from quality control to clustering. The Signac pipeline is deeply integrated with the Seurat ecosystem, supporting the WNN (Weighted Nearest Neighbor) multi-modal joint clustering strategy, which dynamically evaluates the relative contributions of RNA and ATAC modalities to cell similarity, thereby yielding more robust cell partitioning results. For multi-sample integration scenarios, the Signac pipeline provides two batch correction options — CCA (Canonical Correlation Analysis) and Harmony — allowing users to select the appropriate strategy based on the strength of batch effects.
Regardless of which pipeline is chosen, the core analysis content encompasses: quality control filtering (based on TSS enrichment, fragment count, mitochondrial ratio, etc.), dimensionality reduction clustering (LSI/PCA/WNN), batch correction (Harmony/CCA), grouped Peak Calling (identifying cell type-specific accessible regions), and cell type annotation (based on marker gene expression and chromatin accessibility patterns). The output of basic analysis — annotated ArchRProject or Seurat objects — serves as the data foundation for all subsequent advanced analyses, and its quality directly impacts the reliability of downstream differential analysis, Motif analysis, and regulatory network construction.
2.1 Related Tutorials
- ATAC + RNA Multi-Omics: Basic Analysis (ArchR-based)
- ATAC + RNA Multi-Omics: Single-Sample Basic Analysis (Signac-based)
- ATAC + RNA Multi-Omics: Multi-Sample Integration Analysis (Signac-based)
Analysis Content: Covers quality control filtering, dimensionality reduction clustering (LSI/WNN), batch correction (Harmony/CCA), grouped Peak Calling, and cell type annotation.
2.2 Input Files
fragments.tsv.gz and index, filtered_feature_bc_matrix/ (RNA expression matrix), filtered_peaks_bc_matrix/ (ATAC Peak matrix), genes.gtf (genome annotation)
2.3 Output Files
Annotated ArchRProject or Seurat object (.rds), quality control plots, UMAP clustering plots, Marker heatmaps, genome browser track plots
3. Differential Accessibility Analysis
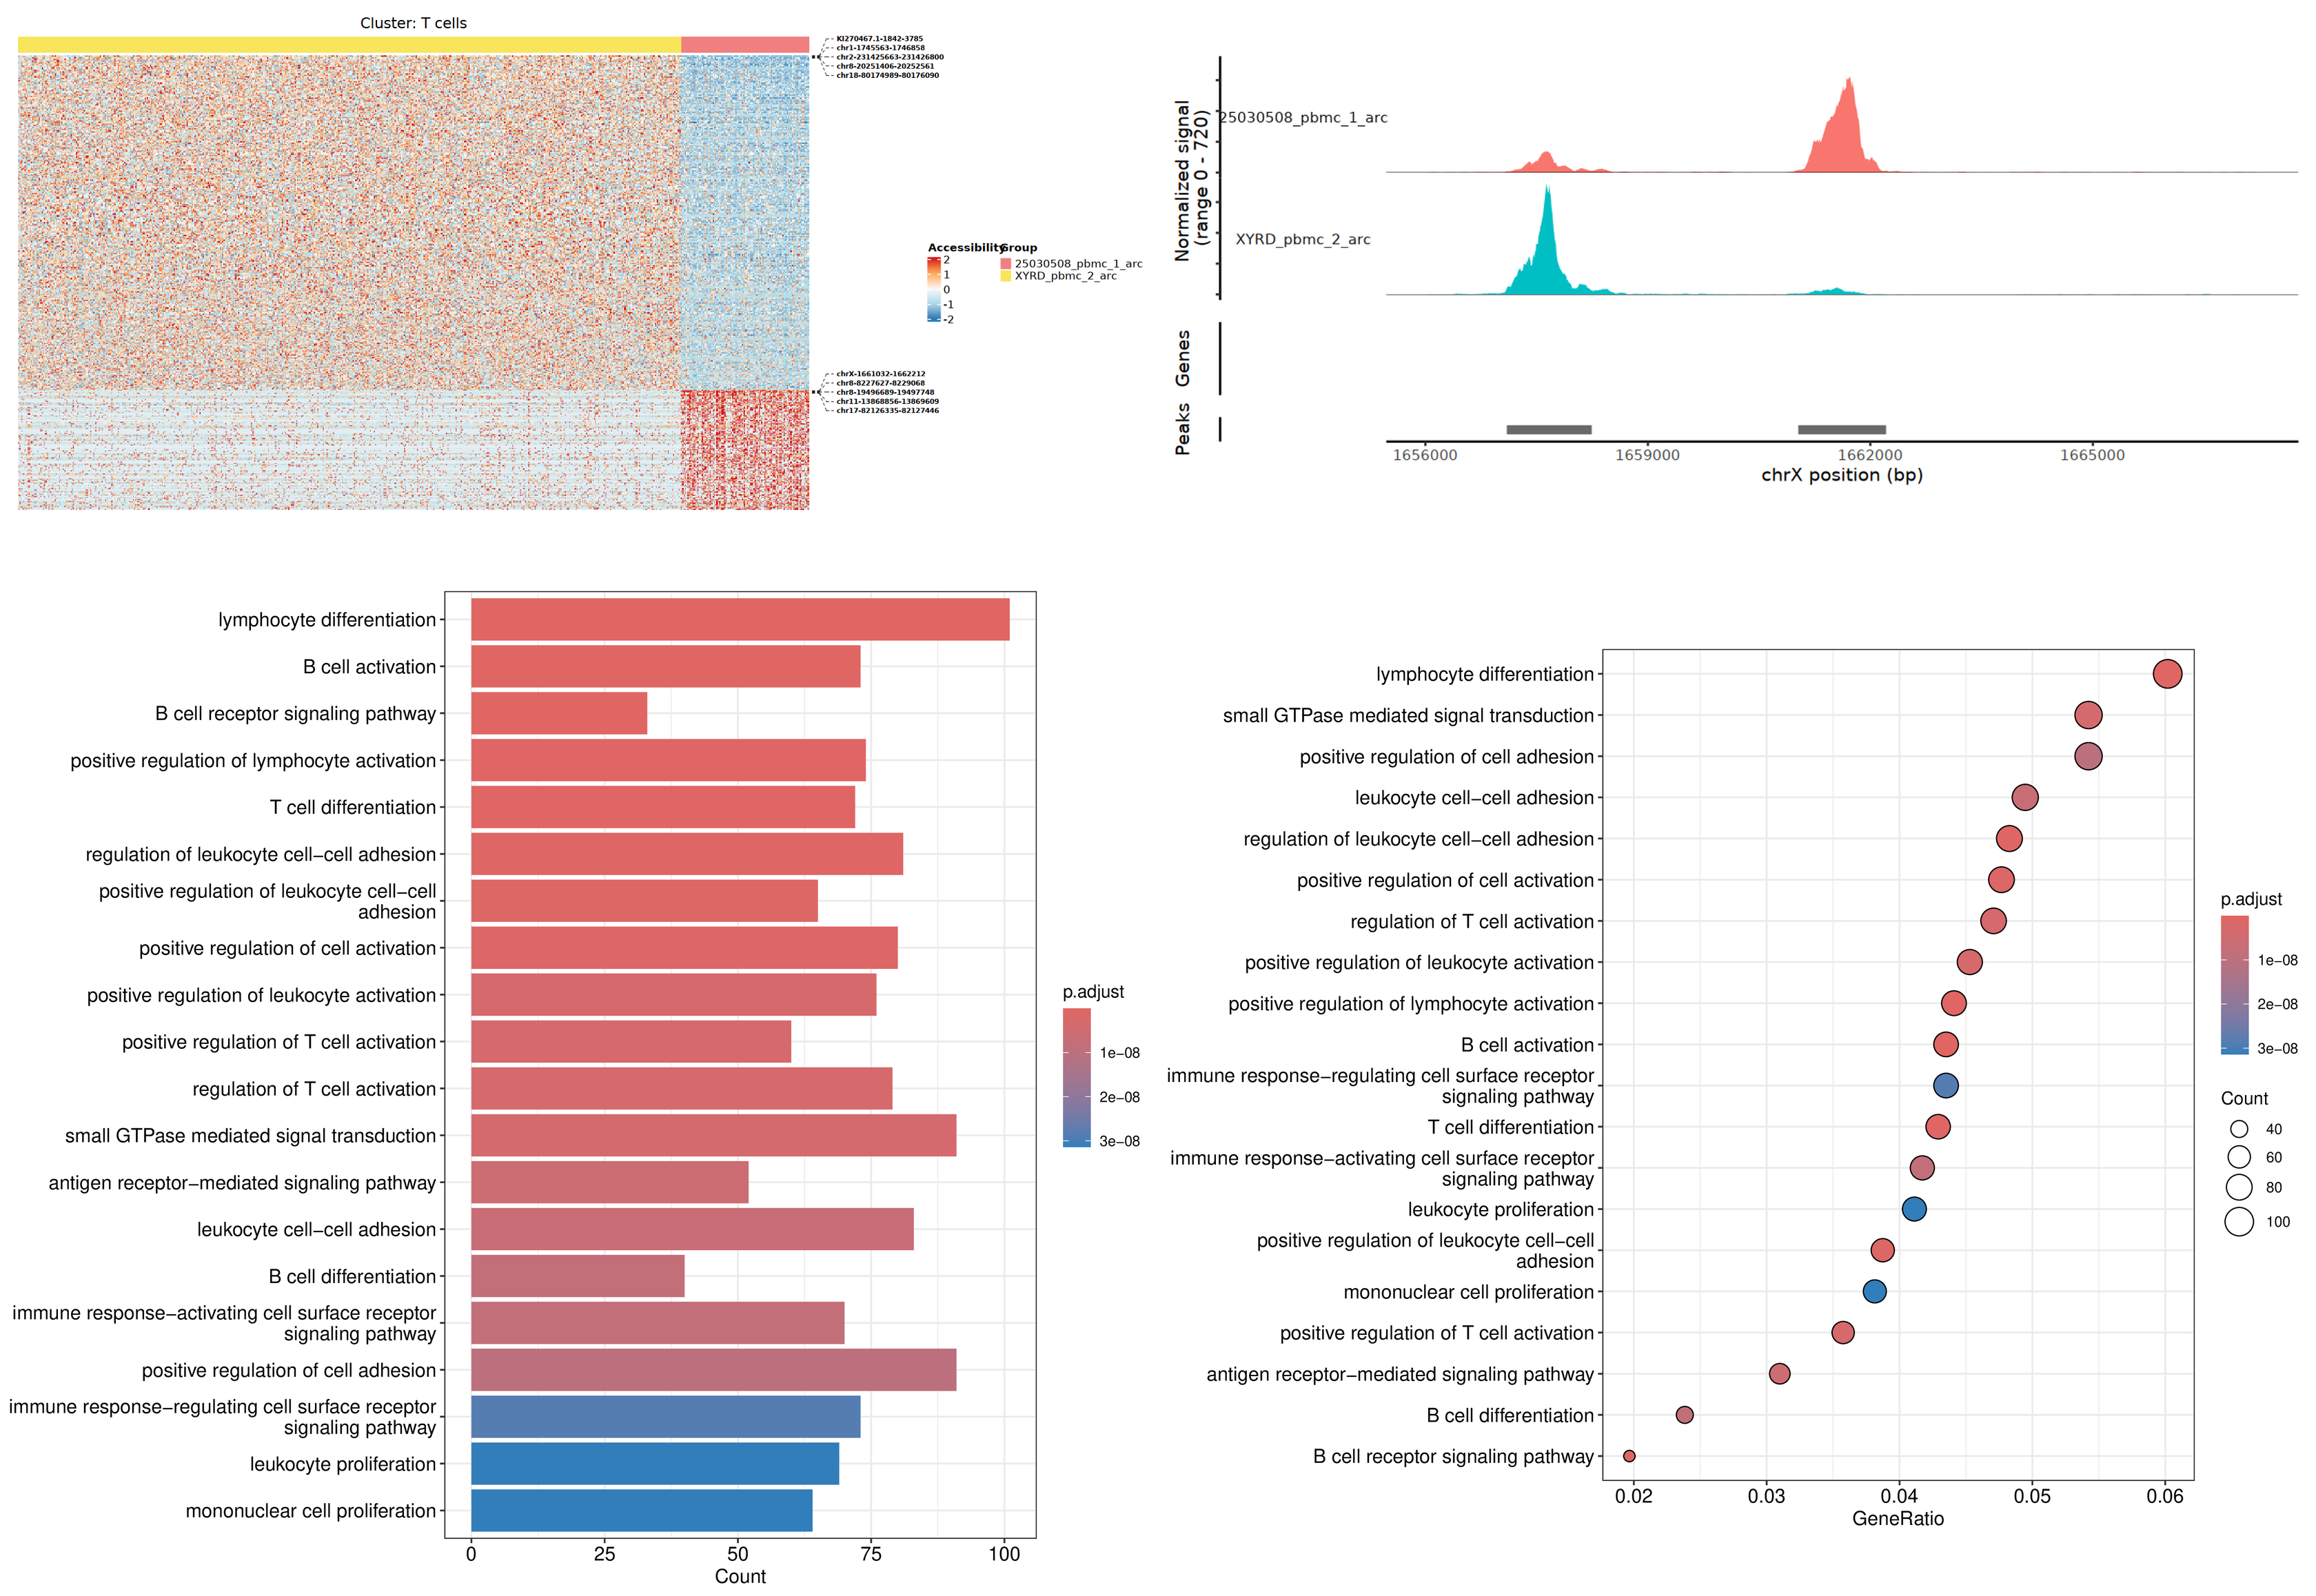
After obtaining a complete cell atlas and type annotations through basic analysis, the next key question is: which regulatory elements exhibit significantly different accessibility between cell types? These differential Peaks are precisely the critical regions that define cell type specificity and regulatory heterogeneity. Differential accessibility analysis aims to systematically identify differentially accessible chromatin regions (Differentially Accessible Peaks) between different cell types or experimental conditions, revealing cell type-specific regulatory elements.
The core objective of differential accessibility analysis is to identify genomic regions that undergo significant chromatin remodeling under specific cell states or experimental conditions. These differential Peaks are often enriched in enhancers, promoters, and other cis-regulatory elements, and are key to understanding cell identity maintenance and state transitions. This analysis supports two comparison modes: Cluster vs All mode is used to identify exclusive accessible regions that define a specific cell type (Cluster-specific Marker Peaks), suitable for resolving cell type heterogeneity; Case vs Control mode compares differences between experimental groups within the same cell type, suitable for exploring the effects of disease, drug treatment, or developmental stages on chromatin accessibility.
The analysis method employs presto::wilcoxauc for efficient Wilcoxon rank-sum testing, combined with multiple testing correction (BH method) to control the false discovery rate. Significant differential Peaks identified are mapped to neighboring genes via the ClosestFeature function, establishing preliminary associations from non-coding region accessibility changes to potential target gene regulation. Further integration with GO/KEGG functional enrichment analysis translates epigenetic chromatin accessibility changes into interpretable biological processes and signaling pathways, providing a candidate regulatory element list for subsequent Motif analysis and regulatory network construction.
3.1 Related Tutorials
- Differential Accessibility Analysis and Enrichment: ATAC + RNA Multi-Omics: Differential Accessibility Analysis (ATAC_DiffEnrich)
Analysis Content: Covers differential Peak identification with multiple testing correction, and functional annotation of differential Peaks, specifically performing GO/KEGG functional enrichment analysis and heatmap visualization using the nearest genes to each peak.
3.2 Input Files
Annotated Seurat object from basic analysis (.rds, containing ATAC assay and cell type annotations), Fragment file directory
3.3 Output Files
Differential Peak statistics table (including log2FC, FDR, associated genes), heatmaps, GO/KEGG enrichment analysis results
4. Motif Analysis
Differential accessibility analysis answers "which regions have different accessibility levels," but does not answer "what drives these differences." Motif enrichment analysis of transcription factor binding sites (TFBS) is the critical step for tracing upstream regulatory factors, revealing which transcription factor binding patterns are enriched in these differentially accessible Peaks, thereby providing clues about upstream regulatory mechanisms.
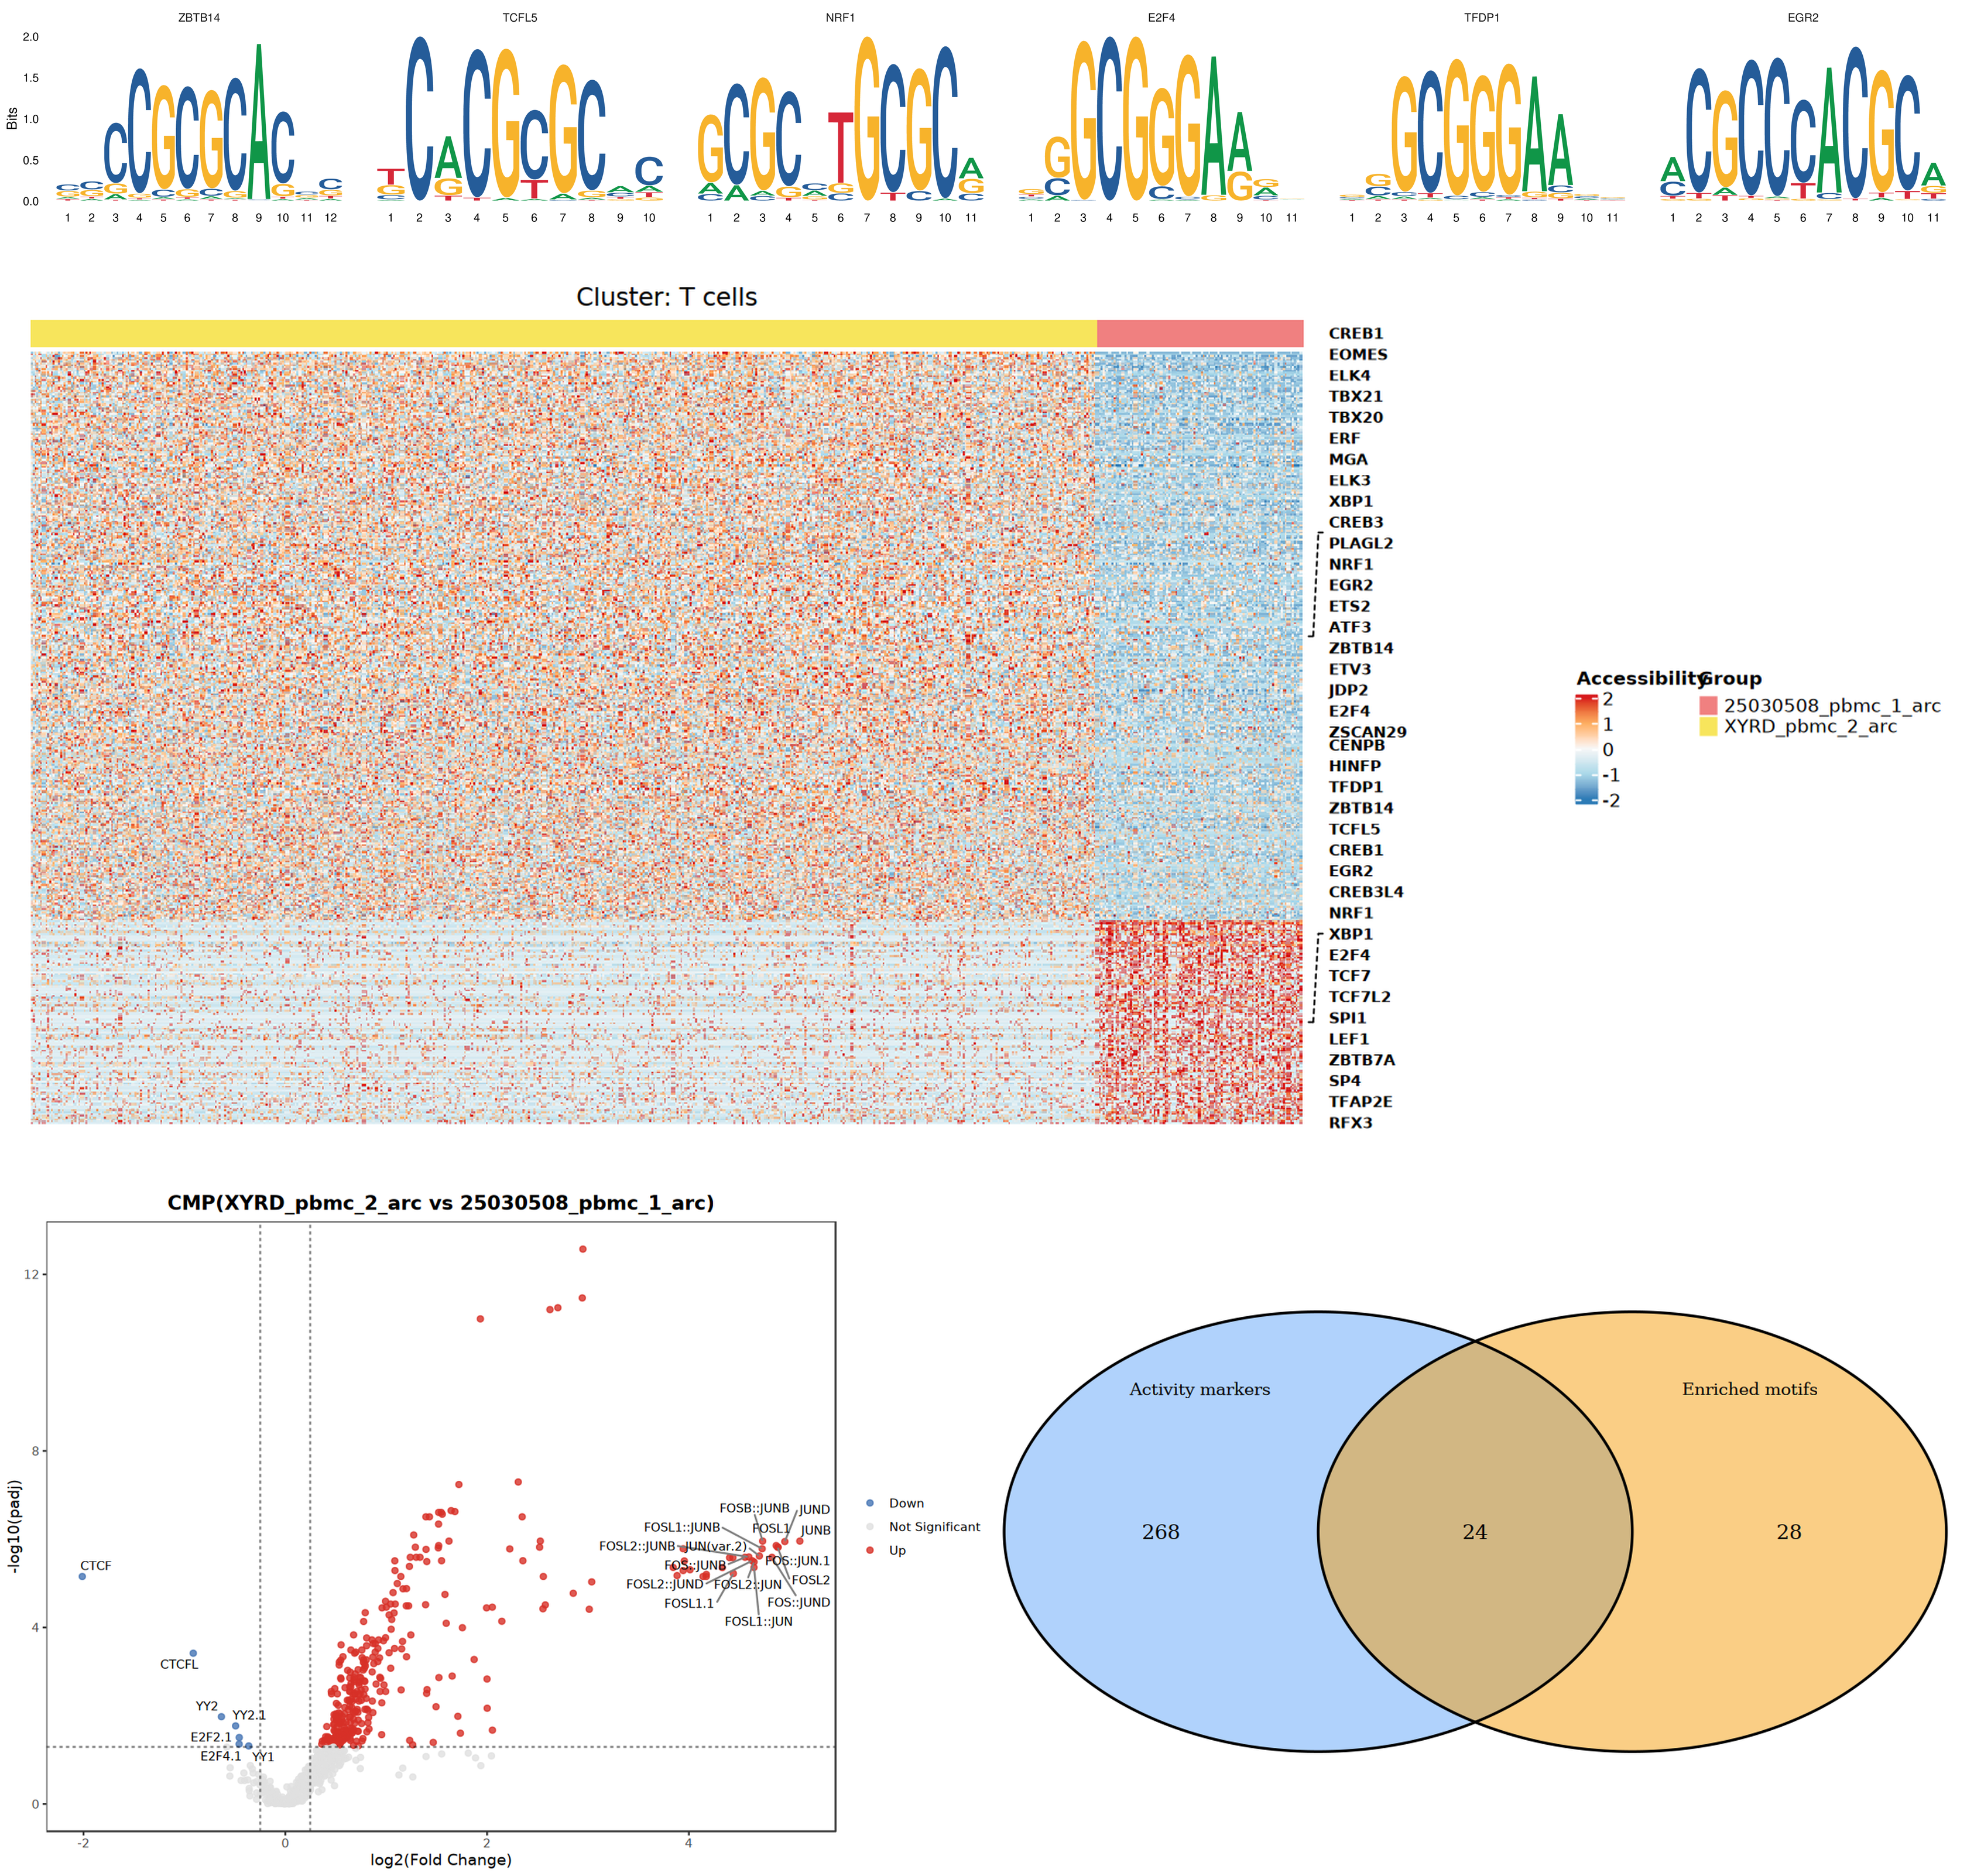
Motif analysis encompasses two complementary analytical dimensions: Motif activity analysis and Motif enrichment analysis. Motif activity analysis is based on the ChromVAR algorithm, which calculates the deviation score of accessibility across the genome for each transcription factor Motif at single-cell resolution, assessing the potential overall activity of different transcription factors. This algorithm constructs a background distribution model that corrects for technical biases such as sequencing depth and GC content, making Motif activities comparable across cells. Motif enrichment analysis, on the other hand, targets specific Peak sets (e.g., differentially accessible Peaks) and uses statistical methods such as hypergeometric testing to detect which transcription factor binding motifs are significantly enriched in these regions, thereby identifying core regulatory factors driving specific accessibility patterns.
The combination of both analyses provides a more comprehensive regulatory landscape: Motif activity analysis reveals genome-wide TF activity changes, while Motif enrichment analysis focuses on the TF binding potential of specific regulatory elements. Further integration with global TF expression-activity correlation analysis can identify "authentic" driver factors that are not only enriched at binding sites but also show high consistency between their RNA expression and chromatin activity, significantly improving the reliability of regulatory network inference.
4.1 Related Tutorials
- Motif Enrichment and Activity Analysis: ATAC + RNA Multi-Omics: Motif Analysis
Analysis Content: Covers JASPAR Motif database loading, ChromVAR Motif activity assessment, differential Motif enrichment, and Motif activity heatmap visualization.
4.2 Input Files
Seurat object (containing ATAC assay), reference genome FASTA file, JASPAR/HOCOMOCO Motif database
4.3 Output Files
Motif activity matrix, differential Motif enrichment rankings, Motif activity heatmaps and network plots
5. Peak-to-Gene Linkage Analysis
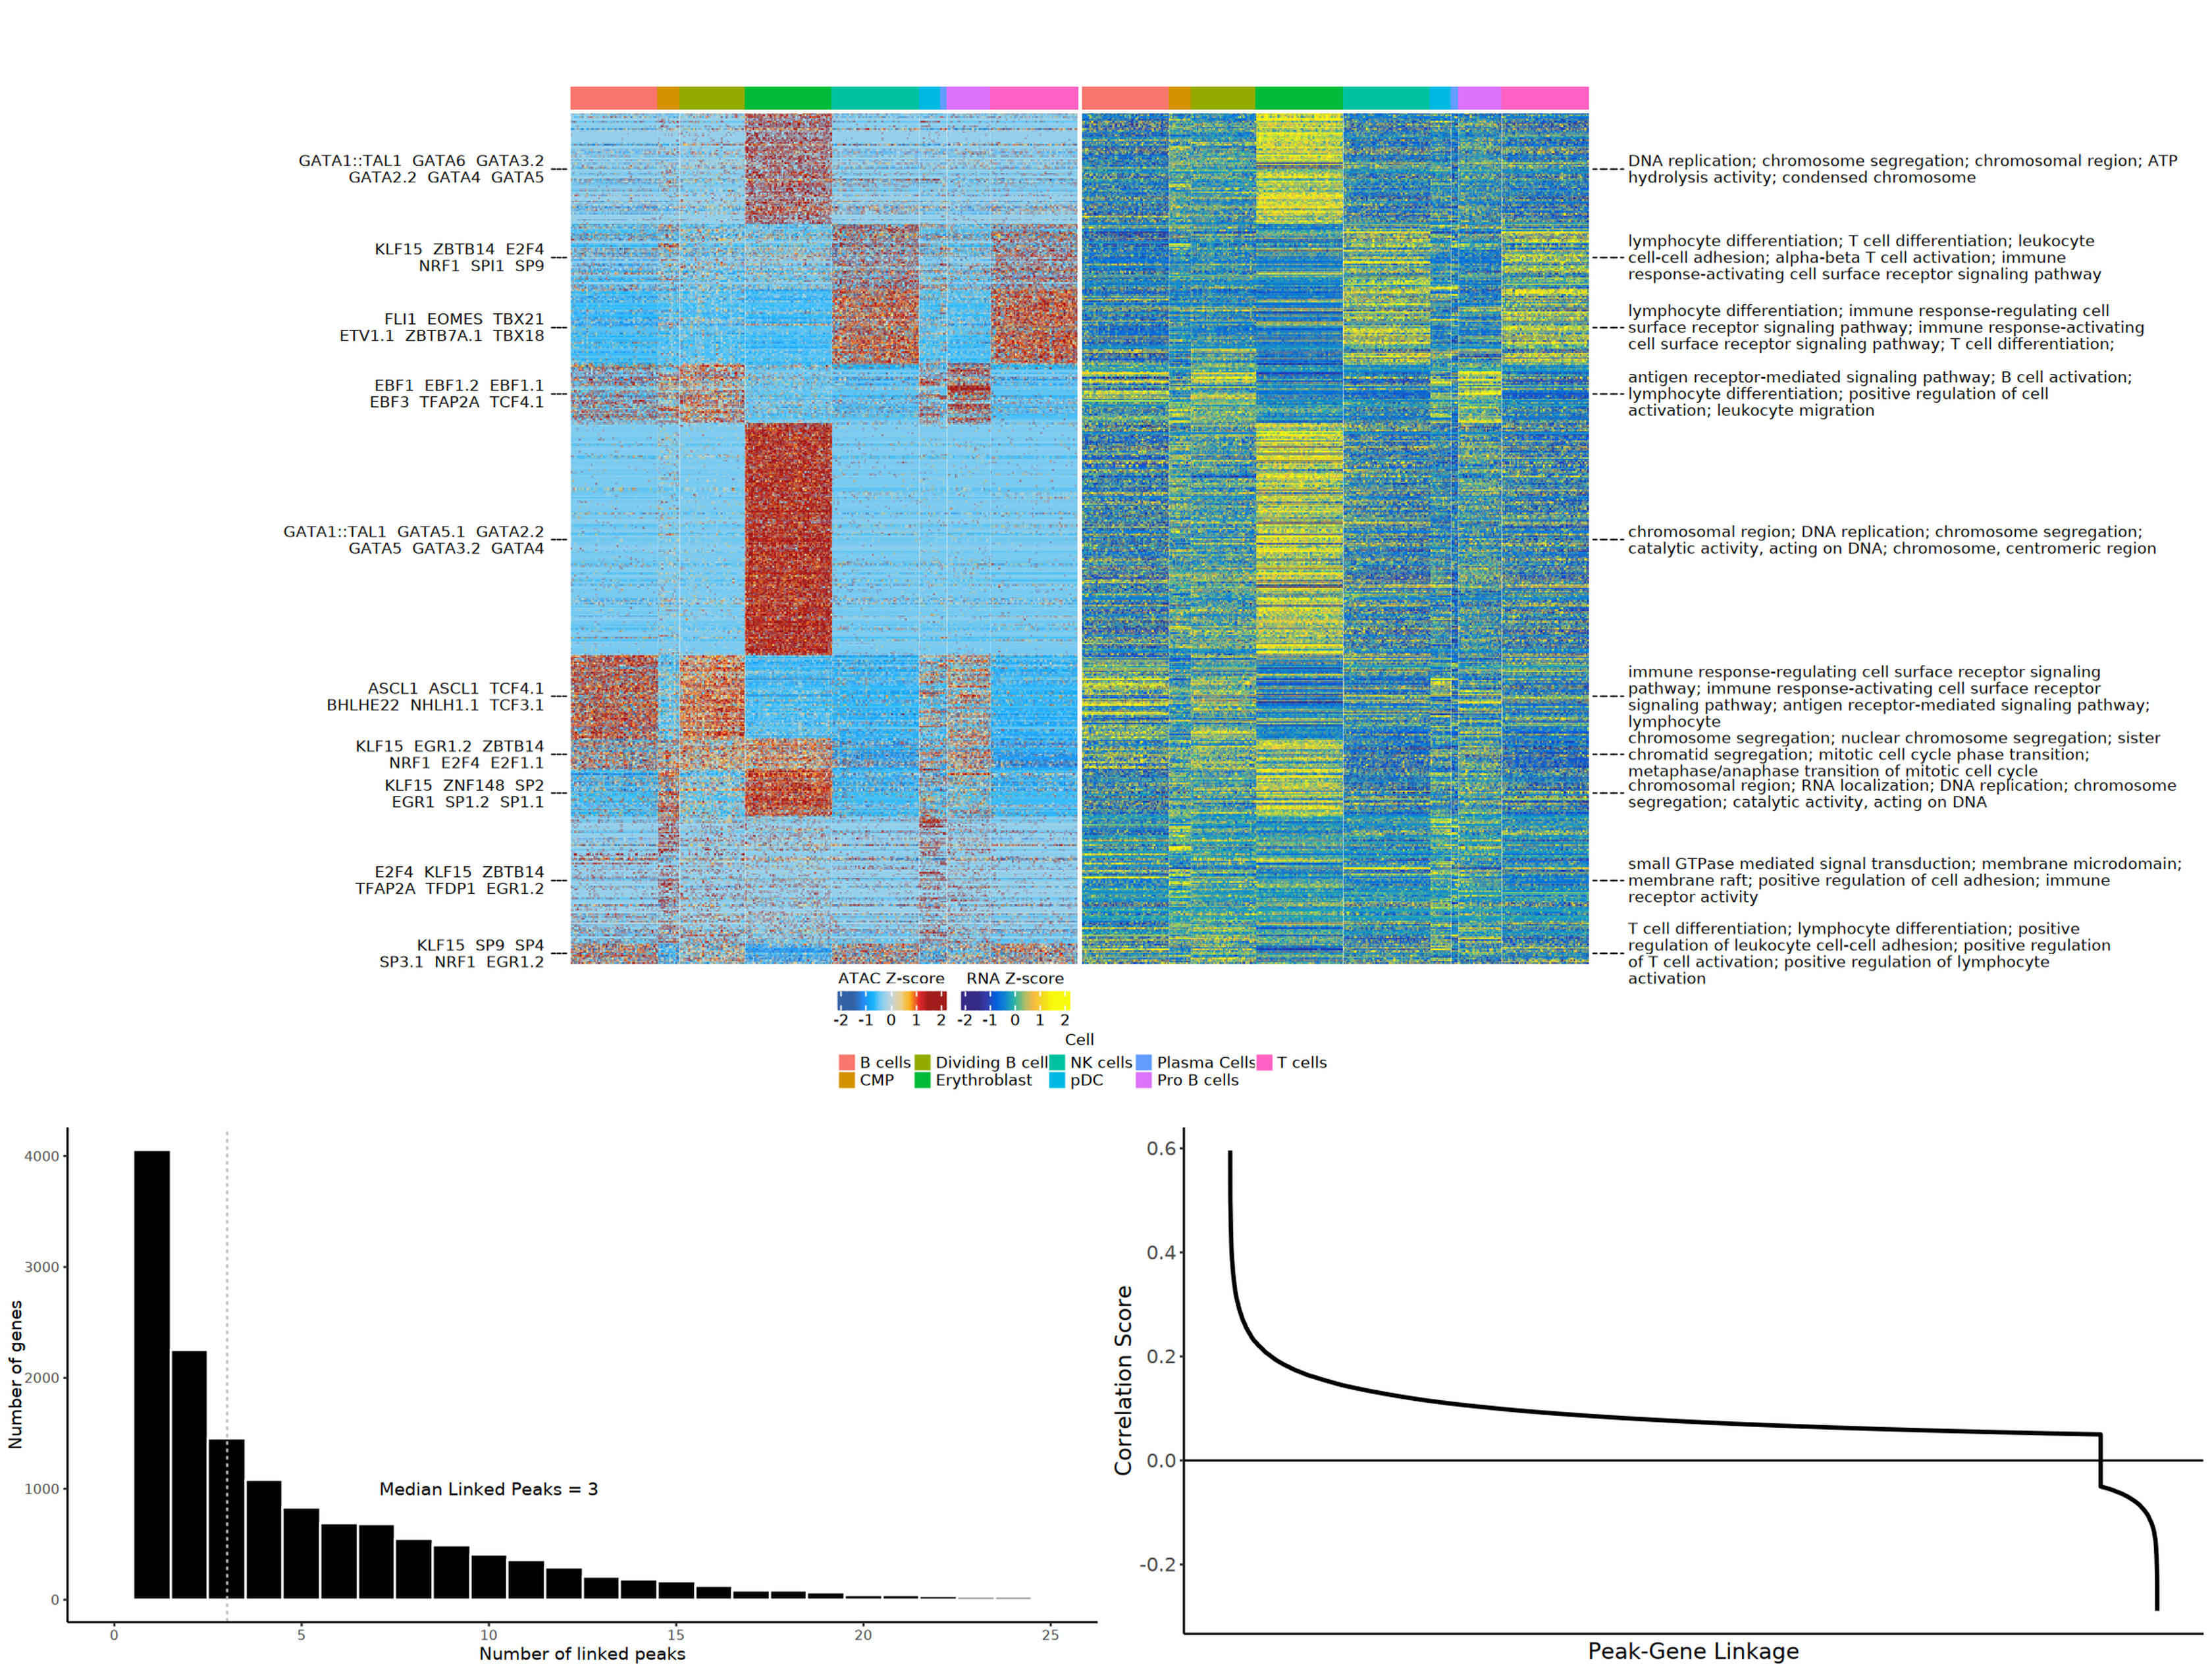
The preceding analyses have revealed the binding relationship between transcription factors and Peaks through Motifs. To resolve the complete TF regulatory network, it is necessary to further establish the regulatory connection between Peaks and downstream genes. Therefore, the next step is to establish physical and statistical associations between Peaks (regulatory elements) and Genes (target genes). Through correlation analysis or distance-based prior annotations, the mapping relationship between regulatory elements and target genes is constructed.
The core assumption of Peak-Gene linkage analysis is covariation: if the true function of a regulatory element (Peak) is to regulate the expression of a specific target gene, then at the single-cell level, the chromatin accessibility variation of that Peak should show significant correlation with the mRNA expression variation of the target gene. This assumption突破了 the limitations of traditional linear distance (e.g., considering only the 1kb region upstream of TSS) and can capture enhancer-target gene relationships that regulate across long distances through chromatin three-dimensional folding. The analysis uses Signac's LinkPeaks function to calculate the Pearson correlation coefficient between each Peak and the expression of neighboring genes, and assesses statistical significance through permutation testing.
To overcome the extreme sparsity of single-cell data (Dropout effect), the analysis pipeline introduces a Pseudobulk strategy: merging multiple cells within the same cell subpopulation into "super-cells," improving the signal-to-noise ratio through accumulated count matrices and making correlation calculations more robust. Furthermore, K-means clustering is used to partition Peak-Gene pairs with similar dynamic variation patterns into independent co-regulatory modules, and Motif enrichment and GO/KEGG functional annotation are performed for each module, revealing co-regulated cis-element networks and their participating biological processes under different cell states.
5.1 Related Tutorials
- Peak-Gene Linkage and Module Analysis: ATAC + RNA Multi-Omics: Peak2Gene Analysis
Analysis Content: Covers Peak-Gene prior linkage construction and correlation scoring, variance filtering, K-means co-regulatory module clustering, and Circos plot visualization.
5.2 Input Files
Annotated Seurat object from basic analysis (containing RNA + ATAC dual-modal data), reference genome FASTA file
5.3 Output Files
Gene2PeakLinks statistics table (Peak coordinates, Gene name, correlation score, P-value), regulatory module clustering results, Circos plots and heatmaps
6. TF-Peak-Gene Triplet Analysis
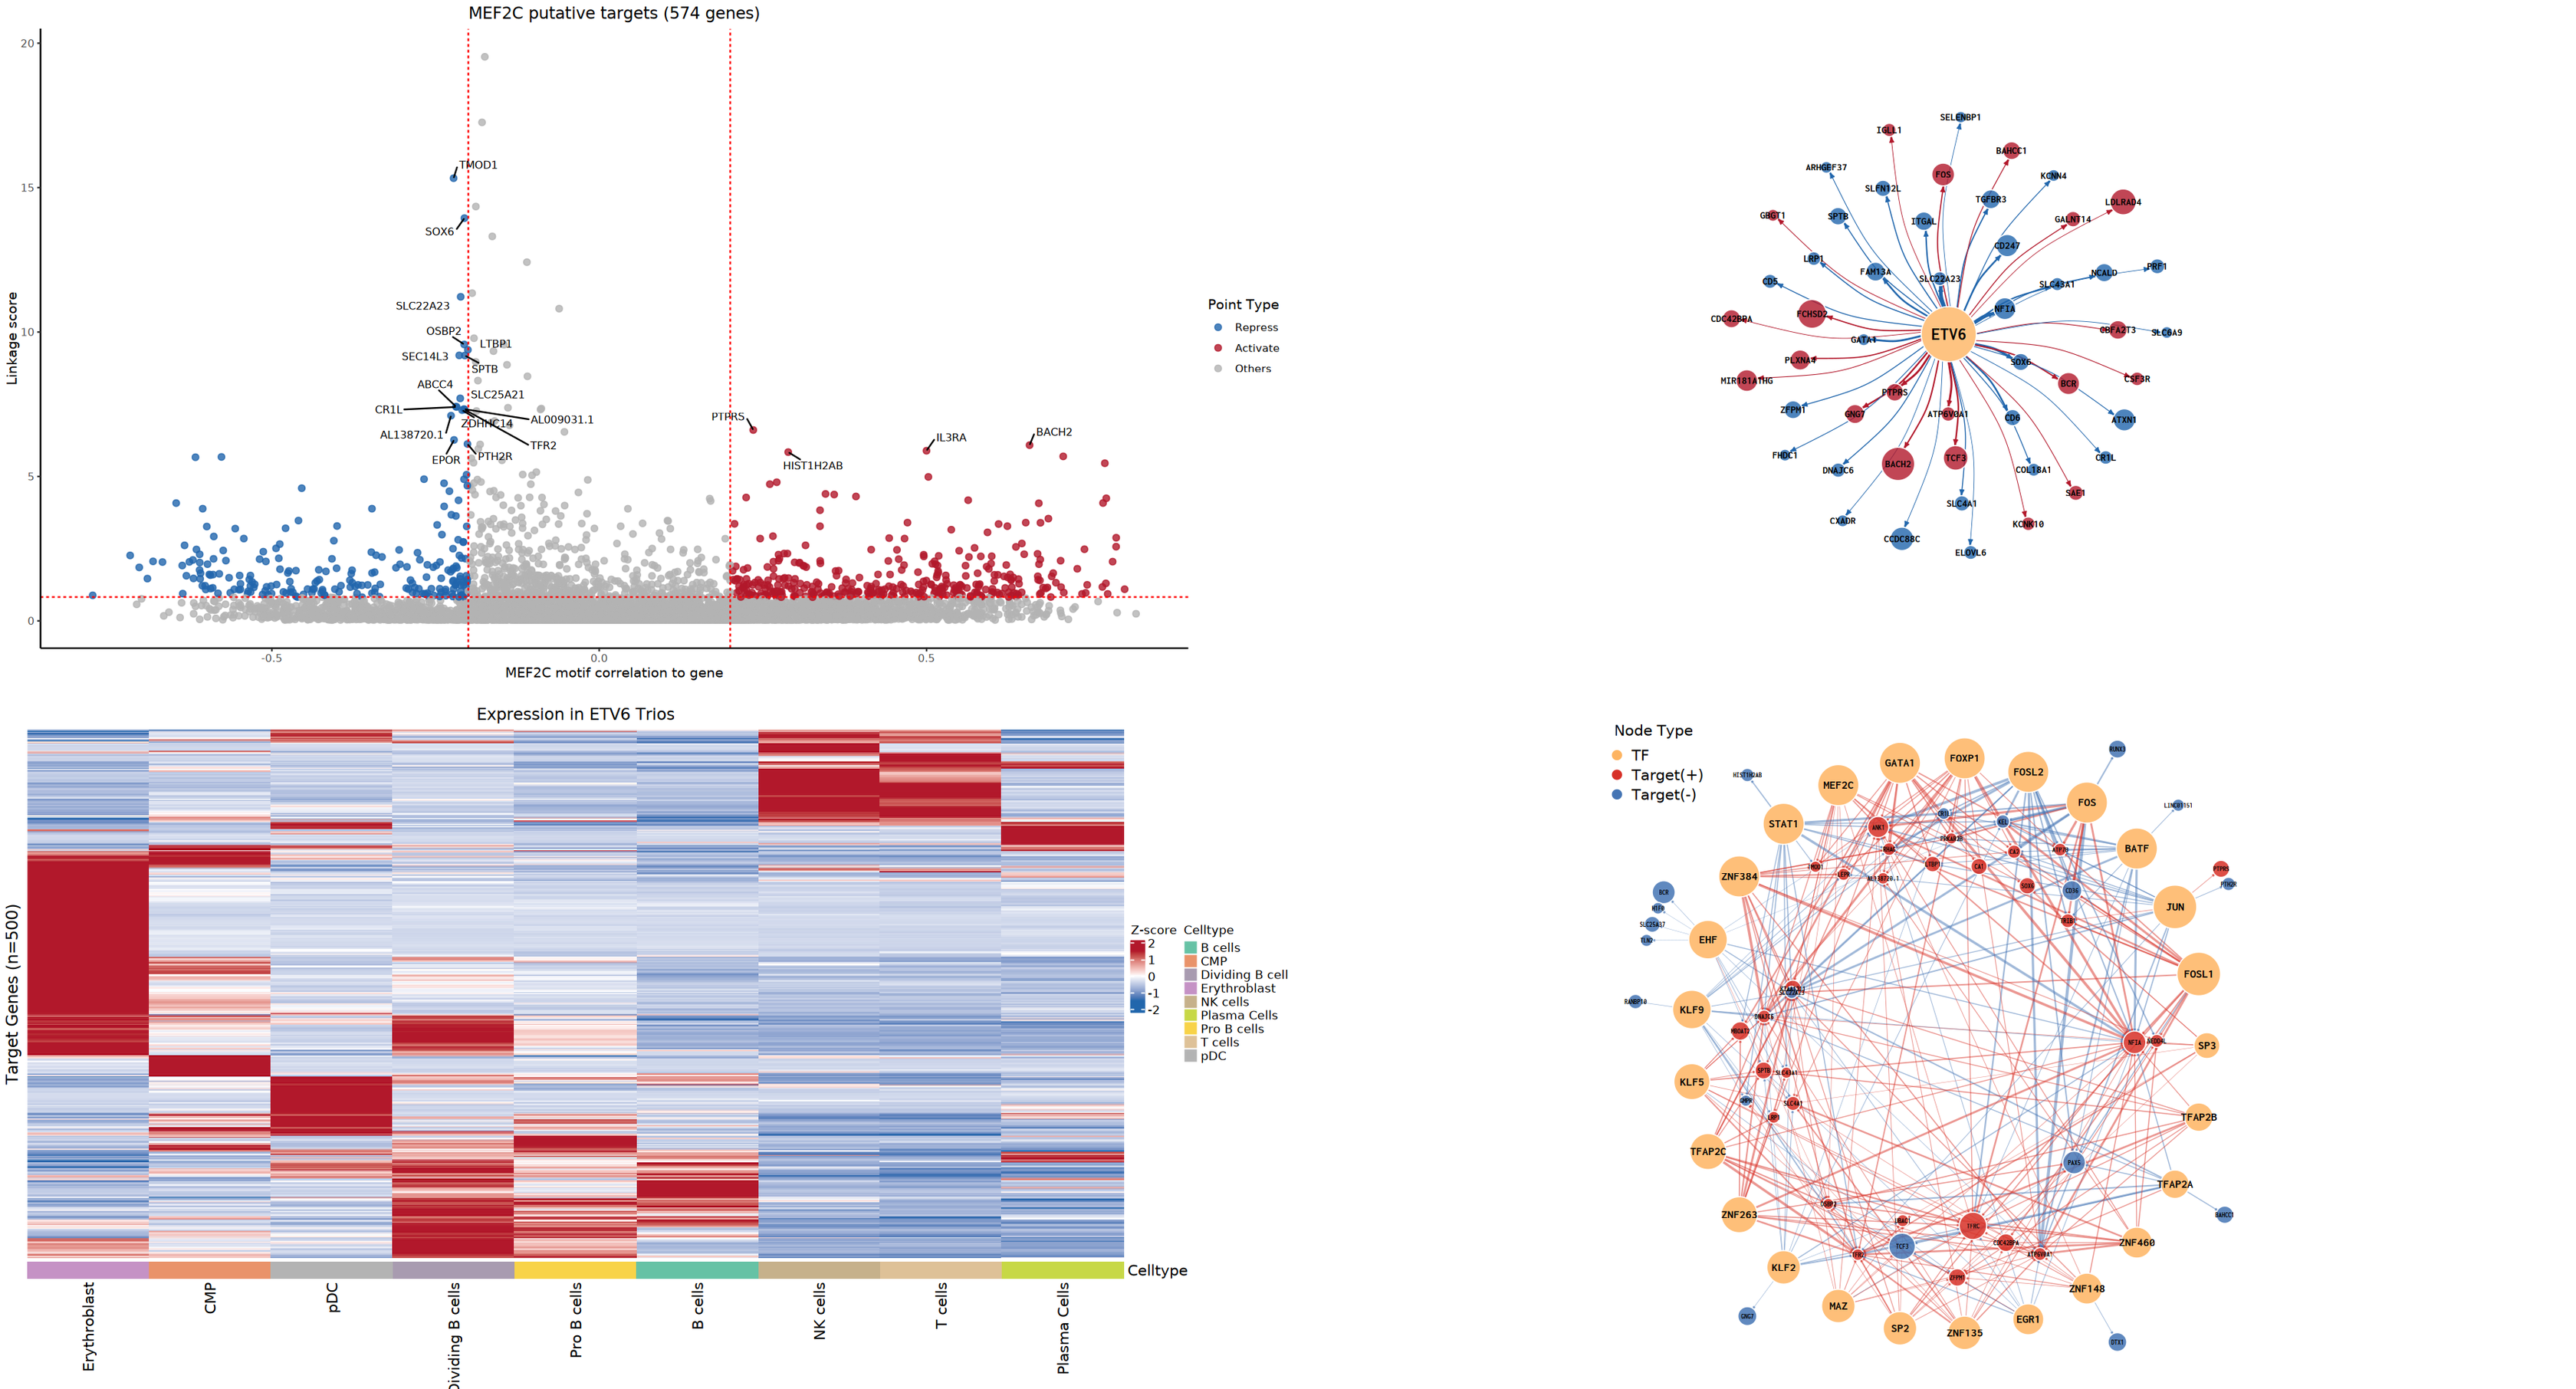
The preceding analyses have separately established the regulatory relationships between TF and Peak, and between Peak and Gene, but the two remain disconnected. Therefore, it is necessary to integrate the relationships between TF-Peak and Peak-Gene. Triplet analysis integrates Motif activity, Peak-Gene linkage, and TF expression information to screen for regulatory triplets that simultaneously satisfy the following three conditions: ① The TF's Motif is present in the linked Peak; ② The Peak is significantly correlated with target gene expression; ③ TF activity is highly consistent with target gene expression.
The biological logic of triplet analysis lies in the fact that authentic cis-regulatory networks must be simultaneously verified across multiple independent dimensions. First, through genomic spatial overlap analysis, the Motif binding sites of specific transcription factors are precisely localized within target regulatory Peaks, establishing the physical binding relationship of "TF → Peak." Second, integrating Peak-to-Gene analysis results, TF-Peak connections and Peak-Gene connections are bridged through shared Peaks, initially constructing the complete logical chain of "TF → Peak → Gene." Finally, multi-dimensional filtering is performed based on scRNA-seq data: calculating the correlation between TF mRNA expression and target gene expression, the consistency between TF ChromVAR activity and its expression, and the covariation between TF activity and target gene expression, retaining only high-confidence regulatory relationships that pass all three tests simultaneously.
To quantify the total intensity of multi-point joint regulation, the analysis introduces the Linkage Score metric: accumulating the independent contributions (Peak-Gene correlation coefficient squared × Motif Score) of all Peaks through which the same TF acts on the same target gene. A higher Linkage Score indicates stronger comprehensive physical evidence that the TF regulates the target gene, making it the most important criterion for subsequent screening of core regulatory backbones. Through this progressively stringent filtering strategy, triplet analysis can strip away background noise from massive candidate relationships and output transcriptional regulatory networks with high biological interpretability.
6.1 Related Tutorials
- TF Regulatory Triplet Inference: ATAC + RNA Multi-Omics: TF-Peaks-Genes Triplet Regulatory Network Analysis (Trios)
Analysis Content: Covers Motif-Peak matching and Peak-Gene link import, multi-dimensional filtering (Motif Score/expression correlation/activity consistency), triplet assembly, and network plot visualization.
6.2 Input Files
Motif analysis results (Motif activity matrix), Peak2Gene Links file (Gene2PeakLinks.xls), cell type annotations
6.3 Output Files
TF-Peak-Gene triplet statistics table, triplet network plots, cell type-specific regulatory relationship plots
7. TF Footprint Analysis
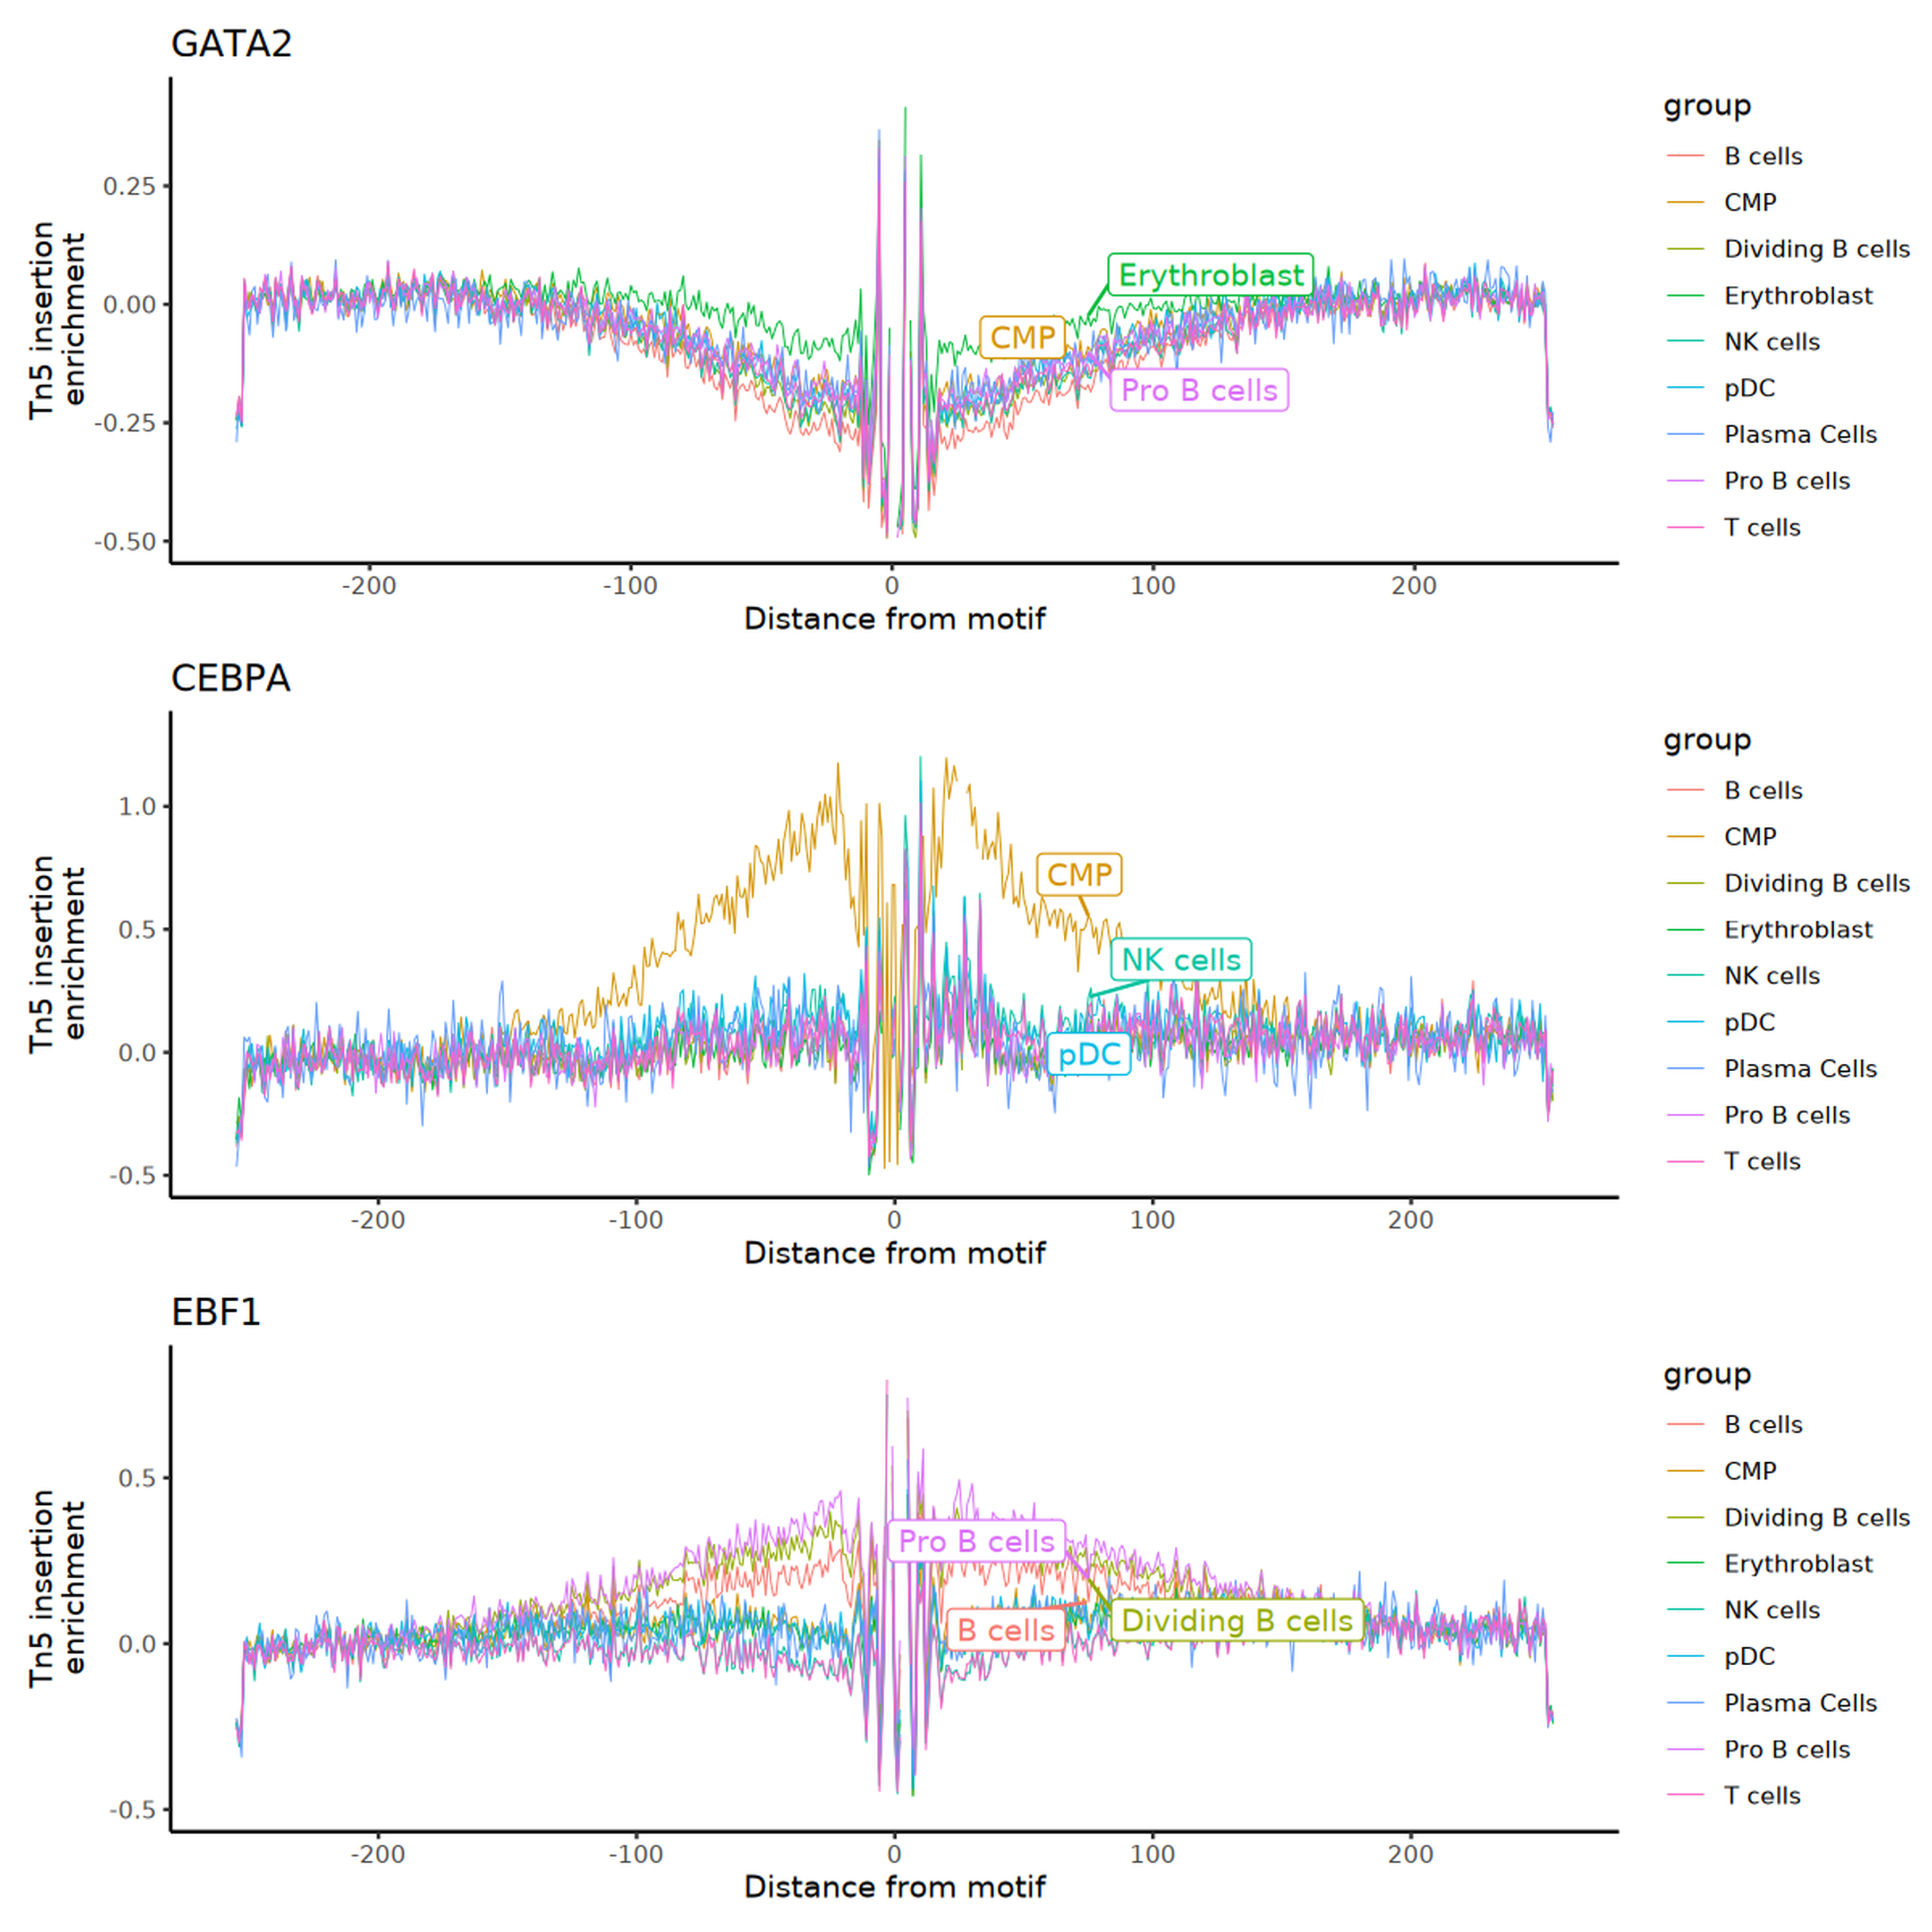
After completing triplet analysis, all potential triplet regulatory relationships have been obtained, but false positives may still exist. Transcription factor footprint analysis detects the "protection effect" of ATAC-seq fragments at TF binding sites (i.e., sites bound by TFs are less susceptible to Tn5 transposase cleavage), directly assessing the actual binding activity of TFs at base resolution, serving as an important complement to Motif activity analysis.
The core principle of Footprint analysis is based on the cleavage mechanism of Tn5 transposase: when a transcription factor protein is bound to DNA, it physically blocks Tn5 enzyme cleavage in that region, creating a relatively low-signal protected zone at the center of the Motif binding site (i.e., the "footprint"), with signal peaks flanking both sides. By precisely counting the distribution frequency of Tn5 cleavage events within 250bp upstream and downstream of the Motif position and comparing against a background expectation model (correcting for Tn5 sequence cleavage bias), the actual binding strength of TFs can be quantitatively assessed. It is noteworthy that Motif enrichment analysis only indicates that a sequence appears more frequently in differential Peaks than in the background, but cannot prove whether the TF is actually bound; Footprint analysis, by detecting physical protection effects, can directly verify the actual occupancy state of TFs at target sites, thereby achieving an evidence upgrade from "likely bound" to "actively engaged."
The analysis pipeline supports multiple visualization modes: cross-cell-type Footprint comparison can reveal cell-specific TF binding activity; cross-experimental-group Footprint comparison can verify dynamic changes in TF binding activity under disease or treatment conditions; aggregated Footprint profiles enhance detection sensitivity by integrating signals from multiple Motif sites. By integrating Footprint evidence, false positive results from triplet analysis can be further filtered, constructing a more reliable transcriptional regulatory network.
7.1 Related Tutorials
- Transcription Factor Footprint Analysis: ATAC + RNA Multi-Omics: Transcription Factor Footprint Analysis
Analysis Content: Covers Motif position localization and fragment cleavage statistics, Footprint score calculation, cross-cell-type comparison, and aggregated Footprint visualization.
7.2 Input Files
Fragment file (fragments.tsv.gz), Seurat object (containing cell type annotations), reference genome FASTA file, Motif position frequency matrix
7.3 Output Files
TF Footprint score matrix, aggregated Footprint visualization plots, cross-cell-type Footprint differential comparison plots
8. DORC Extended Analysis
The preceding triplet analysis and Footprint analysis both proceed from the transcription factor (TF) perspective, progressively verifying "which TFs regulate which genes through which Peaks." However, examining the regulatory network from the target gene perspective is equally crucial: not all genes are regulated with equal density; certain key genes may be synergistically driven by multiple enhancers, forming dense cis-regulatory networks. DORC (Domains of Regulatory Chromatin) analysis proceeds from this perspective, aiming to identify multi-enhancer synergistically regulated target genes that are significantly associated with specific cell types or states, directly linking epigenetic accessibility with gene expression changes. This analysis is built upon the Peak2Gene linkage results and represents an important extension from regulatory element identification to target gene pinpointing.
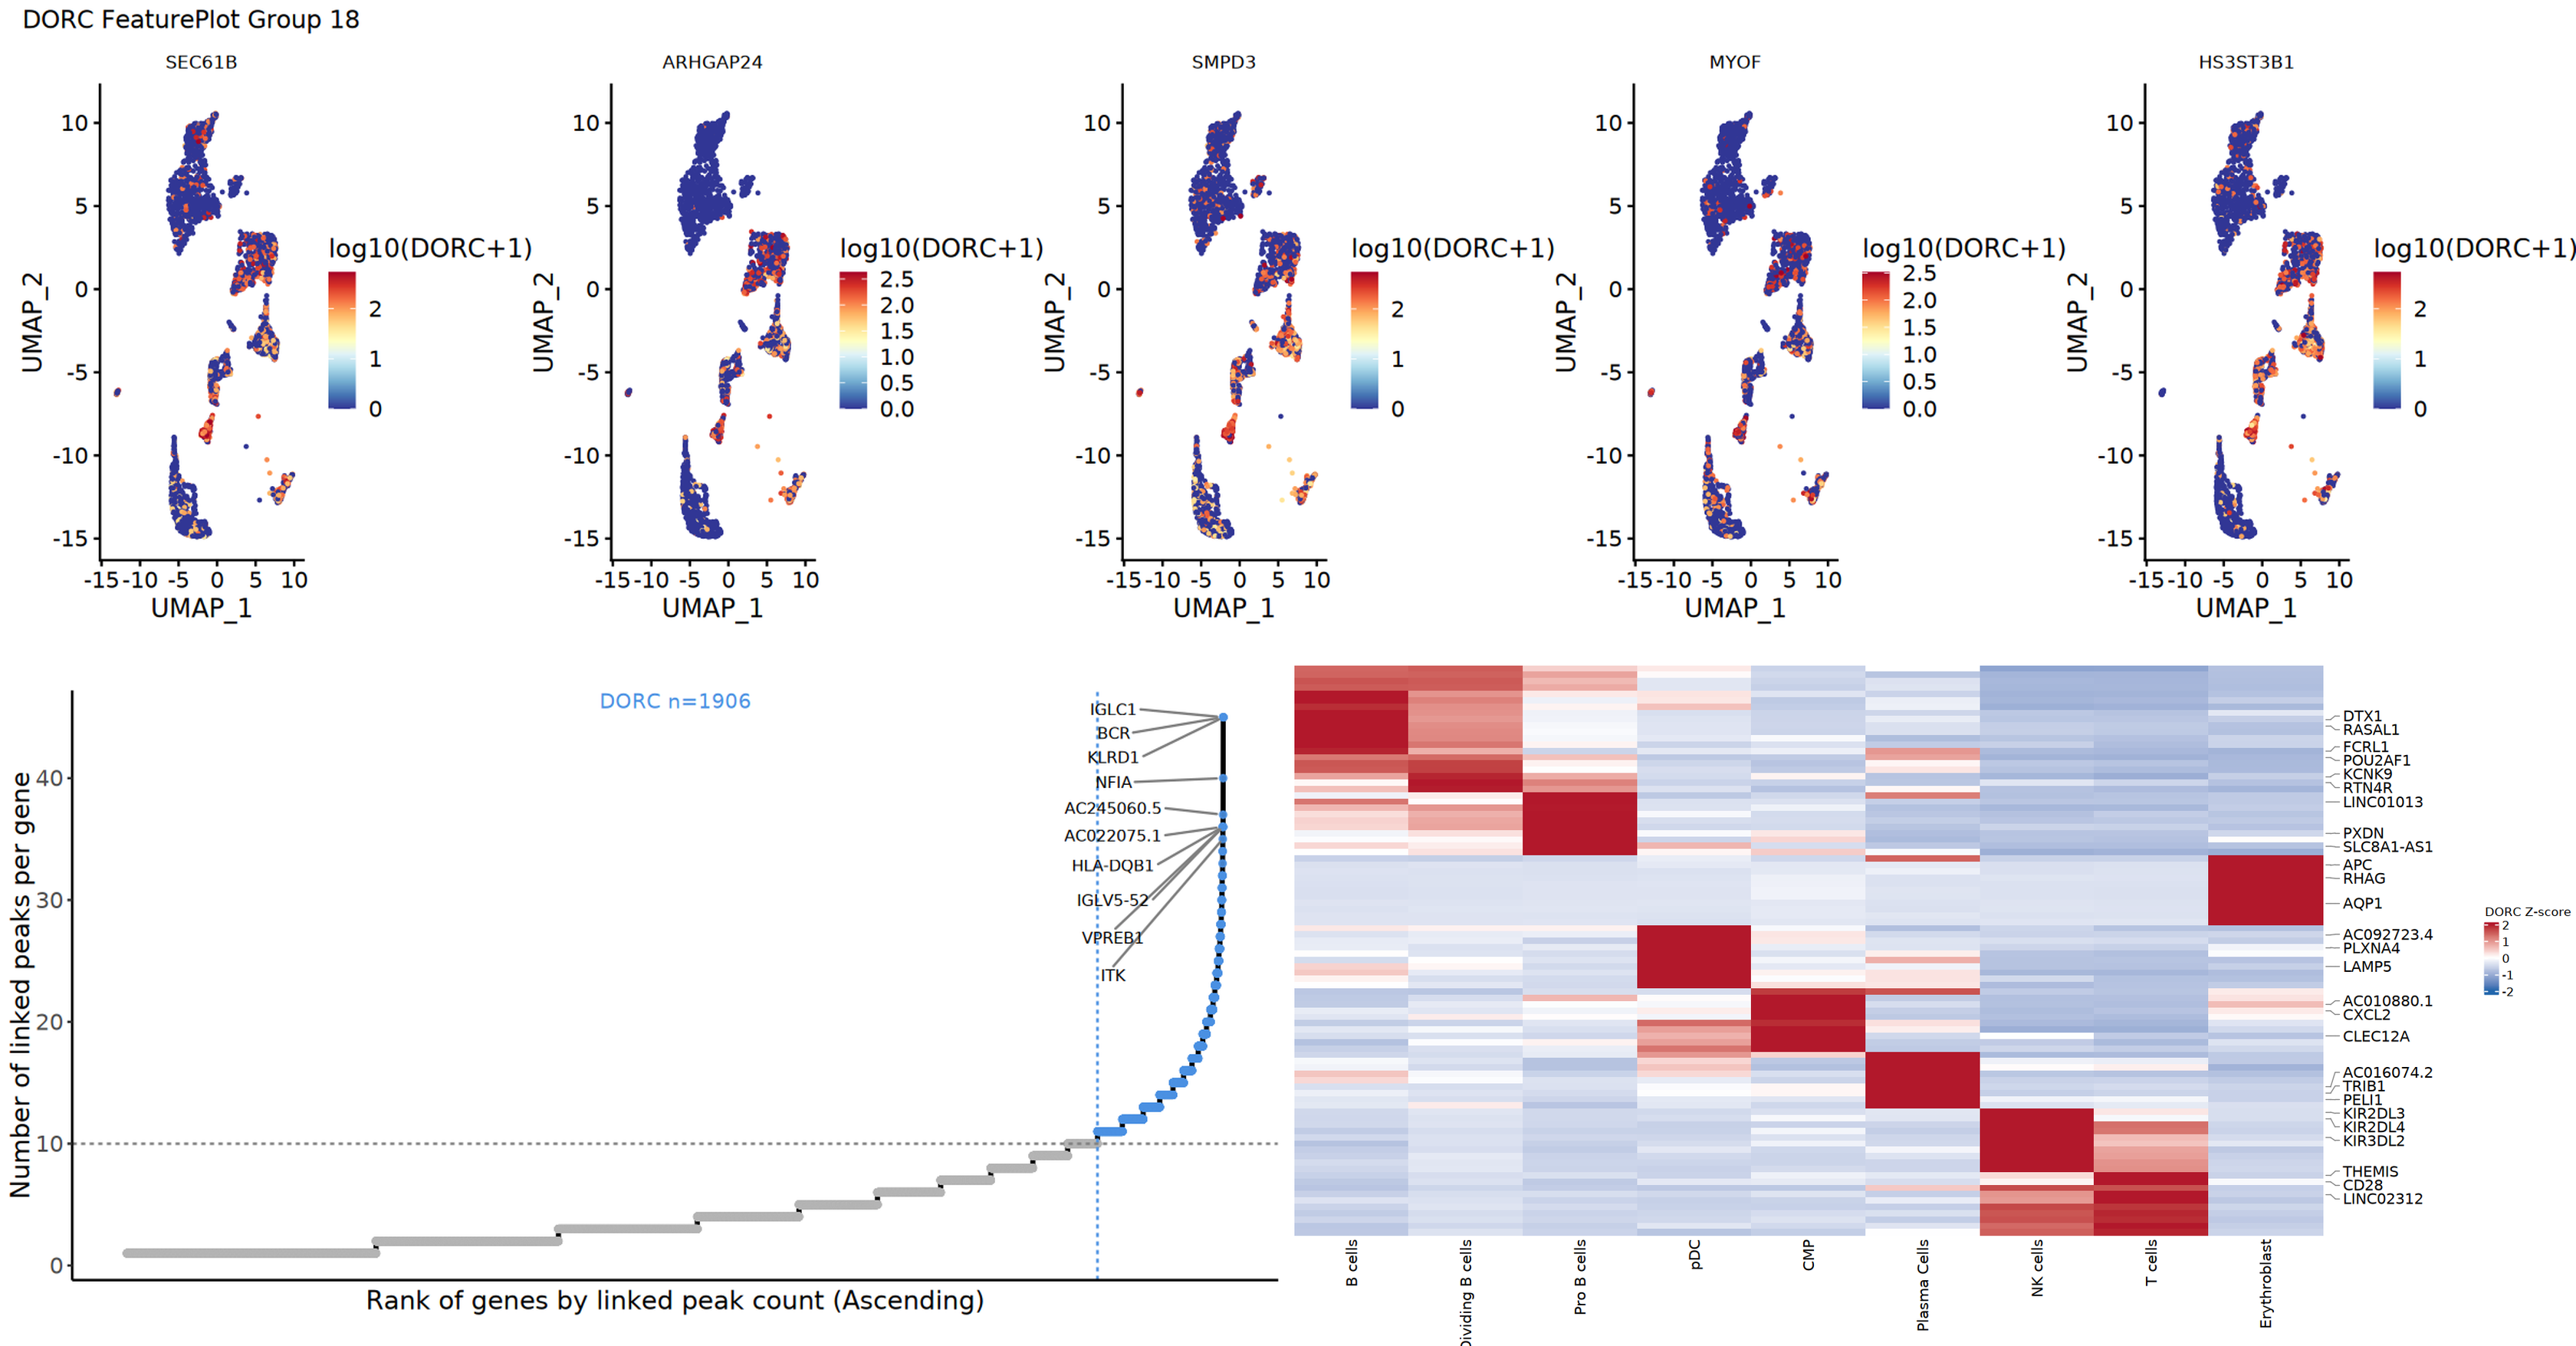
The DORC concept transcends the limitation of single enhancer regulation, focusing on "super target genes" that are coordinately controlled by numerous cis-regulatory elements. Its core assumption is that the key regulatory hubs determining cell fate, maintaining cell states, or driving disease progression are often not independently regulated by a single enhancer, but are jointly driven by multiple (typically ≥10) enhancers distributed across different locations. Therefore, DORC analysis first counts the total number of significant Peaks associated with each target gene genome-wide based on Peak-to-Gene linkage results; subsequently, a stringent background threshold (default ≥10 Peaks) is set, and genes whose associated element counts significantly exceed this threshold are identified as DORC genes. These DORC genes represent transcriptional hubs controlled by dense cis-regulatory networks and are core driver factors for cell identity establishment and maintenance.
After identifying DORC genes, the analysis further calculates the cumulative accessibility of all Peaks targeting the same DORC gene in each cell, generating a single-cell level DORC activity score (Accessibility Score) matrix. By integrating signals from multiple Peaks, the DORC score effectively overcomes the sparsity of individual enhancer signals, more robustly reflecting the overall regulatory intensity upstream of the gene. Differential analysis and clustering heatmap visualization based on the DORC activity matrix can reveal signature regulatory hubs that maintain homeostasis of specific cell populations or drive their differentiation, providing high-priority candidate targets for functional validation experiments.
8.1 Related Tutorials
- DORC Gene Identification and Analysis: ATAC + RNA Multi-Omics: DORC Analysis
Analysis Content: Covers Peak-Gene linkage import and DORC gene screening, cell type-specific assessment, GO/KEGG functional annotation, and DORC heatmap visualization.
8.2 Input Files
Seurat object (containing RNA + ATAC dual-modal data and cell type annotations), Peak2Gene Links file, differential Peak analysis results
8.3 Output Files
DORC gene list (including associated Peak count, expression specificity score), DORC gene functional enrichment results, visualization plots
9. SCENIC+ Regulatory Network Analysis
Chapters 3–8 above constitute a bottom-up stepwise analytical path: from differential Peak identification to Motif enrichment, from Peak-Gene linkage to triplet assembly, from Footprint validation to DORC pinpointing — each module is independent yet complementary, suitable for targeted in-depth investigation of specific biological questions. However, if the research objective is to systematically resolve the complete transcriptional regulatory network at a genome-wide scale, a top-down integration strategy is required. SCENIC+ (Single-Cell Regulatory Network Inference and Clustering Plus) is precisely such a gold-standard tool. It integrates gene expression information from scRNA-seq with chromatin accessibility information from scATAC-seq, completing the global inference from TF to regulatory elements to target genes in a unified framework in a single pass, and significantly reducing false positives through chromatin accessibility constraints, constructing a complete regulatory network of "TF → Regulatory Element (eRegulon) → Target Gene."
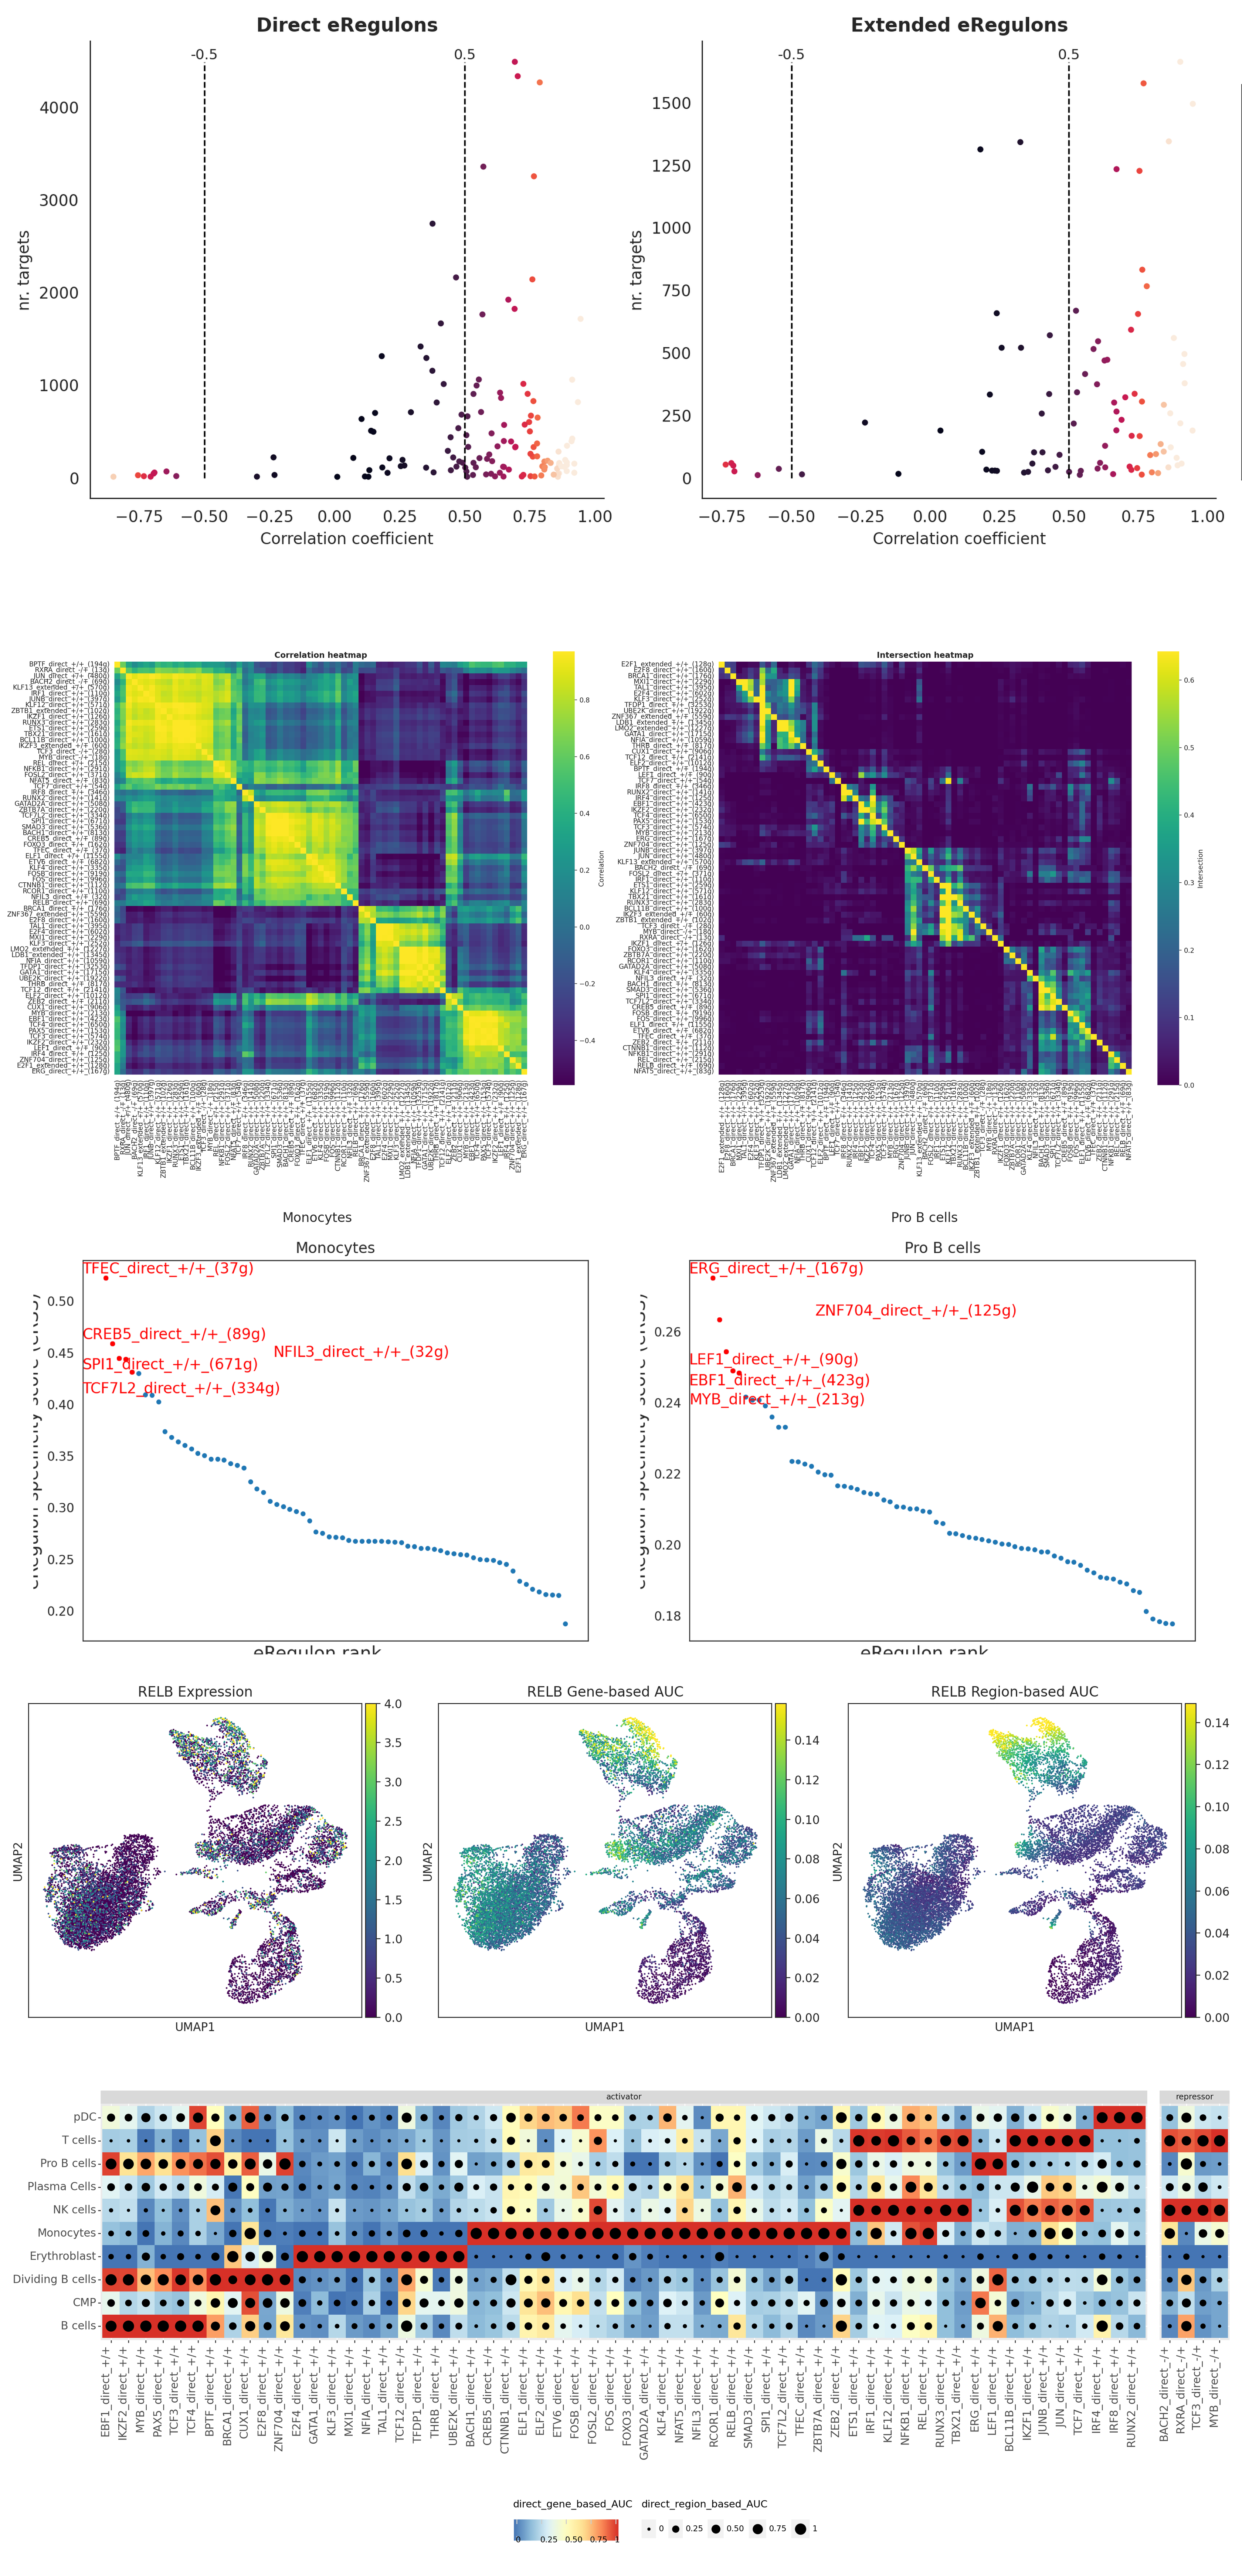
The core advantage of SCENIC+ over traditional SCENIC methods is that traditional SCENIC infers TF-target gene relationships based solely on gene expression covariation, which tends to produce numerous false positive connections from indirect regulation; SCENIC+ integrates chromatin accessibility data, requiring that inferred regulatory relationships must be supported in ATAC data — i.e., the TF's Motif must be present in accessible regions near the target gene. This multi-omics constraint significantly enhances the specificity of the regulatory network. The core concept of the analysis pipeline is the eRegulon (enhanced Regulon), which defines a complete functional unit of "TF + a set of target genes it regulates + the cis-regulatory elements regulating these genes." eRegulons are divided into two categories: direct eRegulon is based on evidence of TF directly binding chromatin regions, with the lowest false positive rate; extended eRegulon is inferred through indirect information such as gene distance or chromatin interactions, covering a broader scope.
The analysis pipeline comprises four key steps: first, co-varying accessible regions are identified through pycisTopic topic modeling; subsequently, the cisTarget database is constructed for Motif enrichment analysis; then SCENIC+ core inference is executed, integrating RNA and ATAC data to construct eRegulons; finally, post-processing steps (including TF expression-AUC correlation assessment, Gene/Region AUC consistency testing, Regulon specificity scoring RSS, etc.) are applied to filter high-quality eRegulons. RSS scoring quantifies the specific enrichment degree of each eRegulon across different cell types and is a key metric for identifying cell type-specific regulatory factors.
9.1 Related Tutorials
- SCENIC+ Multi-Omics Regulatory Network Inference and Post-Processing: ATAC + RNA Multi-Omics: SCENIC+ Multi-Omics Regulatory Network Analysis
Analysis Content: Covers Seurat→AnnData conversion, pycisTopic topic modeling, cisTarget database construction, SCENIC+ regulatory network inference (eRegulon construction), and post-processing visualization (RSS scoring, UMAP dimensionality reduction, regulatory network plots).
9.2 Input Files
Seurat object (containing RNA + ATAC assay, *.rds), metadata file (optional, meta.tsv), ENCODE blacklist file, reference genome FASTA and chromosome size files, Aertslab Motif collection files (*.cb), Mallet and Cluster Buster executables
9.3 Output Files
scplusmdata.h5mu (MuData object containing eRegulon AUC matrix), ctx_results.hdf5 (cisTarget Motif enrichment), dem_results.hdf5 (differential accessibility analysis), AUCell_direct/extended.h5mu (AUCell activity matrix), eRegulon quality assessment report and RSS scores
10. ATAC-Based Monocle3 Trajectory Analysis
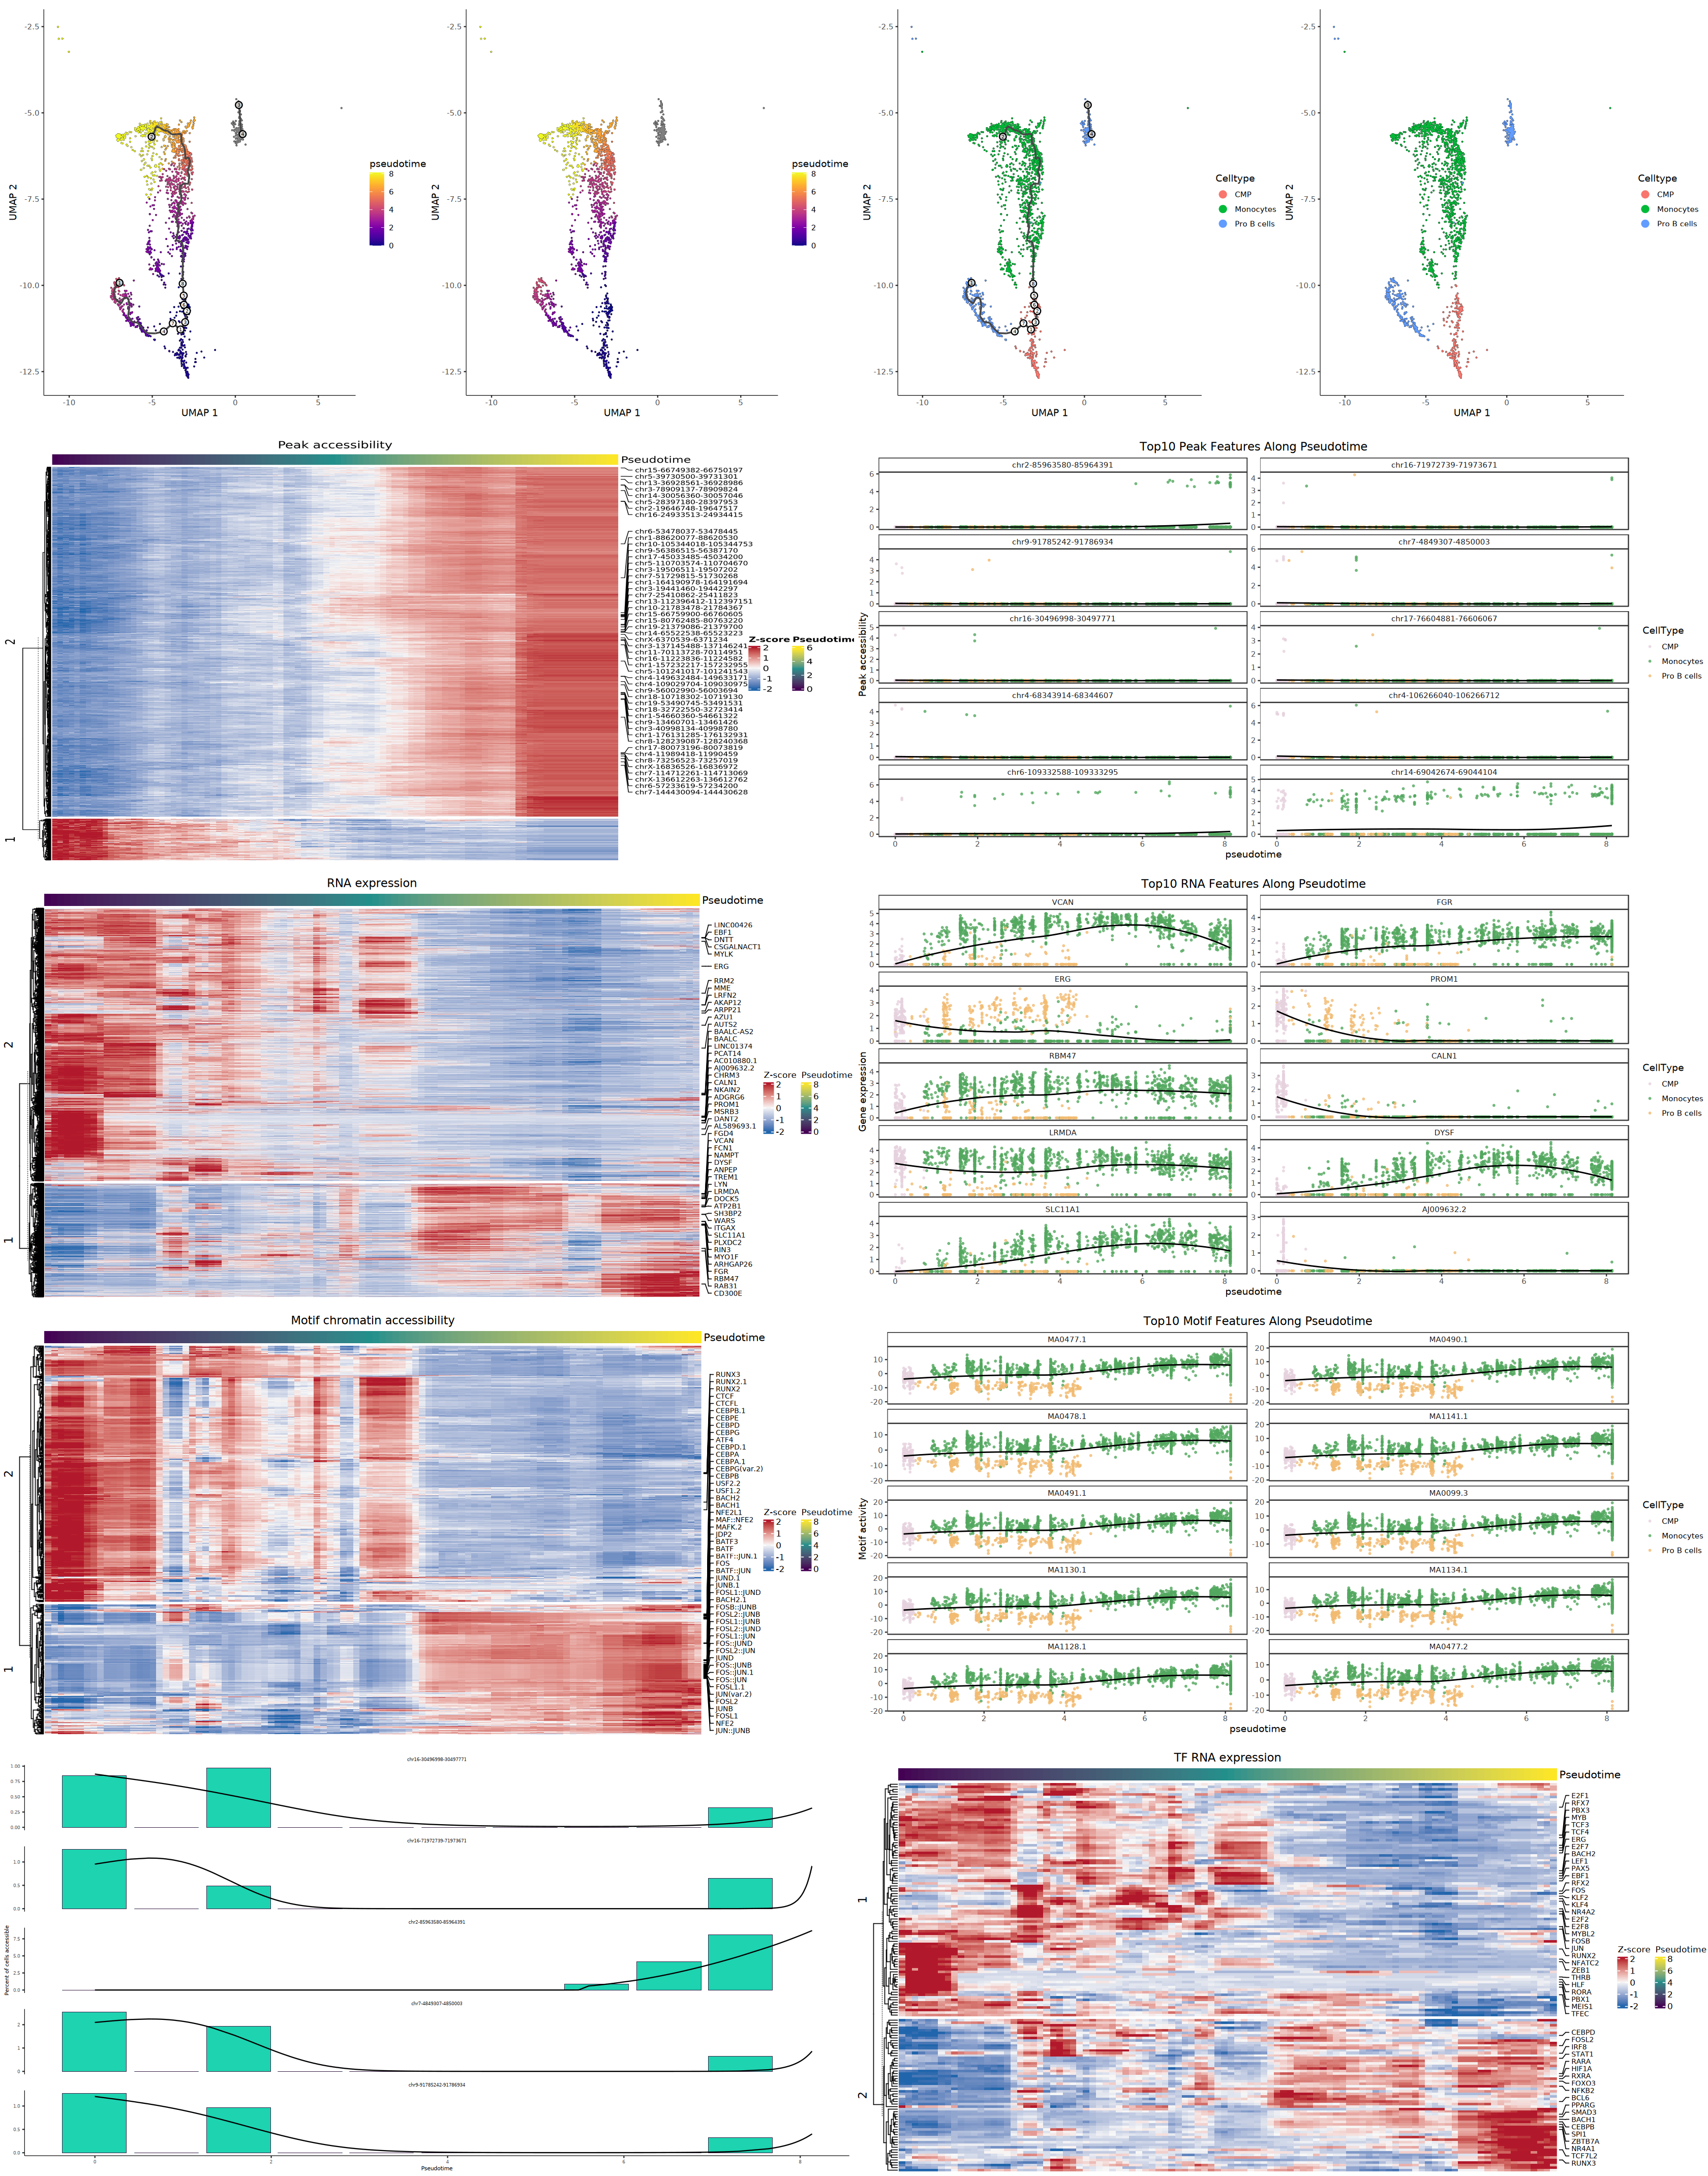
Chapters 3–9 above focus on static regulatory network resolution across different cell types or experimental conditions, revealing "who regulates whom under a specific state." However, many biological processes (such as developmental differentiation and disease progression) are inherently continuous dynamic processes, and static snapshots alone cannot capture the temporal logic of regulatory events. Monocle3 trajectory analysis is an optional analytical track that can run in parallel with or complement the preceding regulatory network analyses; it can be initiated once basic cell type annotation is complete and does not depend on the results of subsequent advanced analyses. It uses the Monocle3 trajectory inference algorithm to reconstruct the continuous developmental or differentiation process of cells from a "starting point" to an "endpoint," ordering discrete cells in high-dimensional space along an implicit biological trajectory through pseudotime analysis, thereby revealing the dynamic variation patterns of Peak accessibility, Motif activity, and gene expression along the developmental trajectory.
This tutorial revolves around three core modalities, systematically reconstructing the complete logical chain of "regulatory initiation → chromatin change → gene expression":
- Peak (chromatin accessible peak): Represents cis-regulatory elements whose accessibility changes dynamically along pseudotime.
- Motif (transcription factor binding motif): Reflects the dynamic changes of TF potential binding activity at the chromatin level along pseudotime.
- Gene (gene expression): The ultimate functional output of regulatory events at the transcriptional level, exhibiting spatiotemporally specific expression patterns along pseudotime.
The core algorithm of Monocle3 is Principal Graph Learning: in the dimensionality-reduced space (UMAP), the algorithm learns the optimal graph structure connecting various cell state clusters, constructing a trajectory backbone that captures continuous cell state transitions. Using a user-specified root cell population (e.g., stem cells, progenitor cells) as the starting point, the pseudotime value for each cell is calculated along the principal graph, thereby enabling the ordering of cells along the developmental process. The analysis pipeline supports multi-modal joint analysis: first learning the trajectory topological structure based on ATAC data, then applying the same trajectory framework to the RNA expression matrix and ChromVAR Motif activity matrix through Assay Swap, separately detecting Peaks, Motifs, and Genes that change significantly along pseudotime. This "one trajectory framework, multiple modality analyses" strategy enables researchers to precisely resolve the temporal relationships and causal logic between transcription factor expression changes, chromatin accessibility remodeling, and target gene transcriptional activation on a unified developmental timeline.
10.1 Related Tutorials
- ATAC-Based Monocle3 Trajectory Analysis: ATAC + RNA Multi-Omics: ATAC-Based Monocle3 Analysis
Analysis Content: Covers Monocle3 trajectory inference and pseudotime calculation, differential Peak/Motif/Gene detection along pseudotime, and multi-modal joint visualization (heatmaps and scatter plots).
10.2 Input Files
Seurat object (.rds, must contain ATAC/RNA Assay, clustering information, and UMAP dimensionality reduction results), reference genome FASTA file, cell metadata file (optional, meta.tsv)
10.3 Output Files
CDS object (cds.rds, containing pseudotime values), pseudotime trajectory visualization plots, differential Peak/Motif/Gene statistics tables (CSV), multi-modal smoothed heatmaps, Top feature scatter plots along pseudotime
11. Data Analysis Recommendations
Tip: ATAC-RNA dual-omics analysis is a highly systematic endeavor driven by biological questions. The multi-dimensional analysis modules provided in this guideline are designed to construct a complete mechanistic resolution chain from epigenetic regulation to transcriptional output. You can flexibly combine analysis paths based on data quality, cell type complexity, and core research objectives.
11.1 Core Analysis Path Recommendations
The core logic of ATAC-RNA dual-omics analysis is progressive layering and multi-dimensional validation: from basic cell atlas construction, to regulatory element identification, to complete regulatory network resolution. Depending on research objectives, the following analysis paths are recommended:
Basic Resolution and Atlas Construction: Sequentially complete "Basic Analysis" (single-sample quality control clustering or multi-sample integration with batch correction) to achieve unsupervised cell partitioning and cell type annotation. This is the data foundation for all downstream analyses, and its quality directly determines the reliability of subsequent analyses. For single-sample data, the Signac pipeline's WNN multi-modal clustering typically identifies finer cell subpopulations; for multi-sample data, select Harmony (fast and robust) or CCA (suitable for strong batch effects) for integration based on batch effect intensity.
Differential Feature and Regulatory Clue Mining: After obtaining cell annotations, sequentially perform "Differential Accessibility Analysis" (identifying cell type-specific Peaks or condition-specific differential Peaks) and "Motif Analysis" (assessing TF activity via ChromVAR, identifying regulatory TFs through enrichment analysis), establishing preliminary associations between "regulatory elements and transcription factors." If the research focuses on continuous developmental or differentiation processes, "Monocle3 Trajectory Analysis" can be simultaneously executed to reveal the dynamic variation patterns of Peaks, Motifs, and gene expression along pseudotime, resolving the temporal logic of regulatory events.
In-Depth Regulatory Mechanism Resolution: Based on differential Peaks and Motif clues, execute "Peak2Gene Linkage Analysis" to establish physical connections between regulatory elements and target genes, then perform "TF-Peak-Gene Triplet Analysis" to integrate multi-dimensional evidence (TF-Peak binding, Peak-Gene correlation, TF activity consistency) for screening high-confidence regulatory relationships, validate actual TF binding activity at base resolution through "TF Footprint Analysis," and finally pinpoint key regulatory genes synergistically driven by multiple enhancers through "DORC Analysis."
Complete Regulatory Network Construction: If the goal is to systematically resolve genome-wide regulatory networks, it is recommended to directly use "SCENIC+ Analysis" to complete the full inference from TF to eRegulon to target gene. SCENIC+ significantly reduces false positives through chromatin accessibility constraints and is the gold standard for constructing regulatory networks. Combined with RSS scoring, cell type-specific regulatory factors can be identified, providing high-priority candidate targets for functional validation.
11.2 Progression and Linkage of Analysis Modules
Basic Analysis (Cell Annotation)
    ↓ drives
Differential Accessibility Analysis (Differential Peaks) ──→ Motif Analysis (Enriched TFs)
    ↓                              ↓
    └──────── Peak2Gene Linkage ──────┘
                     ↓
              TF-Peak-Gene Triplet
                     ↓
              TF Footprint Validation
                     ↓
              DORC Gene Pinpointing
                     ↓
         SCENIC+ Complete Regulatory Network (optional, systematic panoramic view)

Monocle3 Trajectory Analysis (optional, revealing dynamic changes of Peak/Motif/Gene along pseudotime)
11.3 Tool Selection Guide
Selecting appropriate analysis tools is key to ensuring analytical efficiency and result reliability. The following tool selection guide is based on the core advantages and applicable scenarios of each tool, helping you make decisions based on specific needs:
| Analysis Need | Recommended Tool | Key Considerations |
|---|---|---|
| Rapid completion of full-pipeline basic analysis | ArchR | High memory efficiency, comprehensive built-in functionality, suitable for large-scale datasets (>100K cells). Uses LSI iterative dimensionality reduction, enabling rapid completion of the entire workflow from quality control to clustering. |
| Integration with Seurat ecosystem required | Signac | Rich visualization, good third-party tool compatibility. Supports WNN multi-modal joint clustering, dynamically evaluating the relative contributions of RNA and ATAC modalities to cell similarity. |
| Multi-sample batch correction | Signac + Harmony/CCA | Flexible selection of correction algorithm. Harmony offers high computational efficiency, suitable for rapid multi-sample integration; CCA uses anchor-based integration strategy, suitable for scenarios with strong batch effects. UMAP visualization should be used to evaluate correction effectiveness. |
| Differential Peaks and functional enrichment | DifferentialAccessibility | Supports both Cluster vs All (cell type-specific) and Case vs Control (condition-specific) modes, performing efficient statistical testing based on presto::wilcoxauc, directly integrating ClosestFeature neighboring gene annotation with GO/KEGG enrichment analysis. |
| TF binding pattern inference | Motif Analysis + Footprint | Motif scoring reveals potential binding patterns; Footprint analysis validates actual binding activity at base resolution through Tn5 cleavage protection effects. Their combination achieves an evidence upgrade from "likely bound" to "actively engaged." |
| Regulatory element-target gene mapping | Peak2Gene + TF Trios | Peak2Gene establishes physical connections based on covariation assumptions; TF Trios integrates three-fold evidence of TF-Peak binding, Peak-Gene correlation, and TF activity consistency, quantifying multi-point joint regulatory intensity through Linkage Score. |
| Cell development/differentiation trajectory inference | Monocle3 | Reconstructs continuous developmental trajectories based on principal graph learning algorithm, supporting multi-modal joint analysis. Dynamic changes in Peak accessibility, Motif activity, and gene expression can be resolved within a unified pseudotime framework. |
| Genome-wide regulatory network | SCENIC+ | Gold-standard tool that significantly reduces false positives through chromatin accessibility constraints. Constructs complete regulatory units of eRegulon (TF + target genes + cis-regulatory elements), but has high computational resource requirements and requires construction of a custom cisTarget database. |
| Cell type-specific regulatory factors | DORC + SCENIC+ RSS | Complementary validation strategy. DORC identifies super target genes synergistically driven by multiple enhancers; SCENIC+ RSS scoring quantifies the specific enrichment degree of eRegulons across different cell types. Their combination can pinpoint high-priority candidate targets. |